

Seasonal forecasting of the hourly electricity demand applying machine and deep learning algorithms impact analysis of different factors
- PMID: 40102500
- PMCID: PMC11920270
- DOI: 10.1038/s41598-025-91878-0
Seasonal forecasting of the hourly electricity demand applying machine and deep learning algorithms impact analysis of different factors
Abstract
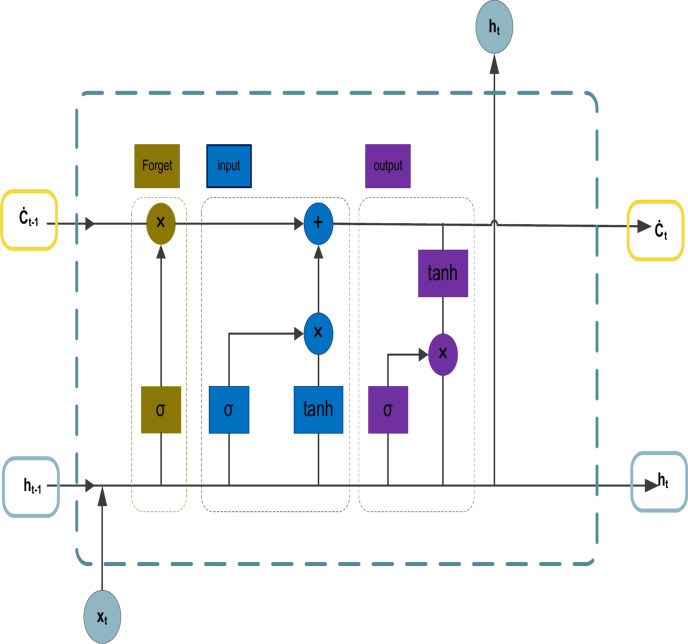
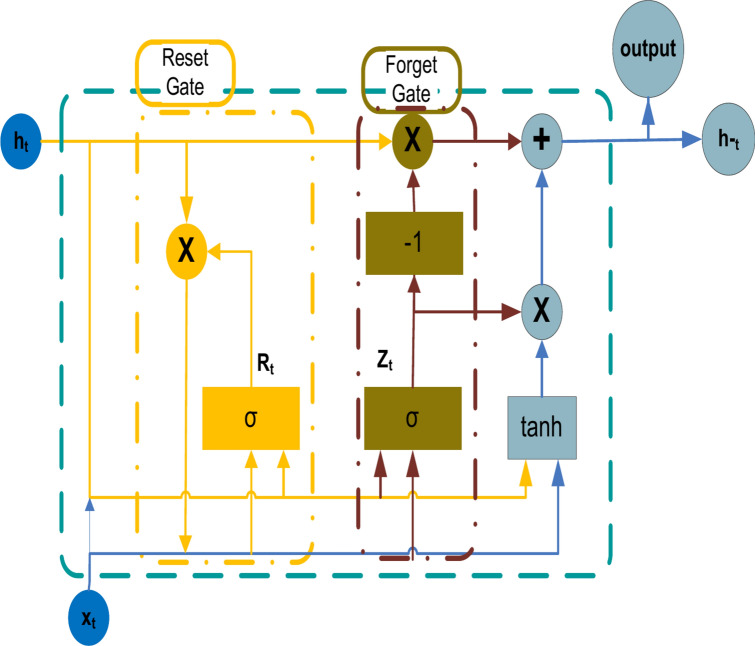
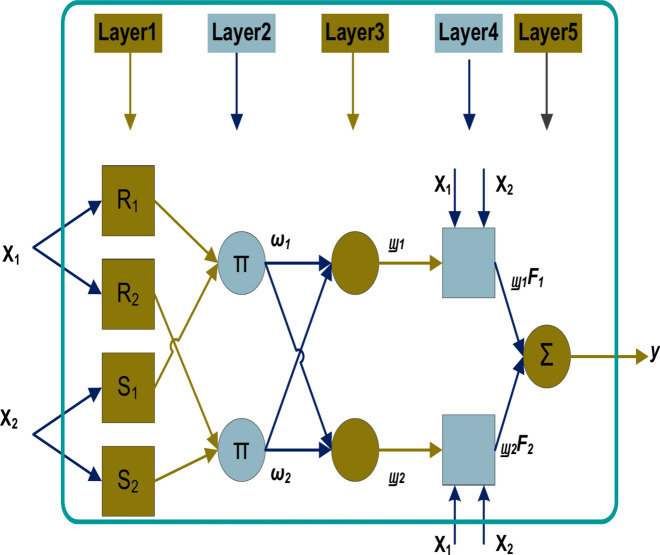
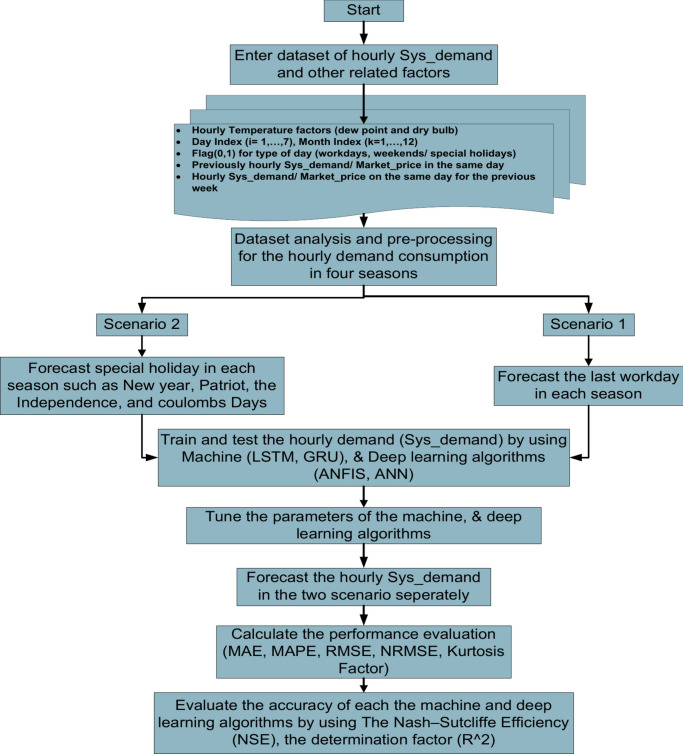
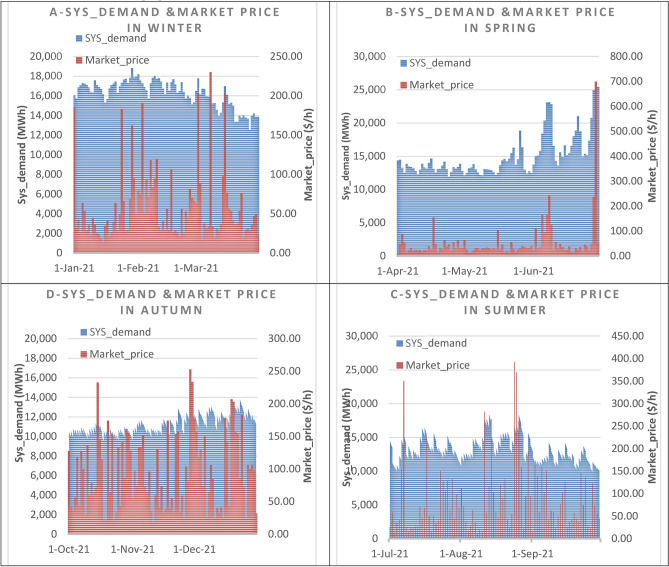
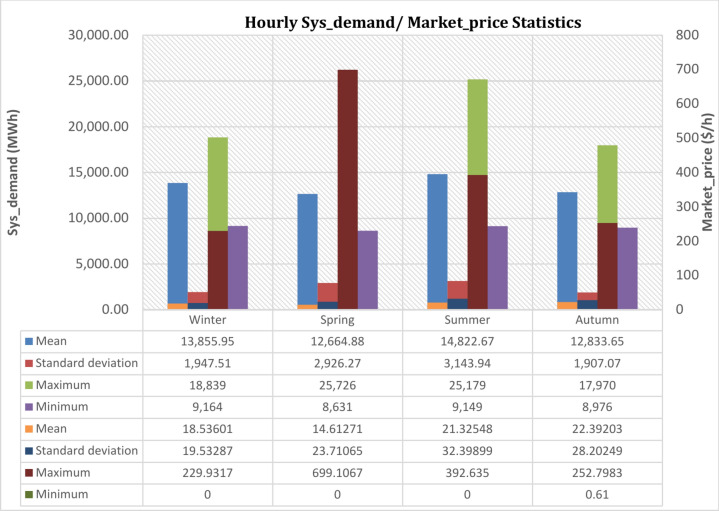
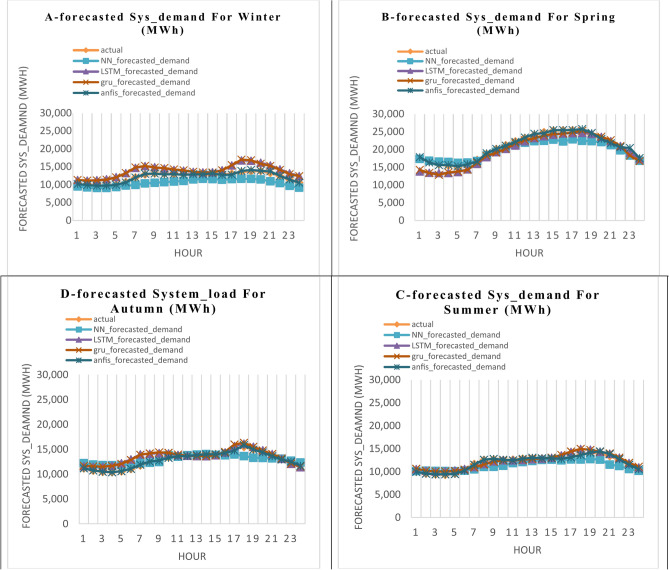
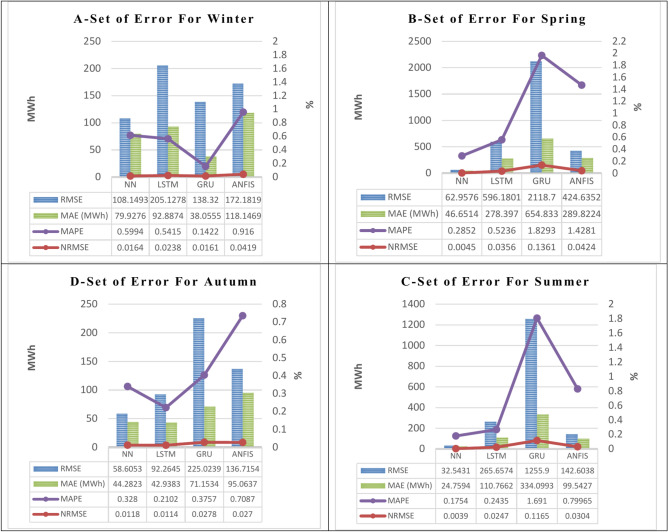
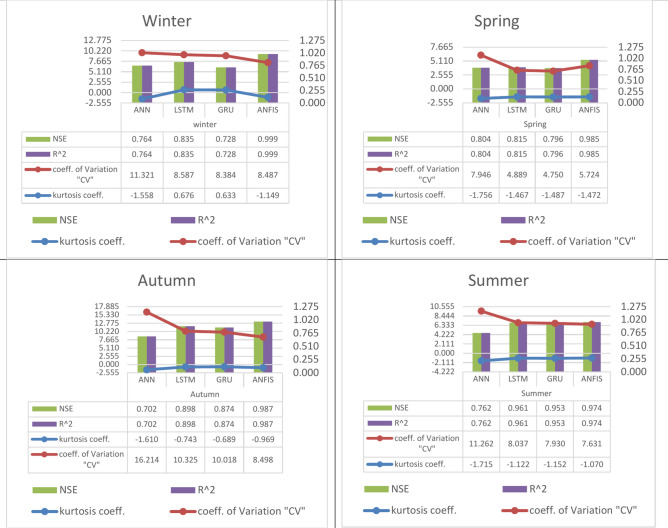
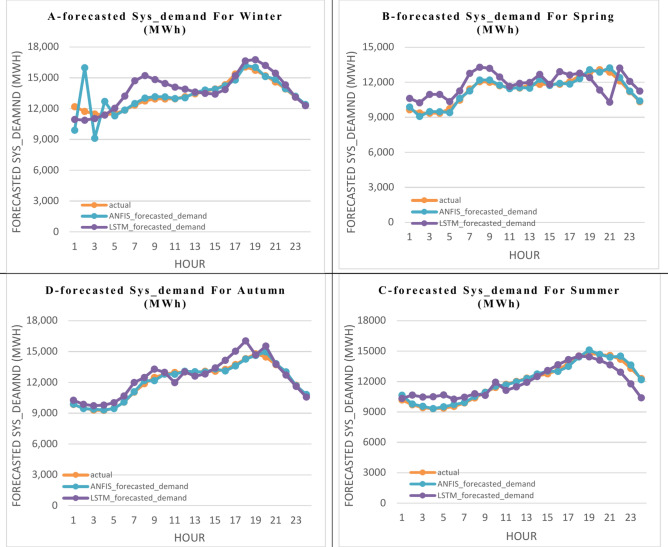
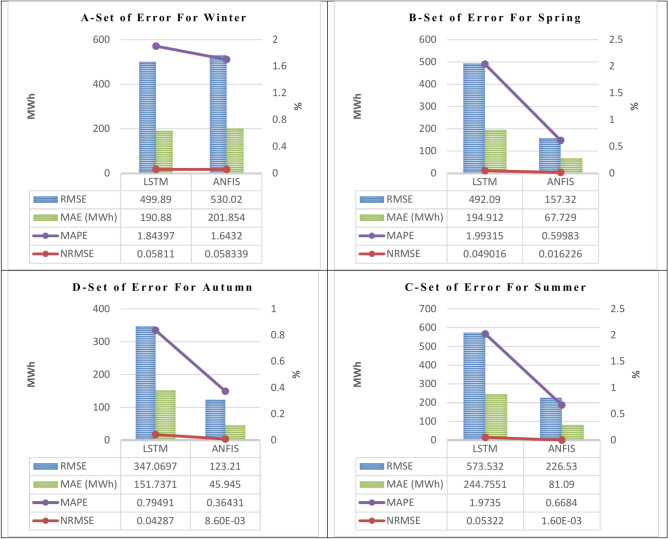
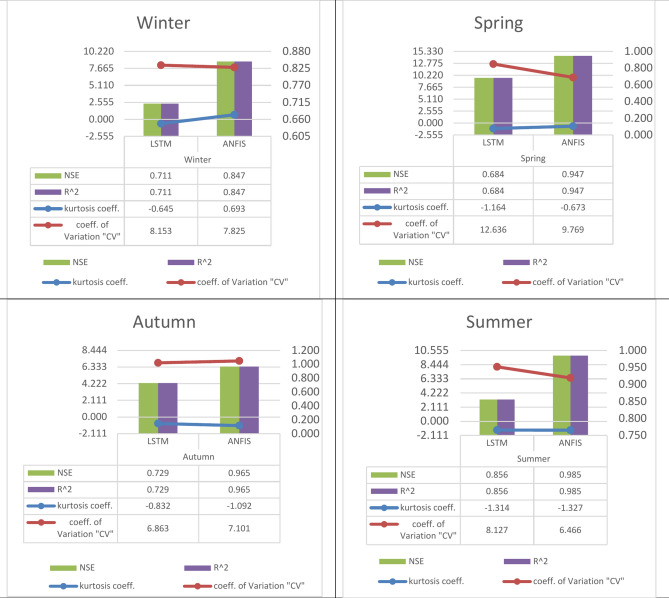
The purpose of this paper is to suggest short-term Seasonal forecasting for hourly electricity demand in the New England Control Area (ISO-NE-CA). Precision improvements are also considered when creating a model. Where the whole database is split into four seasons based on demand patterns. This article's integrated model is built on techniques for machine and deep learning methods: Adaptive Neural-based Fuzzy Inference System, Long Short-Term Memory, Gated Recurrent Units, and Artificial Neural Networks. The linear relationship between temperature and electricity consumption makes the relationship noteworthy. Comparing the temperature effect in a working day and a temperature effect on a weekend day where at night, the marginal effects of temperature on the demand in a working day for power are likewise at their highest. However, there are significant effects of temperature on the demand for a holiday, even a weekend or special holiday. Two scenarios are used to get the results by using machine and deep learning techniques in four seasons. The first scenario is to forecast a working day, and the second scenario is to forecast a holiday (weekend or special holiday) under the effect of the temperature in each of the four seasons and the cost of electricity. To clarify the four techniques' performance and effectiveness, the results were compared using the Mean Absolute Error (MAE), Root Mean Squared Error (RMSE), Normalized Root Mean Squared Error (NRMSE), and Mean Absolute Percentage Error (MAPE) values. The forecasting model shows that the four highlighted algorithms perform well with minimal inaccuracy. Where the highest and the lowest accuracy for the first scenario are (99.90%) in the winter by simulating an Adaptive Neural-based Fuzzy Inference System and (70.20%) in the autumn by simulating Artificial Neural Network. For the second scenario, the highest and the lowest accuracy are (96.50%) in the autumn by simulating Adaptive Neural-based Fuzzy Inference System and (68.40%) in the spring by simulating Long Short-Term Memory. In addition, the highest and the lowest values of Mean Absolute Error (MAE) for the first scenario are (46.6514, and 24.759 MWh) in the spring, and the summer by simulating Artificial Neural Networks. The highest and the lowest values of Mean Absolute Error (MAE) for the second scenario are (190.880, and 45.945 MWh) in the winter, and the autumn by simulating Long Short-Term Memory, and Adaptive Neural-based Fuzzy Inference System.
Keywords: Adaptive neuro-fuzzy inference system; Day-Type; Electricity price; Gated recurrent units; Hourly demand forecasting; Long short-term memory; Mean absolute percentage error; Temperature; Time-series forecasting.
© 2025. The Author(s).
Conflict of interest statement
Declarations. Competing interests: The authors declare no competing interests.
Figures
Similar articles
-
Time series forecasting of new cases and new deaths rate for COVID-19 using deep learning methods.Results Phys. 2021 Aug;27:104495. doi: 10.1016/j.rinp.2021.104495. Epub 2021 Jun 26. Results Phys. 2021. PMID: 34221854 Free PMC article.
-
Deep learning-based novel ensemble method with best score transferred-adaptive neuro fuzzy inference system for energy consumption prediction.PeerJ Comput Sci. 2025 Feb 21;11:e2680. doi: 10.7717/peerj-cs.2680. eCollection 2025. PeerJ Comput Sci. 2025. PMID: 40062252 Free PMC article.
-
Artificial Intelligence based accurately load forecasting system to forecast short and medium-term load demands.Math Biosci Eng. 2020 Dec 4;18(1):400-425. doi: 10.3934/mbe.2021022. Math Biosci Eng. 2020. PMID: 33525099
-
Application of machine learning in the prediction of COVID-19 daily new cases: A scoping review.Heliyon. 2021 Oct;7(10):e08143. doi: 10.1016/j.heliyon.2021.e08143. Epub 2021 Oct 11. Heliyon. 2021. PMID: 34660935 Free PMC article.
-
An Insight of Deep Learning Based Demand Forecasting in Smart Grids.Sensors (Basel). 2023 Jan 28;23(3):1467. doi: 10.3390/s23031467. Sensors (Basel). 2023. PMID: 36772509 Free PMC article. Review.
References
-
- Kaur, N. & Sood, S. K. An energy-efficient architecture for the internet of things (IoT). IEEE Syst. J.11, 796–805 (2017).
-
- Momami, M. Factors affecting electricity demand in jordan. Energy Power Eng.5, 50–58. 10.4236/epe.2013.51007 (2013).
-
- Mideksa, T. & Kallbekken, S. The impact of climate change on the electricity market: A review. Energy Policy38, 3579–3585 (2010).
-
- Julian, M. C. & Julian, P. Temperature effects on firms’ electricity demand: An analysis of sectorial differences in Spain. Appl. Energy142, 407 (2015).
-
- Hossein Motlagh, N., Mohammadrezaei, M., Hunt, J. & Zakeri, B. Internet of Things (IoT) and the Energy Sector. Energies13, 494 (2020).
LinkOut - more resources
Full Text Sources
