

Development and validation of risk prediction models for permanent hypocalcemia after total thyroidectomy in patients with papillary thyroid carcinoma
- PMID: 40102549
- PMCID: PMC11920412
- DOI: 10.1038/s41598-025-93867-9
Development and validation of risk prediction models for permanent hypocalcemia after total thyroidectomy in patients with papillary thyroid carcinoma
Abstract
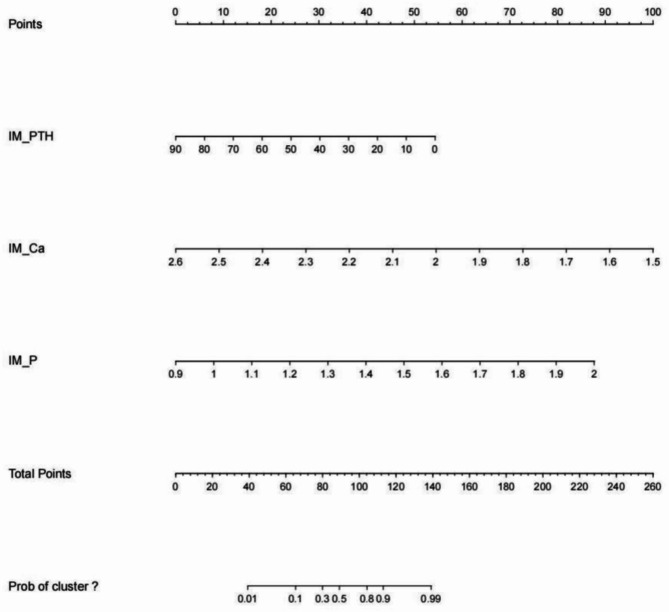
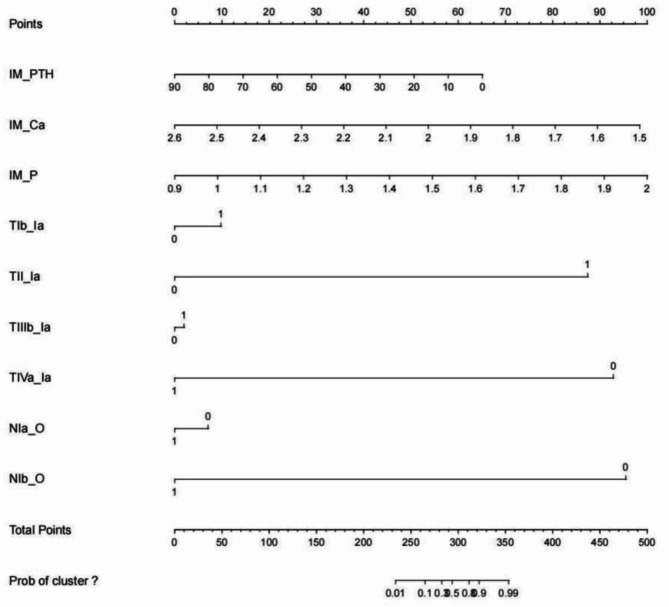
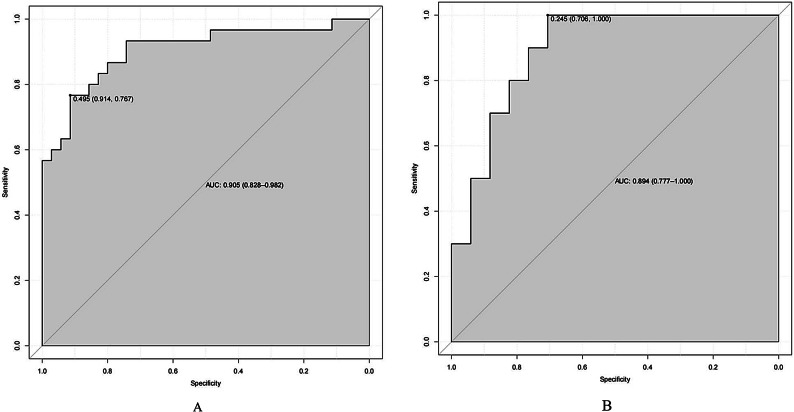
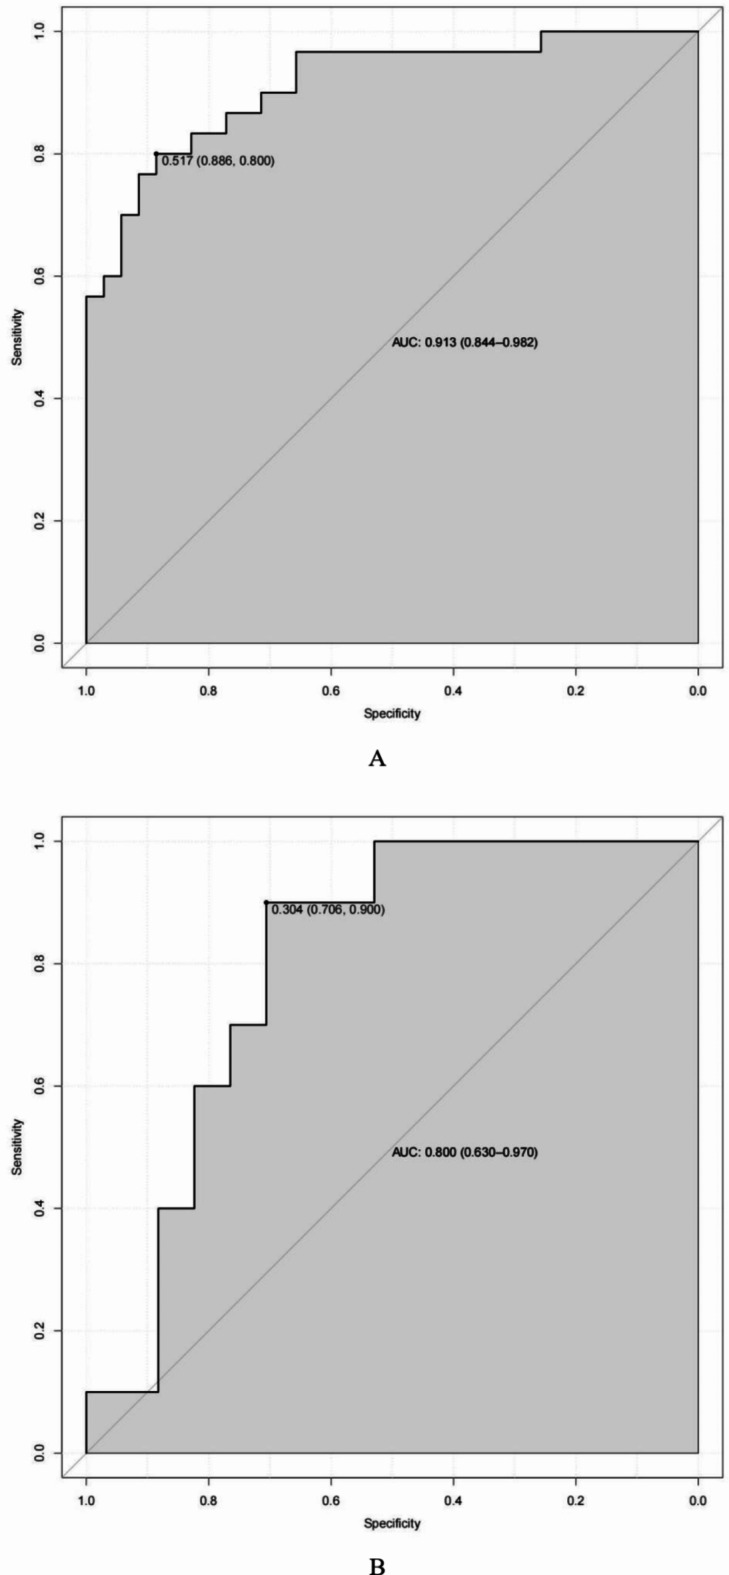
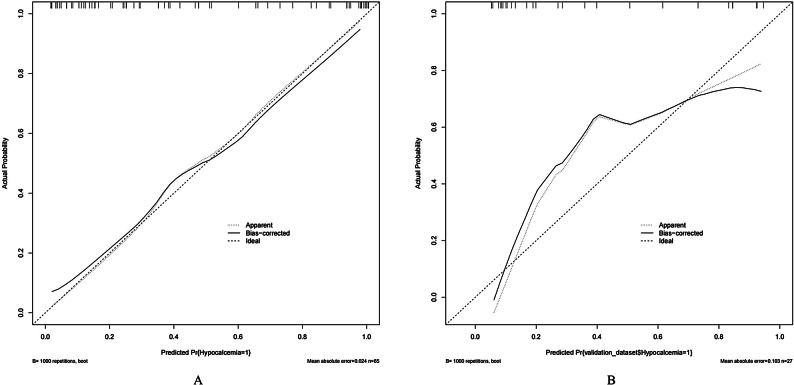
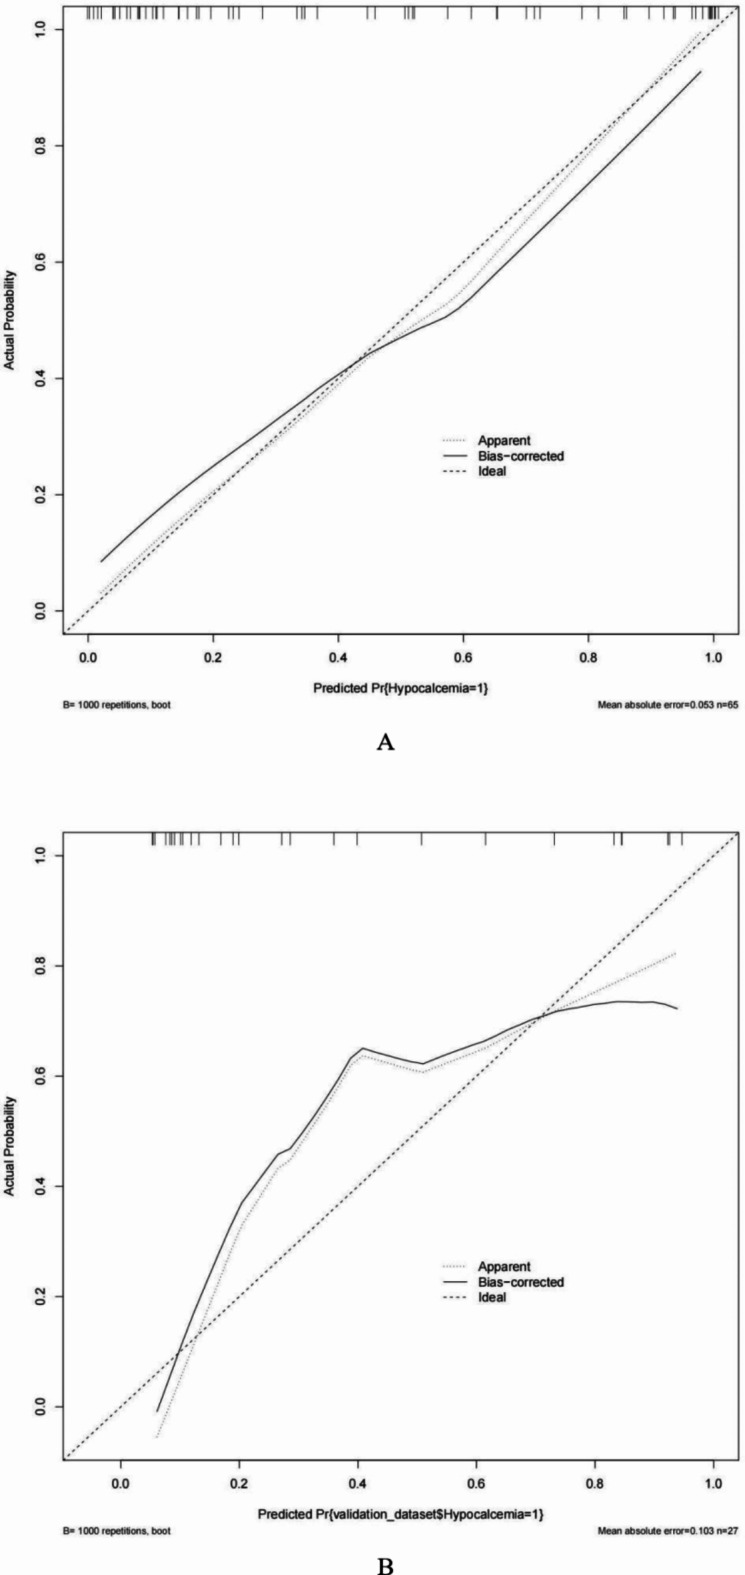
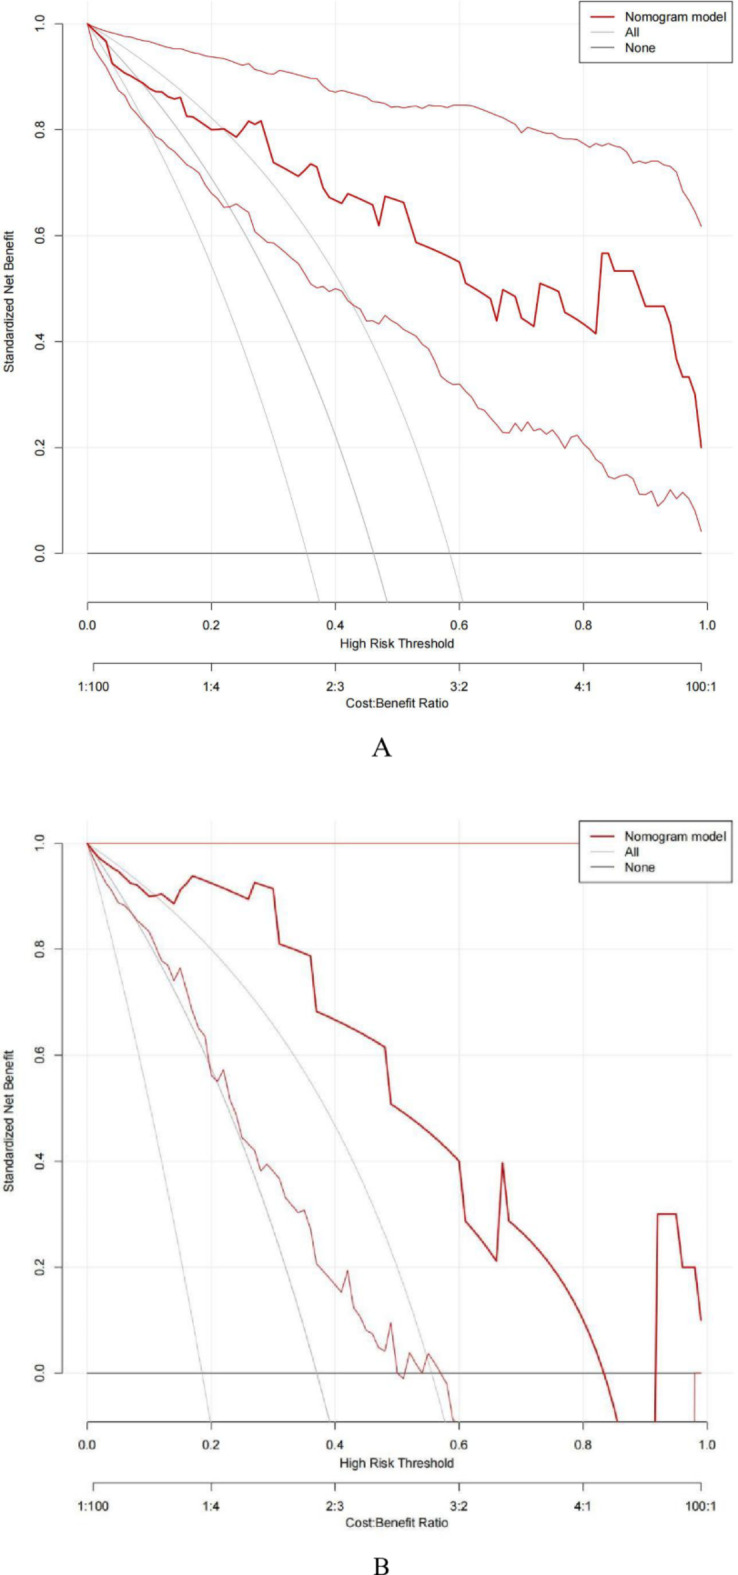
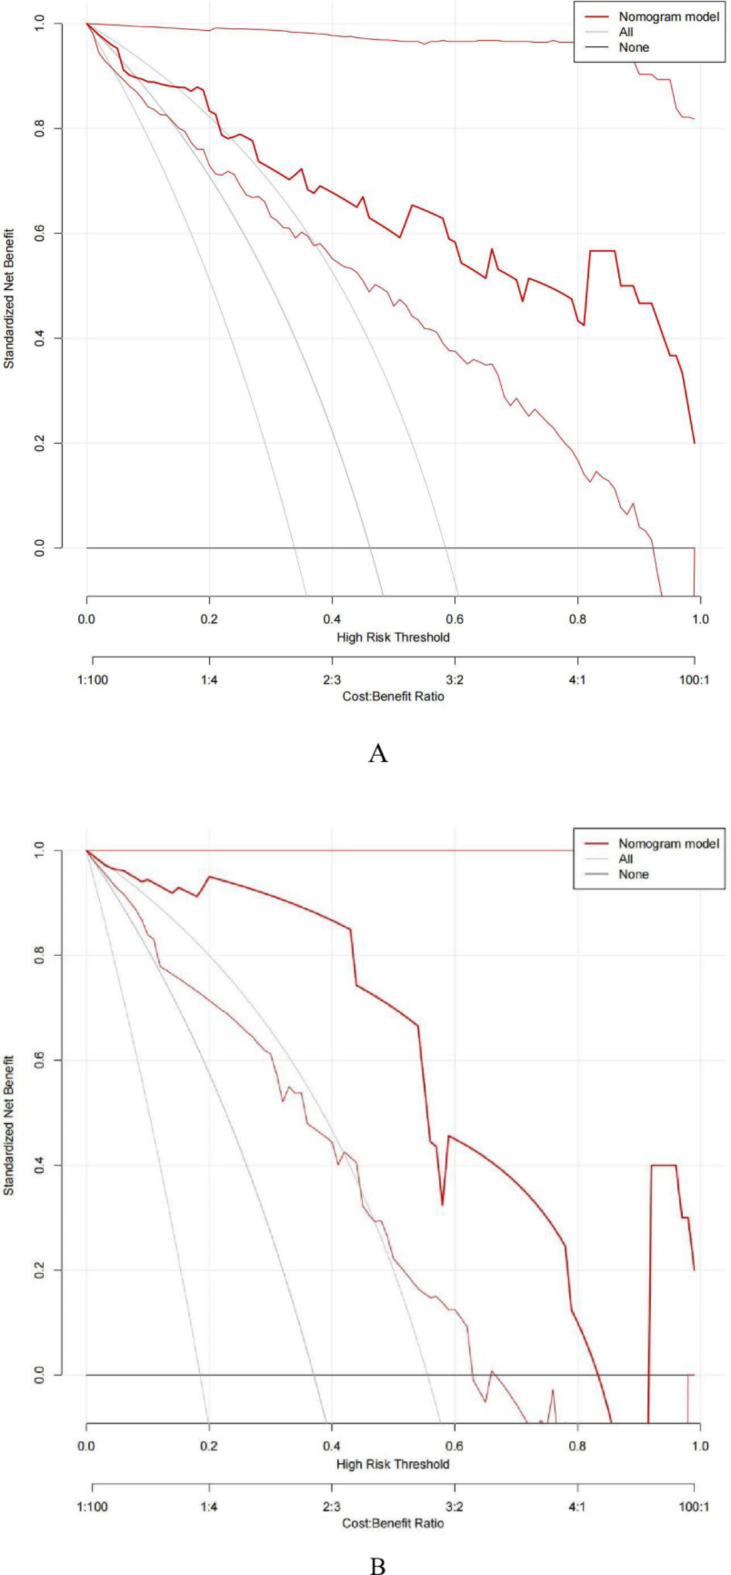
Hypocalcemia is a common complication and can be permanent in patients following total thyroidectomy (TT). The aim of this study was to identify factors associated with permanent hypocalcemia and to develop a validated risk prediction model for permanent hypocalcemia to assist surgeons in the appropriate follow-up of high-risk patients regarding supplemental therapy. We included data of 92 patients with papillary thyroid carcinoma (PTC) undergoing TT who were randomly allocated in a 7:3 ratio to a training set (n = 65) and validation set (n = 27). Univariate and multivariate logistic regression analyses revealed significant correlations of permanent hypocalcemia with parathyroid hormone (PTH) at postoperative month 1 (IM PTH), IM calcium (Ca), and IM phosphorus (P). These variables were constructed two models. Model 1 used the three indicators listed above; model 2 also included tumor, node, metastasis staging. The receiver operating characteristic (ROC) curve analysis showed that the areas under the curve (AUC) for models 1 and 2 were high for both the training set (0.905/0.913) and the validation set (0.894/0.800). Calibration curves showed good agreement between the incidence of permanent hypocalcemia estimated using the predictive models and the actual incidence. Model 1 may be more concise and convenient for clinical use.
Keywords: Hypocalcemia; Nomogram; Papillary thyroid carcinoma; Predictive model; Total thyroidectomy.
© 2025. The Author(s).
Conflict of interest statement
Declarations. Competing interests: The authors declare no competing interests. Ethical approval: The study was approved by the Ethics Committee of Benxi Central Hospital of China Medical University. This study adhered to the tenets of the Declaration of Helsinki. This was a retrospective study, and the data used were obtained from the electronic medical records at the hospital, with patient identifiers removed, so that patient privacy and related data would not be disclosed. The study was approved by the ethics committee of our institution, and informed consent was exempted.
Figures
References
Publication types
MeSH terms
Substances
LinkOut - more resources
Full Text Sources
Medical
