. 2025 Jul;30(7):3325-3337.
doi: 10.1038/s41380-025-02955-9. Epub 2025 Mar 18.

Recapitulation and reversal of neuropsychiatric phenotypes in a mouse model of human endogenous retrovirus type W expression

Affiliations

Recapitulation and reversal of neuropsychiatric phenotypes in a mouse model of human endogenous retrovirus type W expression

Felisa Herrero et al. Mol Psychiatry. 2025 Jul.

Abstract

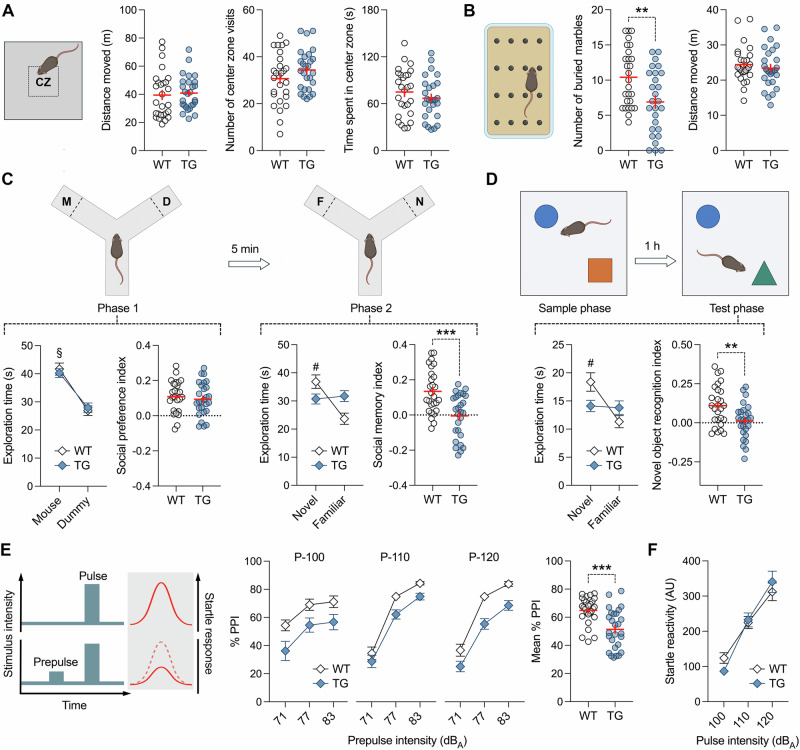
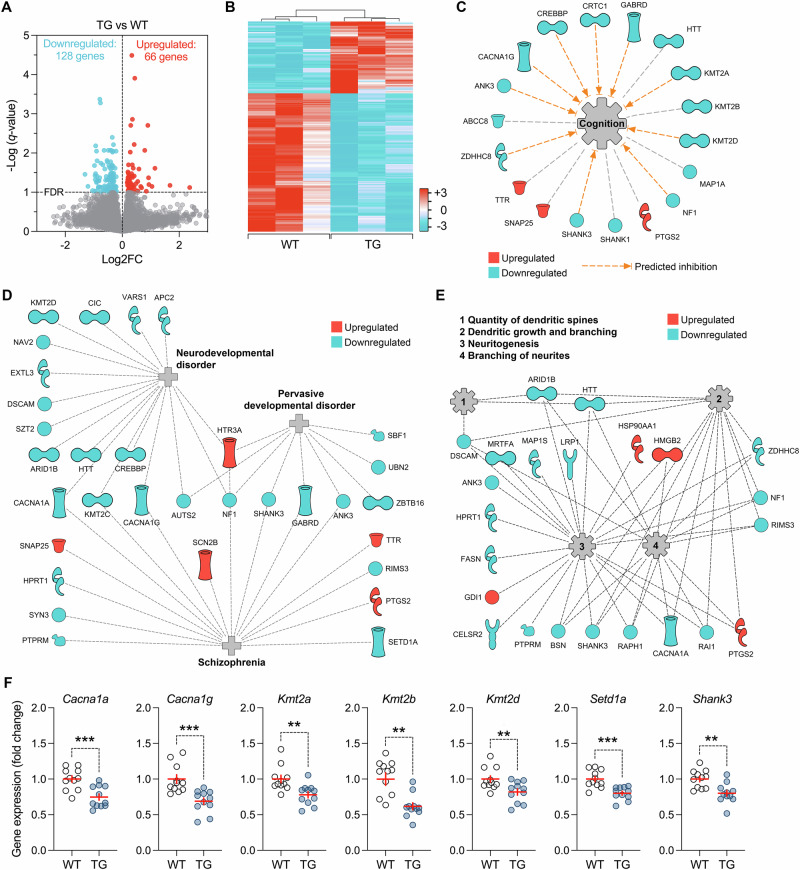
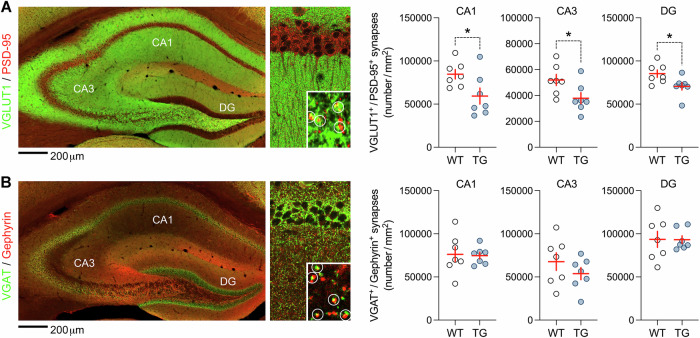
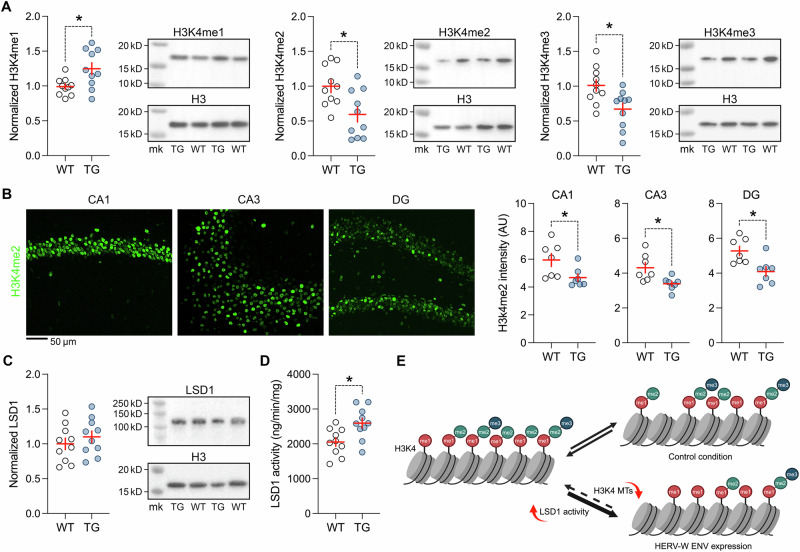
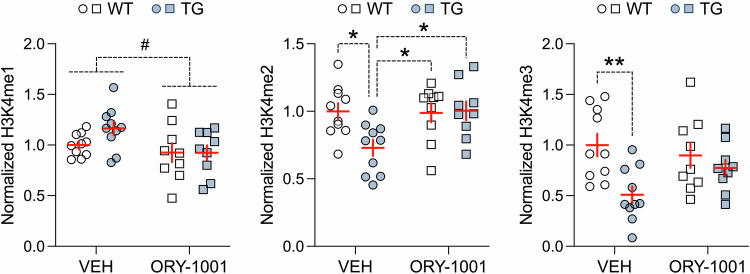
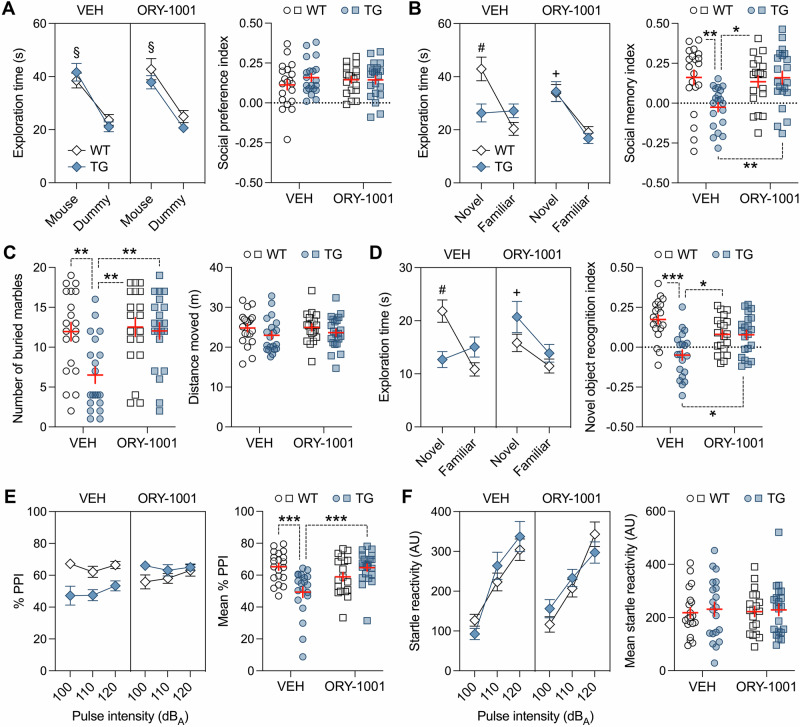
Human endogenous retroviruses (HERVs) are inherited genetic elements derived from exogenous retroviral infections occurring throughout evolution. Accumulating evidence implicates increased expression of HERV type W envelope (HERV-W ENV) in psychiatric and neurodevelopmental disorders. To gain more mechanistic insights into the neurobiological disease pathways affected by HERV-W ENV expression, we took advantage of a mouse model that recapitulates the expression of the human-specific HERV-W ENV protein. Behavioral and cognitive phenotyping of transgenic (TG) mice expressing HERV-W ENV and wild-type (WT) controls showed that expression of this retroviral envelope caused deficits in numerous functional domains, including repetitive behavior, social and object recognition memory, and sensorimotor gating. Genome-wide RNA sequencing of hippocampal tissue demonstrated that transgenic expression of HERV-W ENV led to transcriptomic alterations that are highly relevant for psychiatric and neurodevelopmental disorders, cognitive functions, and synaptic development. Differential gene expression in TG mice encompassed a downregulation of several genes associated with schizophrenia and autism spectrum disorder, including Setd1a, Cacna1g, Ank3, and Shank3, as well as a downregulation of histone methyltransferase genes that belong to the Set1-like histone H3 lysine 4 (H3K4) methyltransferase family (Kmt2a, Kmt2b and Kmt2d). Concomitant to the latter, HERV-W ENV mice displayed increased enzymatic activity of lysine-specific demethylase-1 (LSD1), increased H3K4 mono-methylation, and decreased H3K4 di- and tri-methylation in the hippocampus. Importantly, pharmacological inhibition of LSD1 through oral ORY-1001 treatment normalized abnormal H3K4 methylation and rescued the behavioral and cognitive deficits in HERV-W ENV mice. In conclusion, our study suggests that the expression of HERV-W ENV has the capacity to disrupt various behavioral and cognitive functions and to alter the brain transcriptome in a manner that is highly relevant to neurodevelopmental and psychiatric disorders. Moreover, our study identified epigenetic pathways that may offer avenues for pharmacological interventions against behavioral and cognitive deficits induced by increased HERW-W expression.


Conflict of interest statement

Competing interests: All authors declare that the research was conducted in the absence of any commercial or financial relationships that could be construed as a potential conflict of interest.

Figures

Fig. 1
Fig. 1. Behavioral and cognitive phenotypes of adult mice expressing HERV-W ENV.
All data were obtained from adult male transgenic CAGHERV-Wenv mice (TG) and wild-type (WT) littermates. A Total distance moved, distance moved in the center zone (CZ) and time spent in the CZ during the open field test. B Number of buried marbles and distance moved during the marble burying test. **p < 0.01, based on independent t-test (t(52) = 2.97, 2-tailed). C Phase 1 (D = dummy object, M = unfamiliar mouse) and phase 2 (F = familiar mouse; N = novel mouse) of the social interaction test, which assessed sociability and social memory, respectively. The line plots show the time spent with the unfamiliar mouse or dummy object in phase 1 of the test, or with the novel or familiar mouse in phase 2 of the test. The scatter plots depict the social preference index (values > 0 represent a preference toward the unfamiliar mouse) in phase 1 and the social memory index (values > 0 represent a preference toward the novel mouse) in phase 2 of the test. §p < 0.001, reflecting the significant main effect of object (F(1,52) = 57.13) in repeated-measures ANOVA; #p < 0.001, reflecting the significant difference between novel and familiar mouse exploration in WT mice, based on Šidák post-hoc test after the presence of a significant 2-way interaction between genotype and object (F(1,52) = 13.68, p < 0.001) in repeated-measures ANOVA; ***p < 0.001, based on independent t-test (t(52) = 4.09, 2-tailed). D Object recognition memory in the novel object recognition test, in which the animals were required to discriminate a novel object from a previously familiarized object. The line plot shows the time spent with the novel or familiar object during the test phase, whereas the scatter plot depicts the novel object recognition index (values > 0 represent a preference toward the novel object). #p < 0.001, reflecting the significant difference between novel and familiar object exploration in WT mice, based on Šidák multiple post-hoc test following a significant 2-way interaction between genotype and object (F(1,52) = 10.52, p < 0.001) in repeated-measures ANOVA; **p < 0.001, based on independent t-test (t(52) = 3.06; 2-tailed). E Prepulse inhibition (PPI) test of sensorimotor gating using 3 prepulse intensities (71, 77 and 83 dBA) and 3 pulse intensities (P-100, P-110 and P-120, which correspond to 100, 110 and 120 dBA). The line plots show % PPI as a function of prepulse and pulse intensities, whereas the scatter plot depicts the mean % PPI across all prepulse and pulse intensities. ***p < 0.001, reflecting the significant main effect of genotype (F(1,52) = 19.55) in repeated-measures ANOVA. F Acoustic startle reactivity (in arbitrary units, AU) to 100-, 110- and 120-dBA pulse stimuli. All scatter plots show individual mice with overlaid group means ± s.e.m; all line plots show group means ± s.e.m. All data are based on n = 27 mice in each genotype per test.
Fig. 2
Fig. 2. Transcriptomic alterations in the hippocampus of adult mice expressing HERV-W ENV.
Next-generation RNA sequencing was used to identify genome-wide transcriptional changes in the bulk hippocampus of adult male transgenic CAGHERV-Wenv mice (TG) and wild-type (WT) littermates. A The volcano plot depicts the statistical significance (-log [q-value]) versus the magnitude of gene expression changes (log2 fold change, Log2FC) in TG relative to WT mice (n = 3 per genotype). Using an FDR threshold of q < 0.1 and p < 0.0012, 128 genes (blue dots) and 66 genes (red dots) were down- and upregulated, respectively, in in TG relative to WT mice. B Hierarchical clustering of differentially expressed genes in TG relative to WT mice. The color-coded key denotes downregulation (blue) and upregulation (red) in terms of log2 ratios. C Graphical representation of differentially expressed genes annotated with the functional module “cognition” in Ingenuity Pathway Analysis. Predicted inhibition resulting from gene deregulation in TG mice is represented by dashed, orange arrows. D Graphical representation of differentially expressed genes annotated with the disease modules “neurodevelopmental disorder”, “pervasive developmental disorder”, and “schizophrenia”, as revealed by Ingenuity Pathway Analysis. E Graphical representation of differentially expressed genes annotated with the functional modules “quantity of dendritic spines”, dendritic growth and branching”, “neuritogenesis”, and “branching of neurites”, as revealed by Ingenuity Pathway Analysis. F Confirmation of gene expression changes in bulk hippocampal samples from TG relative to WT mice (n = 11 male mice per genotype) using qRT-PCR analyses. The scatter plots show fold changes of selected genes that were found to be downregulated in preceding RNA sequencing. **p < 0.01 and ***p < 0.001, based on independent t-tests (Cacna1a: t(20) = 3.94; Cacna1g: t(20) = 4.01; Kmt2a: t(20) = 3.19; Kmt2b: t(20) = 3.77; Kmt2d: t(20) = 2.81; Setd1a: t(20) = 4.34; Shank3: t(20) = 3.49).
Fig. 3
Fig. 3. Synaptic alterations in adult mice expressing HERV-W ENV.
Synaptic densities were quantified the CA1, CA3, and DG subregions of the hippocampus from adult male transgenic CAGHERV-Wenv mice (TG) and wild-type (WT) littermates. A The photomicrograph shows a representative double-immunofluorescence stain using VGLUT1 (green) as presynaptic and PSD-95 (red) as postsynaptic markers of excitatory neurons. Examples of VGLUT1+/PSD-95+ co-localizing synapses are highlighted by white circles in magnified sections. The scatter plots show the density (number/mm2) of VGLUT1+/PSD-95+ excitatory synapses in each subregion of the hippocampus from WT and TG mice. *p < 0.05 (CA1: t(12) = 2.35; CA3: t(12) = 2.32; DG: t(12) = 2.43), based on independent t-tests (two-tailed). B The photomicrograph shows a representative double-immunofluorescence stain using VGAT (green) as presynaptic and Gephyrin (red) as postsynaptic markers of inhibitory neurons. Examples of VGAT +/Gephyrin+ co-localizing synapses are highlighted by white circles in magnified sections. The scatter plots show the density (number/mm2) of VGAT +/Gephyrin+ inhibitory synapses in each subregion of the hippocampus from WT and TG mice. All scatter plots show individual mice with overlaid group means ± s.e.m.; n = 7 per genotype.
Fig. 4
Fig. 4. Abnormal H3K4 methylation and LSD1 activity in adult mice expressing HERV-W ENV.
All data were generated using hippocampal samples of adult male transgenic CAGHERV-Wenv mice (TG) and wild-type (WT) littermates. A Western blot analysis of H3K4me1 (*p < 0.05, t(18) = 2.25, 2-tailed), H3K4me2 (*p < 0.01, t(18) = 2.97, 2-tailed) and H3K4me3 (*p < 0.05, t(18) = 2.58, 2-tailed), normalized to H3 housekeeping control. The photographs show representative Western blots using H3K4me1, H3K4me2, H3K4me3, and H3 antibodies, with additional loading marks (mk). n = 10 per genotype. B Verification of reduced H3K4me2 using immunohistochemistry in the CA1 (*p < 0.05, t(12) = 2.37, 2-tailed), CA3 (*p < 0.05, t(12) = 2.81, 2-tailed) and DG (*p < 0.05, t(12) = 2.82, 2-tailed) region of the hippocampus of TG relative to WT mice. The photomicrographs show representative immunofluorescence H3K4me2 staining in the CA1, CA3 and DG regions. n = 7 per genotype. C Western blot analysis of LSD1, normalized to H3 housekeeping control. The photograph shows a representative Western blot using LSD1 and H3 antibodies, with additional loading marks (mk). n = 10 per genotype. D Enzymatic activity of LSD1, as measured with a fluorometric quantification assay; *p < 0.05 (t(18) = 2.16, 2-tailed); n = 10 per genotype. All scatter plots show individual mice with overlaid group means ± s.e.m. E Simplified schematic illustration of the proposed mechanism underlying altered H3K4 methylation dynamics in mice expressing HERV-W ENV relative to controls. Concurrent to the downregulation of H3K4 methyltransferases (H3K4 MTs; also see Fig. 3), increased enzymatic activity of LSD1 in HERV-W ENV mice may shift the methylation dynamics towards increased and decreased H3K4me1 and H3K4me2/me3, respectively.
Fig. 5
Fig. 5. Normalization of abnormal H3K4 methylation in the adult hippocampus through pharmacological inhibition of LSD1.
Male transgenic CAGHERV-Wenv mice (TG) and wild-type (WT) littermates were treated with the LSD1 inhibitor, ORY-1001, or corresponding vehicle (VEH). The scatter plots (with overlaid means ± s.e.m.) depict the Western blot analysis of H3K4 mono-methylation (H3K4me1), di-methylation (H3K4me2) and tri-methylation (H3K4me3), normalized to H3 housekeeping control, in the hippocampus of WT and TG mice. *p < 0.05 and **p < 0.01, based on Tukey’s post-hoc test following a significant 2-way interaction between genotype and treatment in ANOVA of H3K4me2 (F(1,34) = 4.89, p < 0.05) and H3K4me3 (F(1,34) = 4.18, p < 0.05). #p = 0.064, reflecting the main effect of treatment at statistical trend level (F(1,34) = 3.49). n(WT/VEH) = 10 mice, n(TG/VEH) = 10 mice, n(WT/ORY-1001) = 9 mice, and n(TG/ORY-1001) = 9 mice.
Fig. 6
Fig. 6. Normalization of adult behavioral and cognitive deficits in HERV-W ENV mice through pharmacological inhibition of LSD1.
Male transgenic CAGHERV-Wenv mice (TG) and wild-type (WT) littermates were treated with the LSD1 inhibitor, ORY-1001, or corresponding vehicle (VEH). A The line plot depicts the means ± s.e.m. of time spent with the unfamiliar mouse or dummy object, whereas the scatter plot (with overlaid means ± s.e.m.) shows the social preference index (values > 0 represent a preference toward the unfamiliar mouse) in phase 1 of the social interaction test. §p < 0.001, reflecting the significant main effect of object (F(1,76) = 87.53) in repeated-measures ANOVA. B The line plot depicts the means ± s.e.m. of time spent with the novel or familiar mouse, whereas the scatter plot (with overlaid means ± s.e.m.) depicts the social memory index (values > 0 represent a preference toward the novel mouse) in phase 2 of the social interaction test. #p < 0.001 and +p < 0.001, reflecting the significant difference between novel and familiar mouse exploration in VEH-treated WT mice and in ORY-1001-treated WT or TG mice, respectively, based on Šidák post-hoc test after the presence of a significant 3-way interaction between genotype, object and treatment (F(1,76) = 23.68, p < 0.001) in repeated-measures ANOVA. *p < 0.05 and **p < 0.01, based on Tukey’s post-hoc test following a significant 2-way interaction between genotype and treatment (F(1,76) = 7.61, p < 0.01) in ANOVA. C Number of buried marbles and distance moved during the marble burying test. **p < 0.01, based on Tukey’s post-hoc test following a significant 2-way interaction between genotype and treatment (F(1,76) = 5.21, p < 0.05) in ANOVA. D The line plot depicts the means ± s.e.m. of time spent with the novel or familiar object, whereas the scatter plot (with overlaid means ± s.e.m.) depicts the novel object recognition memory index (values > 0 represent a preference toward the novel object) in the novel object recognition test. #p < 0.001 and +p < 0.01, reflecting the significant difference between novel and familiar object exploration in VEH-treated WT mice and in ORY-treated WT or TG mice, respectively, based on Šidák multiple comparison post-hoc test after the presence of a significant 3-way interaction between genotype, object and treatment (F(1,76) = 19.24, p < 0.001) in repeated-measures ANOVA; *p < 0.05 and ***p < 0.001, based on Tukey’s post-hoc test following a significant 2-way interaction between genotype and treatment (F(1,76) = 4.32, p < 0.05) in ANOVA. E The line plots depict the means ± s.e.m. of % PPI averaged across different pulse intensities (100, 110 and 120 dBA); the scatter plot (with overlaid means ± s.e.m.) depicts the mean % PPI across all prepulse and pulse intensities. ***p < 0.001, based on Tukey’s post-hoc test following a significant 2-way interaction between genotype and treatment (F(1,76) = 17.05, p < 0.001) in repeated-measures ANOVA. F The line plots depict the means ± s.e.m. of startle reactivity (in arbitrary units, AU) to 100-, 110- and 120-dBA pulse stimuli, whereas the scatter plot (with overlaid means ± s.e.m.) shows the mean startle reactivity (in AU) across all pulse intensities. n(WT/VEH) = 20 mice, n(TG/VEH) = 20 mice, n(WT/ORY-1001) = 19 mice, and n(TG/ORY-1001) = 21 mice.

Similar articles

References

    1. Feschotte C, Gilbert C. Endogenous viruses: insights into viral evolution and impact on host biology. Nat Rev Genet. 2021;13:283–96. - PubMed
    1. Bourque G, Burns KH, Gehring M, Gorbunova V, Seluanov A, Hammell M, et al. Ten things you should know about transposable elements. Genome Biol. 2018;19:199. - PMC - PubMed
    1. Lander ES, Linton LM, Birren B, Nusbaum C, Zody MC, Baldwin J, et al. Initial sequencing and analysis of the human genome. Nature. 2001;409:860–921. - PubMed
    1. Geis FK, Goff SP. Silencing and transcriptional regulation of endogenous retroviruses: An overview. Viruses. 2020;12:884. - PMC - PubMed
    1. Küry P, Nath A, Créange A, Dolei A, Marche P, Gold J, et al. Human endogenous retroviruses in neurological diseases. Trends Mol Med. 2018;24:379–94. - PMC - PubMed