. 2025 Mar 19;8(1):167.
doi: 10.1038/s41746-025-01456-x.

Wearable data reveals distinct characteristics of individuals with persistent symptoms after a SARS-CoV-2 infection

Affiliations

Wearable data reveals distinct characteristics of individuals with persistent symptoms after a SARS-CoV-2 infection

Katharina Ledebur et al. NPJ Digit Med. .

Abstract

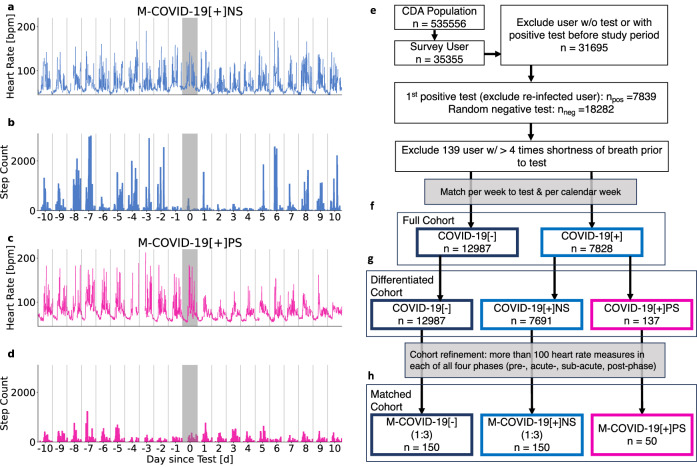
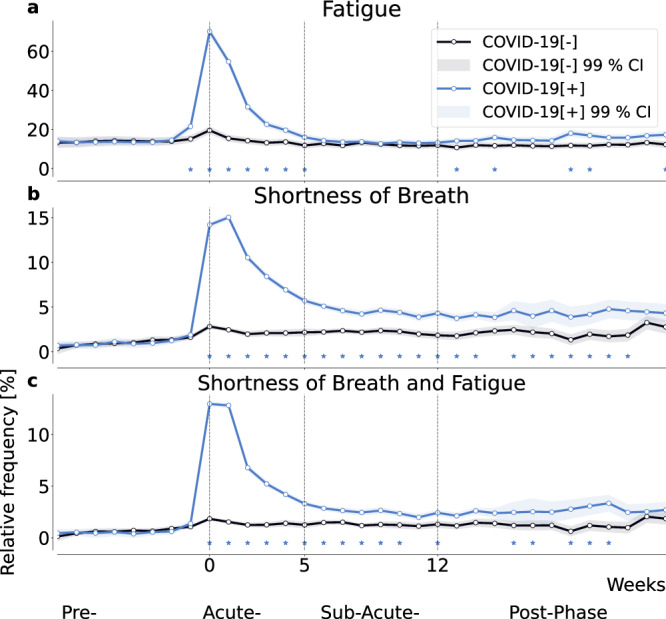
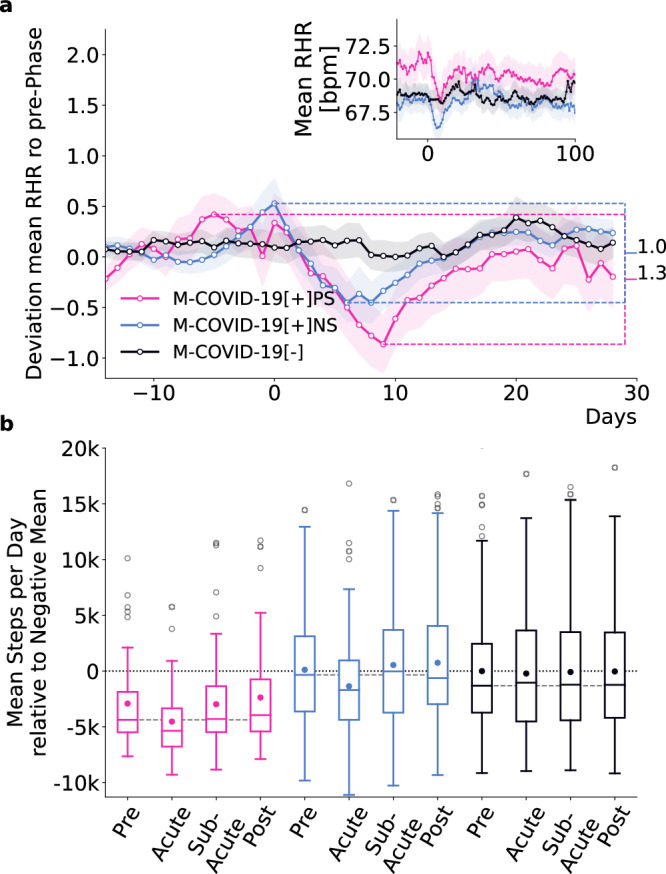
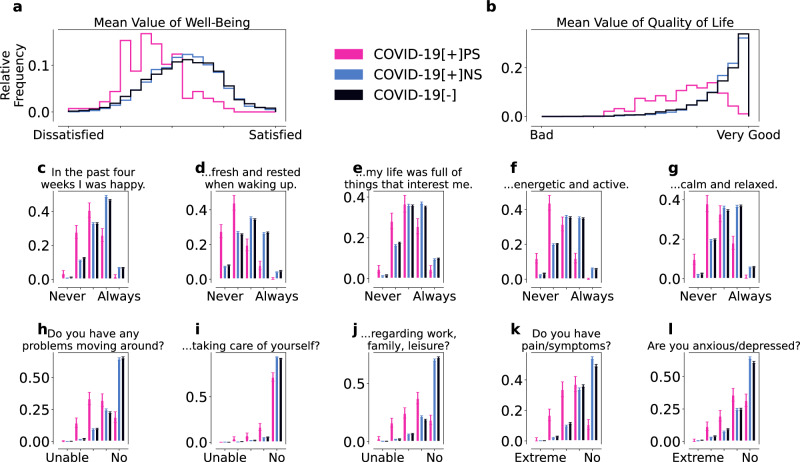
Understanding the factors associated with persistent symptoms after SARS-CoV-2 infection is critical to improving long-term health outcomes. Using a wearable-derived behavioral and physiological dataset (n = 20,815), we identified individuals characterized by self-reported persistent fatigue and shortness of breath after SARS-CoV-2 infection. Compared with symptom-free COVID-19 positive (n = 150) and negative controls (n = 150), these individuals (n = 50) had higher resting heart rates (mean difference 2.37/1.49 bpm) and lower daily step counts (mean 3030/2909 steps fewer), even at least three weeks prior to SARS-CoV-2 infection. In addition, persistent fatigue and shortness of breath were associated with a significant reduction in mean quality of life (WHO-5, EQ-5D), even before infection. Here we show that persistent symptoms after SARS-CoV-2 infection may be associated with pre-existing lower fitness levels or health conditions. These findings additionally highlight the potential of wearable devices to track health dynamics and provide valuable insights into long-term outcomes of infectious diseases.


Conflict of interest statement

Competing interests: The authors declare no competing interests.

Figures

Fig. 1
Fig. 1. Heart rate and step count changes around SARS-CoV-2 infection and cohort creation workflow.
Time series of two representative individuals from the CDA population (ad) and cohort diagram (eh). Average daily heart rate [bpm] (a, c) and step counts (b, d) per 15 min relative to the day of the reported positive SARS-CoV-2 test (shaded grey area). Heart rate and step count for an individual without persistent symptoms 10 days before and after a reported positive test (a, b). Response in RHR and step count is more pronounced for an individual reporting persistent shortness of breath and fatigue (c, d). Both participants exhibited reduced step count a day prior to the test and in the following days, with the participant reporting persistent symptoms showing prolonged reduction. e Workflow of cohort creation. f Full cohort encompassing a positive cohort (COVID-19[+]) and negative control cohort (COVID-19[−]). g Differentiated cohort encompassing the persistent symptoms cohort (COVID-19[+]PS), the positive control cohort (COVID-19[+]NS), and the negative control cohort (COVID-19[−]). h Matched cohort consisting of the persistent symptoms match cohort (MCOVID-19[+]PS), the positive match cohort (MCOVID-19[+]NS) and the negative match cohort (MCOVID-19[−]).
Fig. 2
Fig. 2. Reported symptom frequency in positive and negative control cohorts.
Relative frequency of self-reported fatigue (a), shortness of breath (b), and their combination (c), all relative to the week of the reported SARS-CoV-2 test for positive (P) individuals and a matched negative control (NC) cohort. Shading indicates the 99% confidence interval, i.e, 2.576 times the standard error of a binomial distribution. Asterisks indicate significant differences between the cohorts using a two-sided two proportion z-test with a significance level of 0.01.
Fig. 3
Fig. 3. Wearable data analysis of the match cohort.
a Z-transformed mean RHR (average of all 15-min RHR measurements within the last seven days) relative to the seasonal mean RHR with respect to the mean and standard deviation up to 7 days prior to the date of the reported test of all individuals in the M-COVID-19[+]PS (pink), M-COVID-19[+]NS (blue) and M-COVID-19[−] (black) cohorts. The difference between the maximum and minimum z-transformed RHR within 14 to and 20 days after the date of the reported SARS-CoV-2 test was more pronounced (1.3 vs 1.0) and more prolonged for M-COVID-19[+]PS than for M-COVID-19[+]NS. Shading indicates standard errors. The inset shows the average RHR relative to the SARS-CoV-2 test date. Already prior to the SARS-CoV-2 test, M-COVID-19[+]PS-individuals showed an increased RHR compared to M-COVID-19[+]NS and M-COVID-19[−]. b Average steps per day relative to the mean of M-COVID-19[−] during pre-phase (adjusted for seasonal variation) in all four phases for all individuals in all three cohorts. Boxes indicate quartiles, whiskers the range of the distribution of mean steps per day, scatter points outside the boxes mark the outliers (we do not show outliers >20k steps per day), and scatter points within the box mark the mean. The dashed grey line indicates the median of the mean steps per day during the pre-phase. Median values for M-COVID-19[+]PS were consistently below the seasonal mean of the CDA population and below the median of the two control cohorts across all phases, indicating lower activity levels compared to the control cohorts. Mean number of steps per day for M-COVID-19[+]PS were below the mean number of steps per day of the two control cohorts in all four phases. Likewise we found a reduction in the variance of the M-COVID-19[+]PS compared to the two control cohorts.
Fig. 4
Fig. 4. WHO-5 wellbeing (a, c–g) and modified EQ-5D/QoL (b, h–l) for the COVID-19[+]PS (pink), COVID-19[+]NS (blue), and COVID-19[−] (black) cohorts.
The individual WHO-5 and modified EQ-5D scores were both averaged to obtain the overall wellbeing (a) and QoL (b) scores, respectively. Overall, COVID-19[+]PS individuals reported more issues with wellbeing (cg) and QoL (hl) than the control cohorts. Error bars indicate standard errors. The responses from the COVID-19[+]PS cohort were significantly different (α < 0.001) from the responses of the two control cohorts, as determined by the Mann-Whitney U test. All responses of the two control cohorts were significantly different, except for the mean value of wellbeing (a), the mean value of QoL (b), and the questions “In the last four weeks I was calm and relaxed” (g) and “Do you have problems going around” (h).

Similar articles

References

    1. World Health Organization. Post COVID-19 condition (Long COVID). https://www.who.int/europe/news-room/fact-sheets/item/post-covid-19-cond....
    1. Davis, H. E., McCorkell, L., Vogel, J. M. & Topol, E. J. Long COVID: major findings, mechanisms and recommendations. Nat. Rev. Microbiol.21, 133–146 (2023). - PMC - PubMed
    1. Menges, D. et al. Burden of post-COVID-19 syndrome and implications for healthcare service planning: a population-based cohort study. PLoS ONE16, e0254523 (2021). - PMC - PubMed
    1. Radin, JM. et al. Long-term changes in wearablesensor data in people with and without Long Covid. NPJ Digit Med. 7, 246 (2024). - PMC - PubMed
    1. Ballering, A. V., Van Zon, S. K. R., Olde Hartman, T. C. & Rosmalen, J. G. M. Persistence of somatic symptoms after COVID-19 in the Netherlands: an observational cohort study. Lancet400, 452–461 (2022). - PMC - PubMed

LinkOut - more resources