. 2025 Mar 18;5(1):78.
doi: 10.1038/s43856-025-00756-3.

Titanium micro-particles are commonly found in soft tissues surrounding dental implants

Affiliations

Titanium micro-particles are commonly found in soft tissues surrounding dental implants

Carlotta Dionigi et al. Commun Med (Lond). .

Abstract

Background: Dental implants are one of the most frequently used medical devices for therapeutic purposes in dentistry. Peri-implantitis is a severe, microbial biofilm-associated condition, characterized by inflammation in peri-implant soft tissues and destruction of supporting bone. It has been suggested that metal particles originating from the implant may influence the local host response to microbial biofilms.

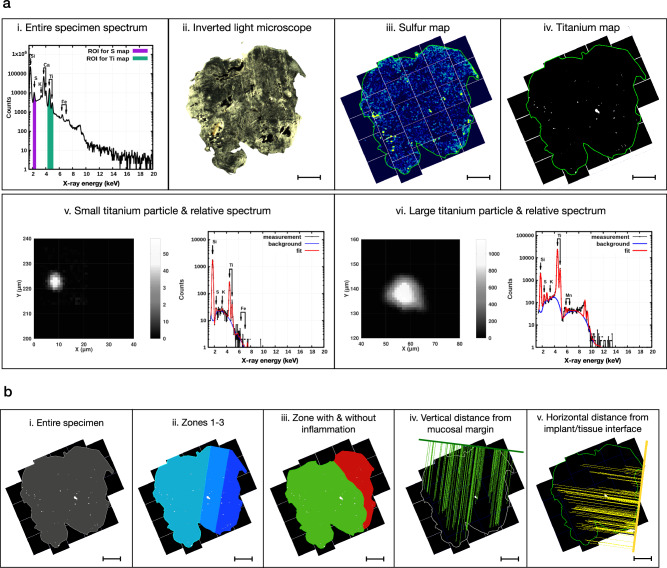
Methods: Soft tissue biopsies were collected from implant sites with and without peri-implantitis in 21 patients. Micro Proton-induced X-ray Emission (µ-PIXE) analysis was used to localize, quantify and characterize titanium micro-particles within tissues. RNA sequencing was performed to evaluate potential associations between titanium micro-particles and gene expression profiles in peri-implantitis lesions.

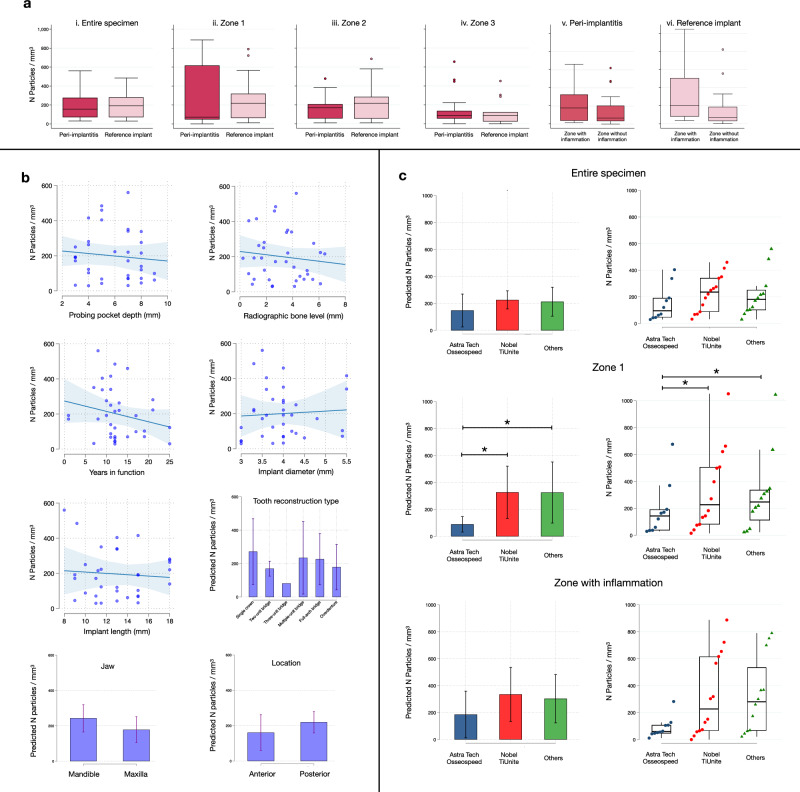
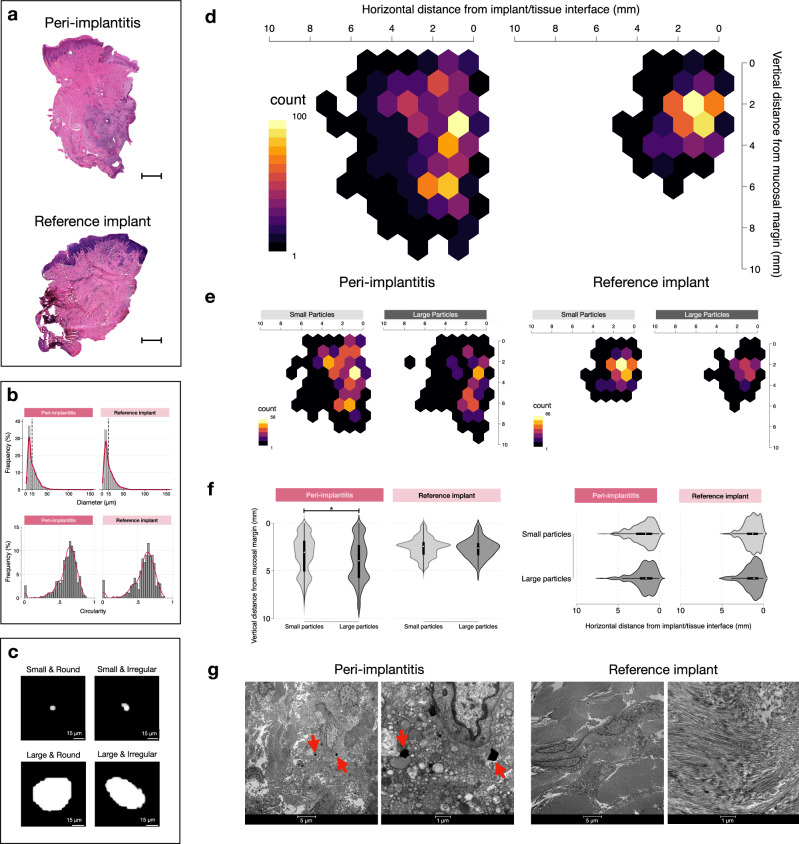
Results: Titanium micro-particles are consistent findings in soft tissues surrounding dental implants. Their occurrence varies across patients but not between sites with and without peri-implantitis within the same individual. Most particles reside in a 2-mm wide tissue portion close to the implant/tissue interface. The time in function of the implants does not influence the volumetric density of titanium micro-particles, while implant systems do. Fourteen differentially expressed genes are identified when comparing peri-implantitis samples with high and low densities of titanium micro-particles. The gene-set enrichment analysis reveals functions related to the regulation of the immune response and epithelial development.

Conclusions: The present results indicate that titanium micro-particles are commonly found in tissues surrounding dental implants and are not associated with the occurrence of peri-implantitis.

Plain language summary

Dental implants are frequently used in dentistry. Peri-implantitis is a severe condition in which micro-organisms such as bacteria grow excessively and cause inflammation in areas around the implants. This can result in destruction of supporting bone. It has been suggested that metal particles originating from the implant may influence how the body reacts to the presence of the bacteria. We analyzed samples of human soft tissue taken from implant sites with and without peri-implantitis. Titanium micro-particles were consistent findings in the soft tissue specimens regardless of the presence of peri-implantitis. The results indicate that titanium micro-particles are commonly found in tissues surrounding dental implants and are not associated with the occurrence of peri-implantitis.


Conflict of interest statement

Competing interests: T.B.: University institution grants: Dentsply Implants IH, Osteology Foundation; consulting fees and honoraria for lectures: Dentsply Implants IH; leadership or fiduciary role in other board, society, committee, or advocacy group: National Board of Health and Welfare, Sweden (National guidelines in Dentistry); Swedish Quality Registry for Caries and Periodontal Disease. J.D.: University institution grants: Eklund Foundation, Electro Medical Systems; honoraria for lectures: Osteology Foundation, Dentsply Sirona Implants, Straumann Group. C.T.: honoraria for lectures: Dentsply Sirona Implants, Straumann Group, Geistlich Pharma AG, Sweden & Martina. The other authors declare no competing interests.

Figures

Fig. 1
Fig. 1. Study outline. Illustrations created with BioRender.
a Clinical pictures from one representative patient. Reference implant (left) and implant with peri-implantitis (right) depicted before, during, and after the surgical intervention. b Schematic illustration of soft tissue biopsy retrieval. Twenty-one patients were recruited. One soft tissue biopsy, about 3–5 mm wide, was collected from one dental implant site with peri-implantitis and from one adjacent reference implant site. An additional tissue portion, about 1 mm wide, was collected from the same peri-implant sites in each patient. c Schematic illustration of soft tissue biopsy processing and applied methods for analysis. - Formalin-fixed paraffin-embedded samples were prepared for the localization, quantification, and characterization of titanium micro-particles. Three pairs of specimens (n = 6) were excluded from the analysis due to complications in sample preparation. Thus, a total of 36 sections, 20–50 μm thick, were analyzed with Micro Proton-Induced X-ray Emission (μ-PIXE). Three additional sections obtained from patients affected by periodontitis (i.e., with no dental implants) were used as negative controls. - Peri-implantitis specimens obtained from 10 patients were prepared for bulk RNA-sequencing analysis (RNA-seq). Specimens were divided in two groups depending on the volumetric density of titanium particles found in the corresponding FFPE samples. Differential gene expression analysis was performed comparing samples presenting with volumetric densities higher than the mean (Ti-high) to those presenting volumetric densities lower than the mean (Ti-low). One sample was excluded from the analysis due to the exclusion of the corresponding FFPE specimen. Thus, a total of 9 samples were analyzed. - Sections from 9 peri-implantitis FFPE (matched to samples analyzed with RNA-seq) were prepared for immunohistochemistry (IHC). - Samples from peri-implantitis and reference implant sites obtained from 11 patients were analyzed with transmission electron microscopy (TEM).
Fig. 2
Fig. 2. Micro Proton-induced X-ray Emission (μ-PIXE) - Image acquisition and analysis.
The implant/tissue interface is found on the right side of the sample in all images. a (i): Representative μ-PIXE spectrum relative to the entire soft tissue specimen, highlighting the regions of interest (ROIs) for map definition: sulfur (S) in purple, titanium (Ti) in green. a (ii): Representative image of a soft tissue specimen obtained by inverted light microscopy (ILM). Magnification: 5×. Scale bar: 1 mm. a (iii): Representative μ-PIXE map (S) of the entire soft tissue specimen. The sulfur map is compared with the ILM image and used to outline the perimeter of the entire specimen (green line). Scale bar: 1 mm. a (iv): Representative μ-PIXE map (Ti) of the entire soft tissue specimen. The perimeter of the specimen (green line) is obtained from the sulfur map. Scale bar: 1 mm. a (v): Characterization of one representative small (diameter ≤ 15 μm) titanium micro-particle and its relative μ-PIXE spectrum. a (vi): Characterization of one representative large (diameter > 15 μm) titanium micro-particle and its relative μ-PIXE spectrum. b (i): Depiction of the “entire specimen” ROI (in gray) used for image analysis. b (ii): Depiction of the “zone 1” (in dark blue—from the implant/tissue interface up to 1 mm), “zone 2” (in blue—from 1 to 2 mm) and “zone 3” (in light blue—from 2 mm and onwards) ROIs used for image analysis. Scale bar: 1 mm. b (iii): Depiction of the “zone with inflammation” (in red) and “zone without inflammation” (in green) ROIs used for image analysis. Scale bar: 1 mm. These two ROIs were determined by superimposing the Ti-maps over the corresponding Hematoxylin/Eosin-stained tissue sections prepared for immunohistochemical analysis (see Fig. 4a). b (iv): Illustration of the vertical linear measurements. The vertical distances between the mucosal margin and all the Ti micro-particles found in the tissue section are measured using the “minimal distance tool” of the image analysis software. This feature automatically draws perpendicular lines from the center of each particle to the reference line representing the mucosal margin (thick green line). Scale bar: 1 mm. b (v): Illustration of the horizontal linear measurements. The horizontal distances between the implant/tissue interface (thick yellow line) and all the Ti micro-particles found in the tissue section are measured using the “minimal distance tool” of the image analysis software. Scale bar: 1 mm.
Fig. 3
Fig. 3. Results of μ-PIXE analysis.
a Boxplots illustrate the volumetric density of titanium micro-particles observed in different ROIs in peri-implantitis (n = 18) and reference implant samples (n = 18; with exception of Zone 3 where n = 15). Median and IQR. Circles represent outliers. b Results of linear regression analysis: clinical measurements and implant-related characteristics. Scatterplots: each dot represents one implant (n = 36); bar graphs: mean and 95%CI. c Results of linear regression analysis: volumetric density of titanium micro-particles by implant system observed in the “entire specimen”, “zone 1” and “zone with inflammation” ROIs. Implant systems were grouped in three categories: Astra Tech Osseospeed (n = 10), Nobel TiUnite (n = 14), Others (n = 12). More details can be found in Table 1. Bar graphs: mean and 95% CI. Strip plots: median and IQR. Each dot represents one implant. *p = 0.024 (Astra Tech Osseospeed vs Nobel TiUnite); p = 0.047 (Astra Tech Osseospeed vs Others).
Fig. 4
Fig. 4. Results of μ-PIXE analysis (continued).
a Representative Hematoxylin & Eosin micrographs in one peri-implantitis and one reference implant specimen. The implant/tissue interface is found on the right side of the samples. Magnification 20×. Scale bars: 1 mm. b Distribution of diameter and circularity values of titanium particles in peri-implantitis (n = 1228) and reference implant (n = 663) sites. K-densities represented by red continuous lines. c Representative images of titanium micro-particles depending on size and shape. d Heatmaps illustrating the distribution of titanium micro-particles based on results from linear measurements in peri-implantitis and reference implant specimens. e Heatmaps representing the distribution of small and large particles based on results from linear measurements in peri-implantitis and reference implant specimens (peri-implantitis: small particles n = 755, large particles n = 473; reference implants: small particles n = 41, large particles n = 251). f Violin plots representing the distribution of small and large particles based on results from linear measurements in peri-implantitis and reference implant specimens. *p < 0.0001, Mann-Whitney U test. g Representative TEM images illustrating sections from peri-implantitis and reference implant specimens. Red arrows indicate metal-like particles. Magnification: 1600× & 6700×.
Fig. 5
Fig. 5. Results of RNA-sequencing and immunohistochemical analyses.
a Volcano plot representing DEGs found comparing Ti-high and Ti-low. Up-regulated genes (red), down-regulated genes (blue). b Heatmap illustrating the 20 genes with strongest gene expression levels (Log2FC) found comparing Ti-high and Ti-low. c Circo-plots illustrating up- and down-regulated Gene Ontology (GO) pathways and relative genes (in bold). d Circo-plots illustrating up- and down-regulated Reactome pathways and relative genes (in bold). e Bar graphs illustrating the density of positive cells in Ti-low (n = 6) and Ti-high (n = 3) groups. Mean and 95% CI. *p = 0.0253, Mann-Whitney U test. f Representative pictographs of positive cells in Ti-low and Ti-high specimens. Magnification × 400.

Similar articles

References

    1. Regulation (EU) 2017/745 of the European Parliament and of the Council of 5 April 2017 on medical devices, amending Directive 2001/83/EC, Regulation (EC) No 178/2002 and Regulation (EC) No 1223/2009 and repealing Council Directives 90/385/EEC and 93/42/EEC (Text with EEA relevance).
    1. SKaPa Årsrapport 2022: Svenskt kvalitetregister för Karies och Parodontit (in Swedish). Karlstad: sjuhäradsbygdens Tryckeri AB; 2022. The Swedish Quality registry for Caries and Periodontal diseases. https://www.skapareg.se/other-language/ (2022).
    1. Berglundh, T. et al. Peri-implant diseases and conditions: consensus report of workgroup 4 of the 2017 World Workshop on the Classification of Periodontal and Peri-Implant Diseases and Conditions. J. Periodontol.89, S313–S318 (2018). - PubMed
    1. Schwarz, F., Derks, J., Monje, A. & Wang, H. L. Peri-implantitis. J. Periodontol. Jun.89, S267–S290 (2018). - PubMed
    1. Lang, N. P. & Berglundh, T. Working Group 4 of Seventh European Workshop on Periodontology. Periimplant diseases: where are we now? Consensus of the Seventh European Workshop on Periodontology. J. Clin. Periodontol.38, 178–181 (2011). - PubMed

LinkOut - more resources