. 2025 Apr;7(4):842-853.
doi: 10.1038/s42255-025-01242-9. Epub 2025 Mar 18.

AI-driven framework to map the brain metabolome in three dimensions

Affiliations

AI-driven framework to map the brain metabolome in three dimensions

Xin Ma et al. Nat Metab. 2025 Apr.

Abstract

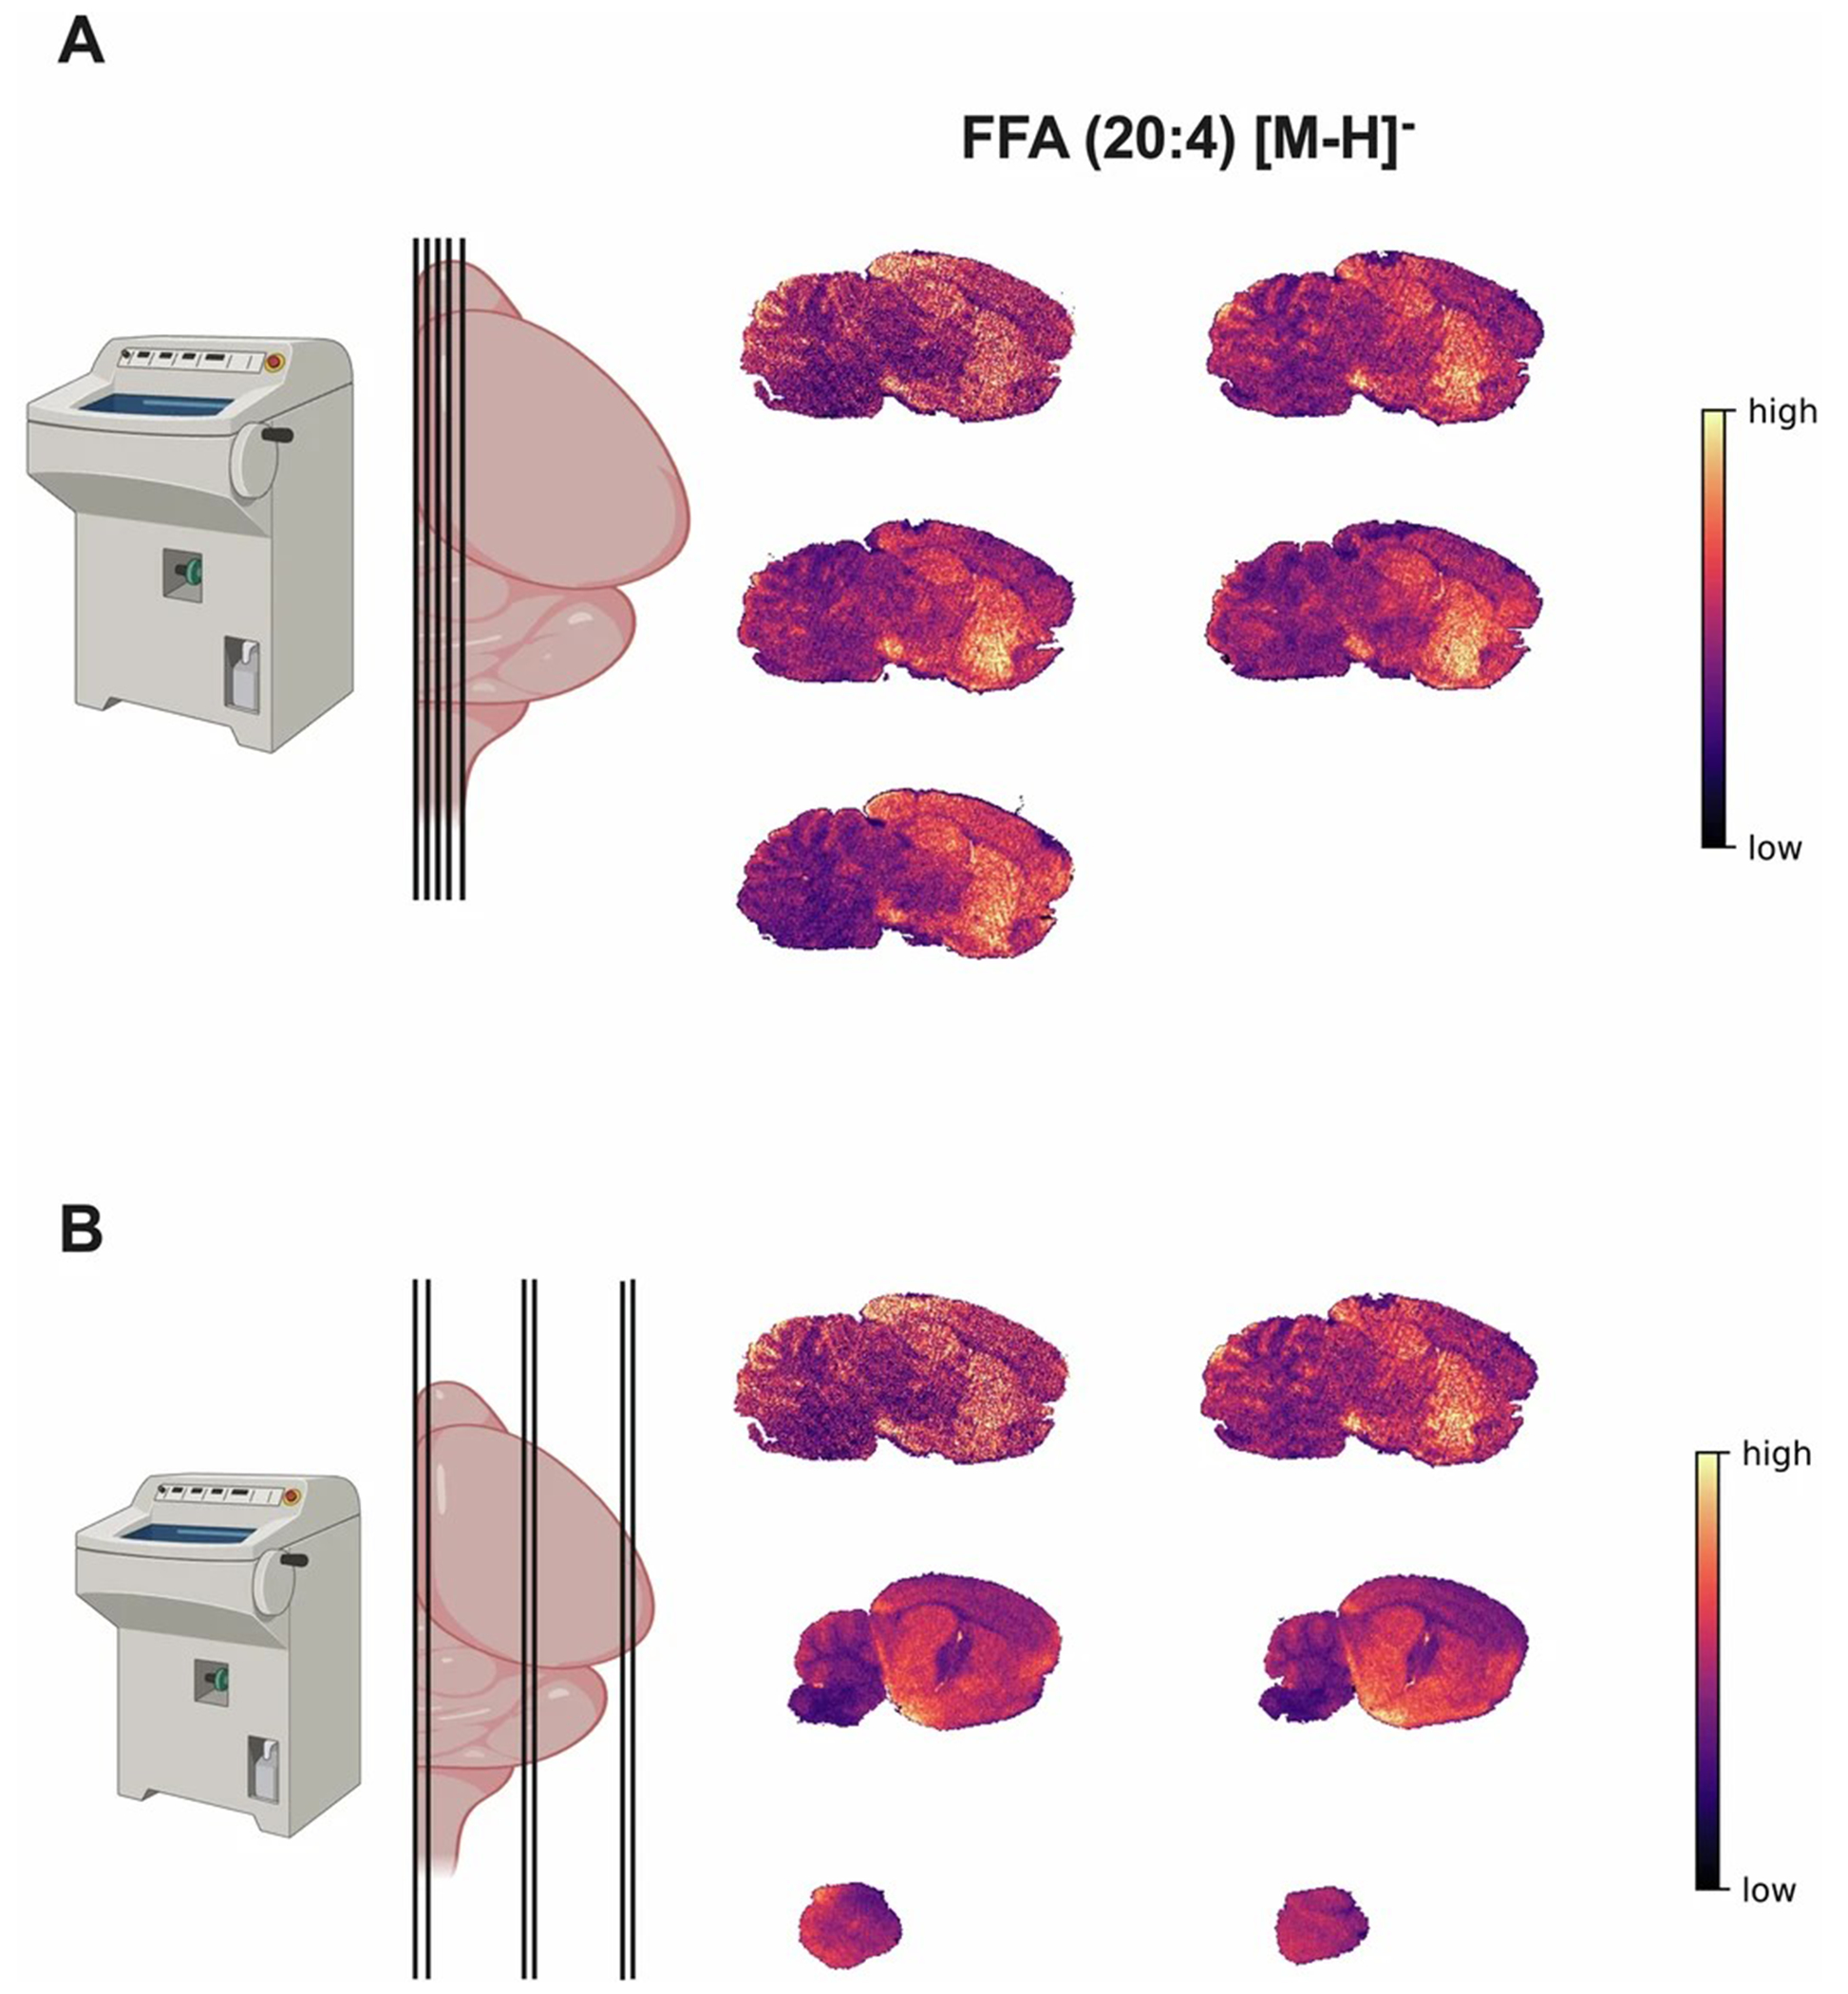
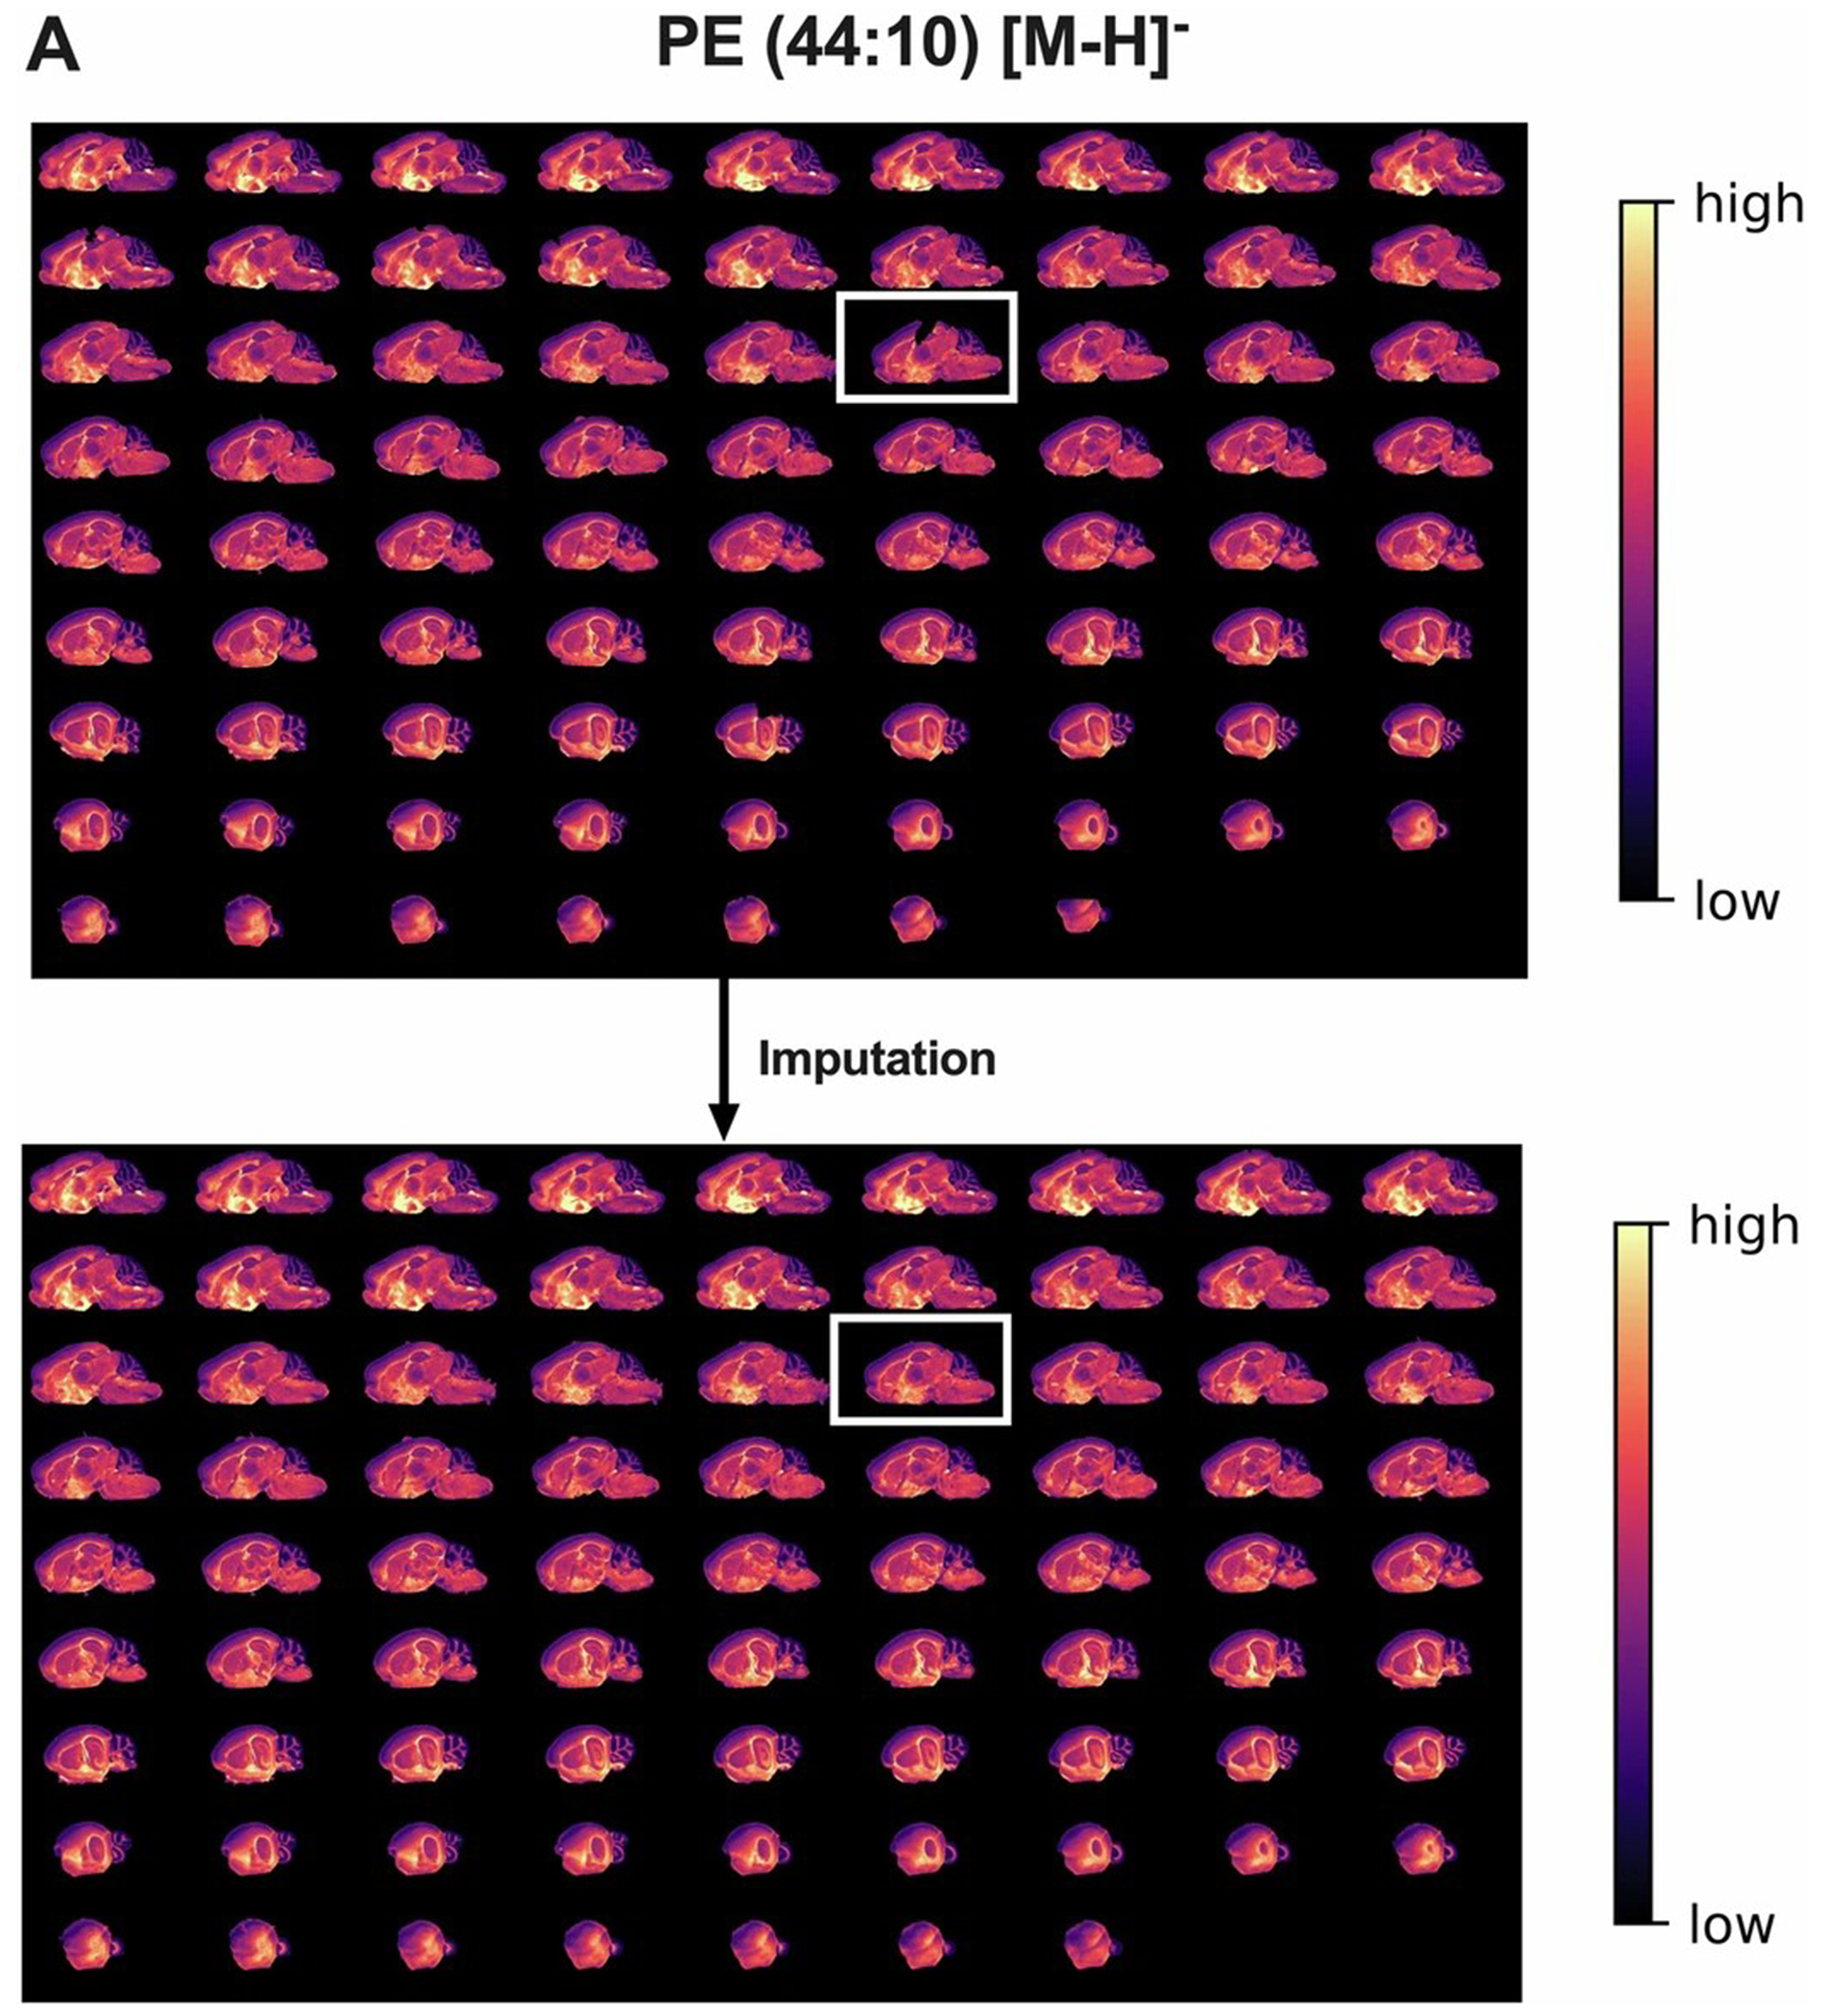
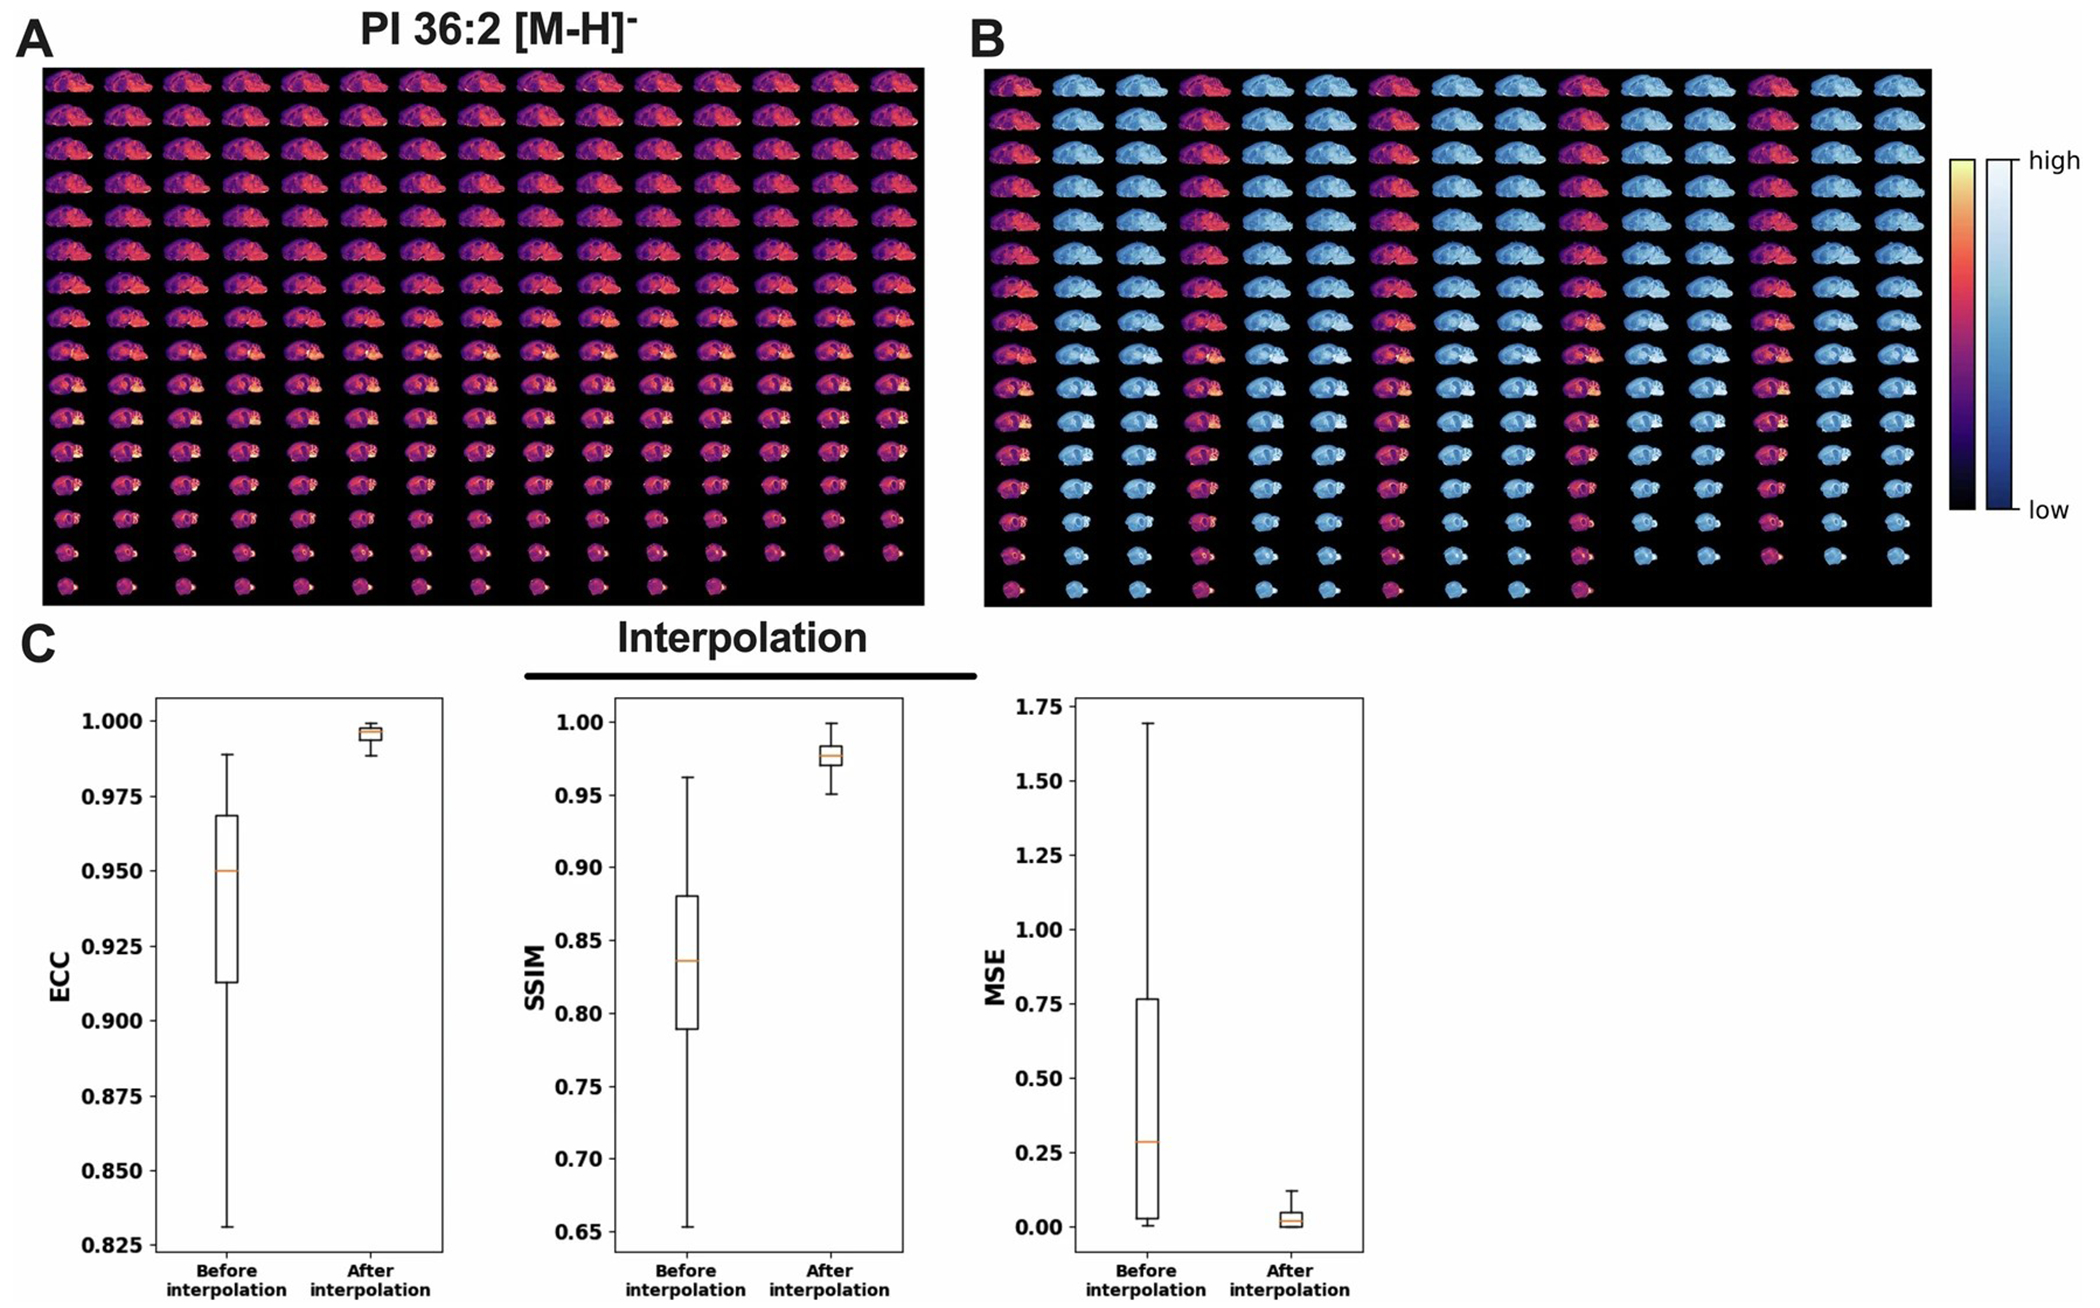
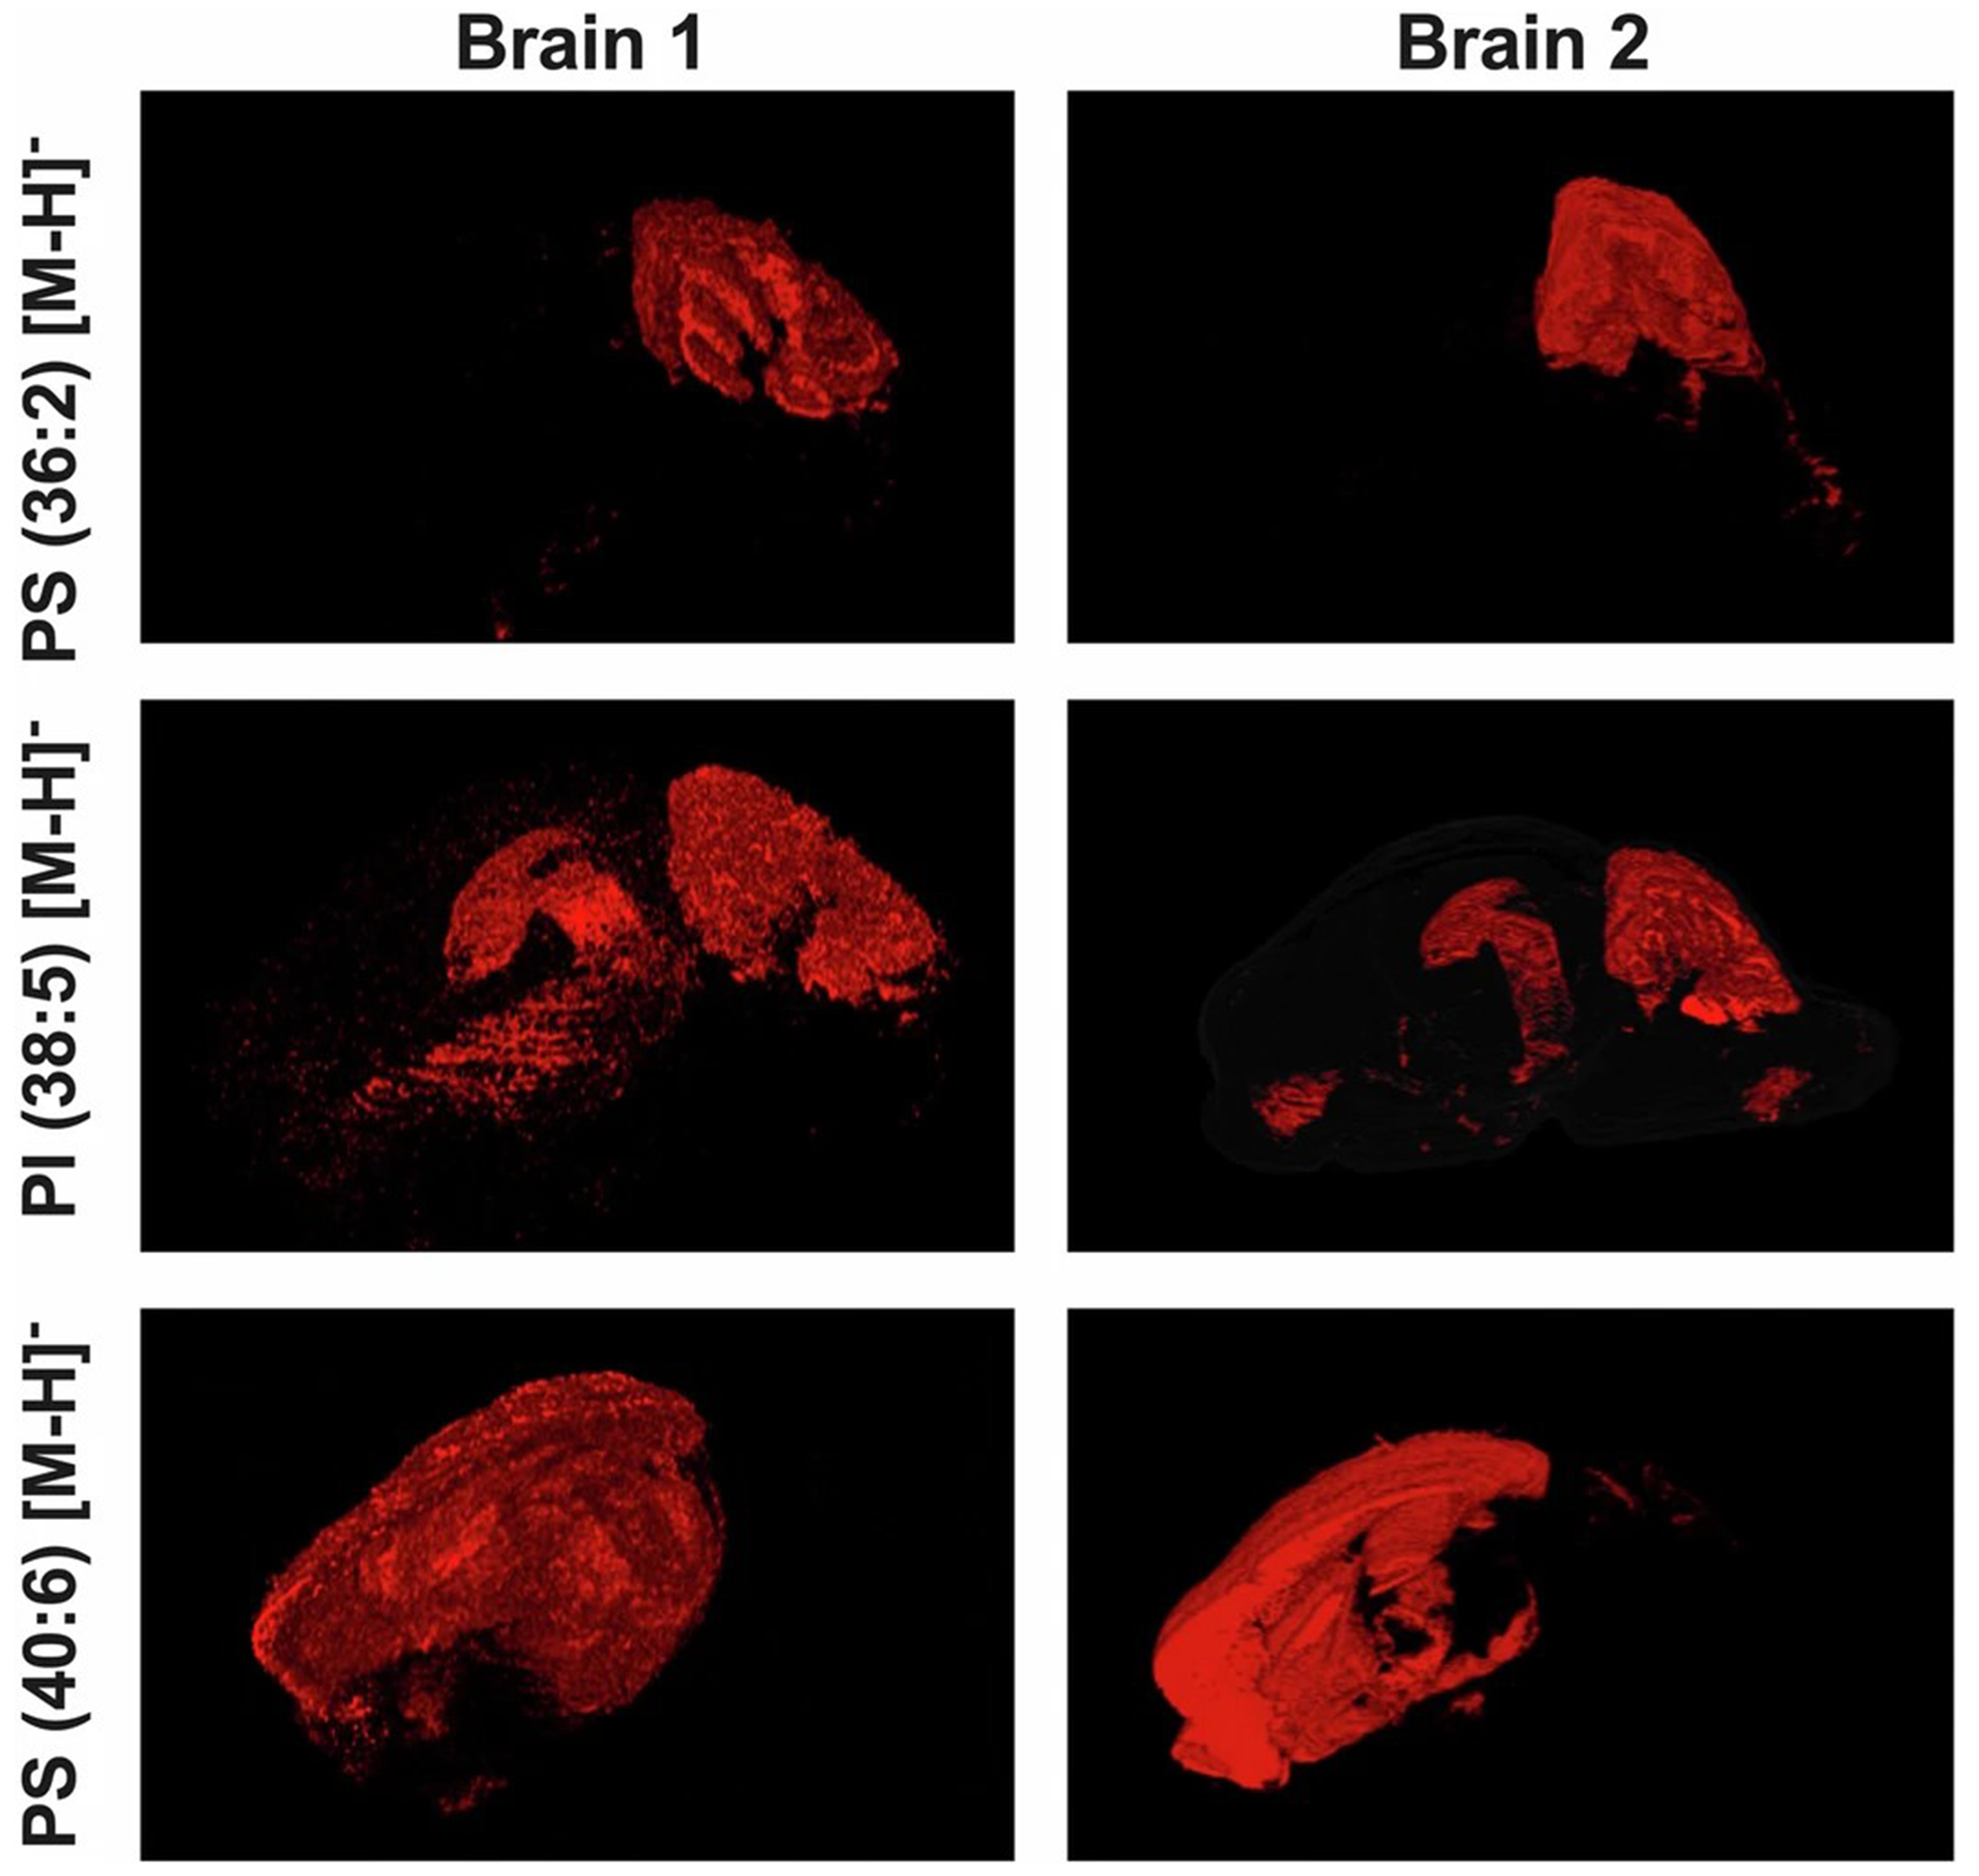
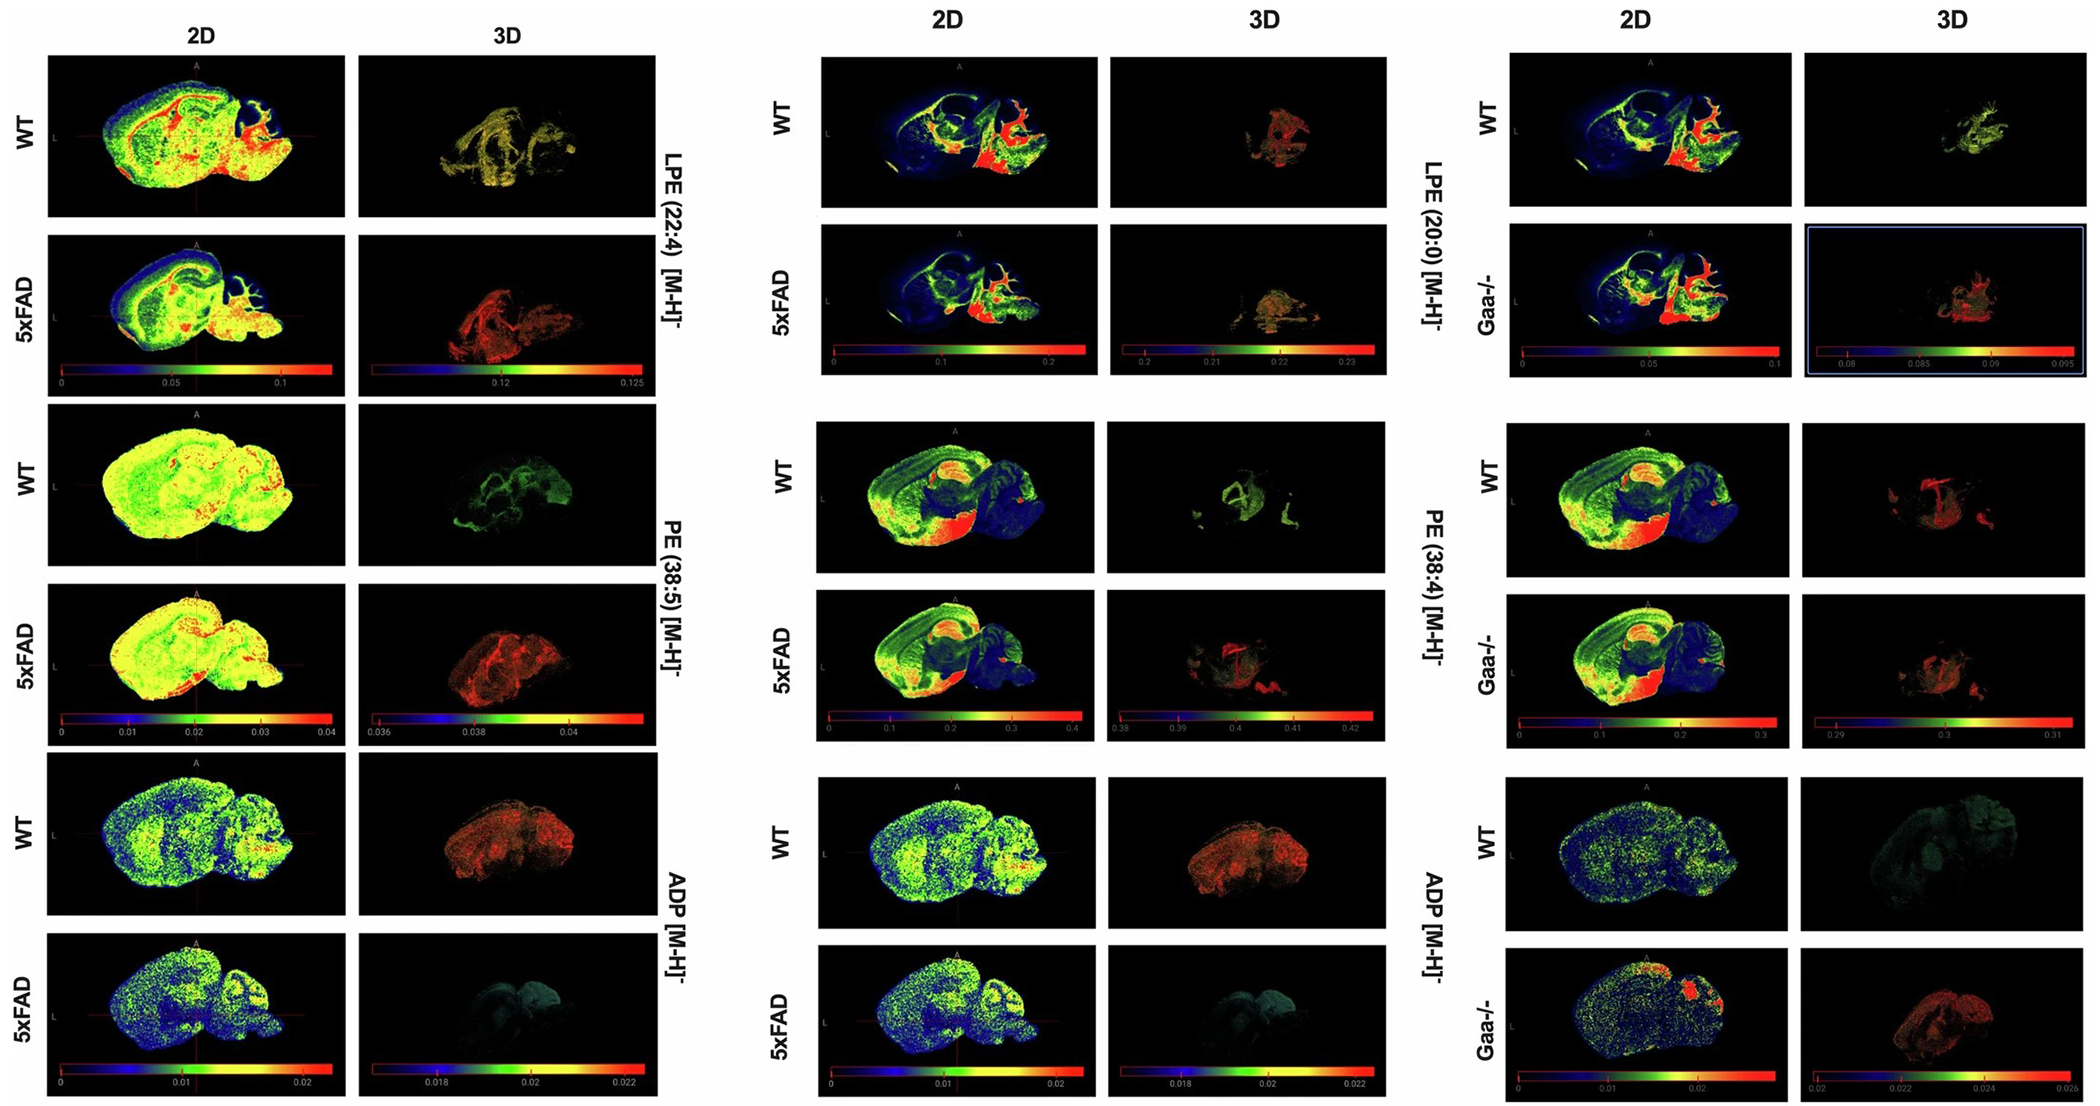
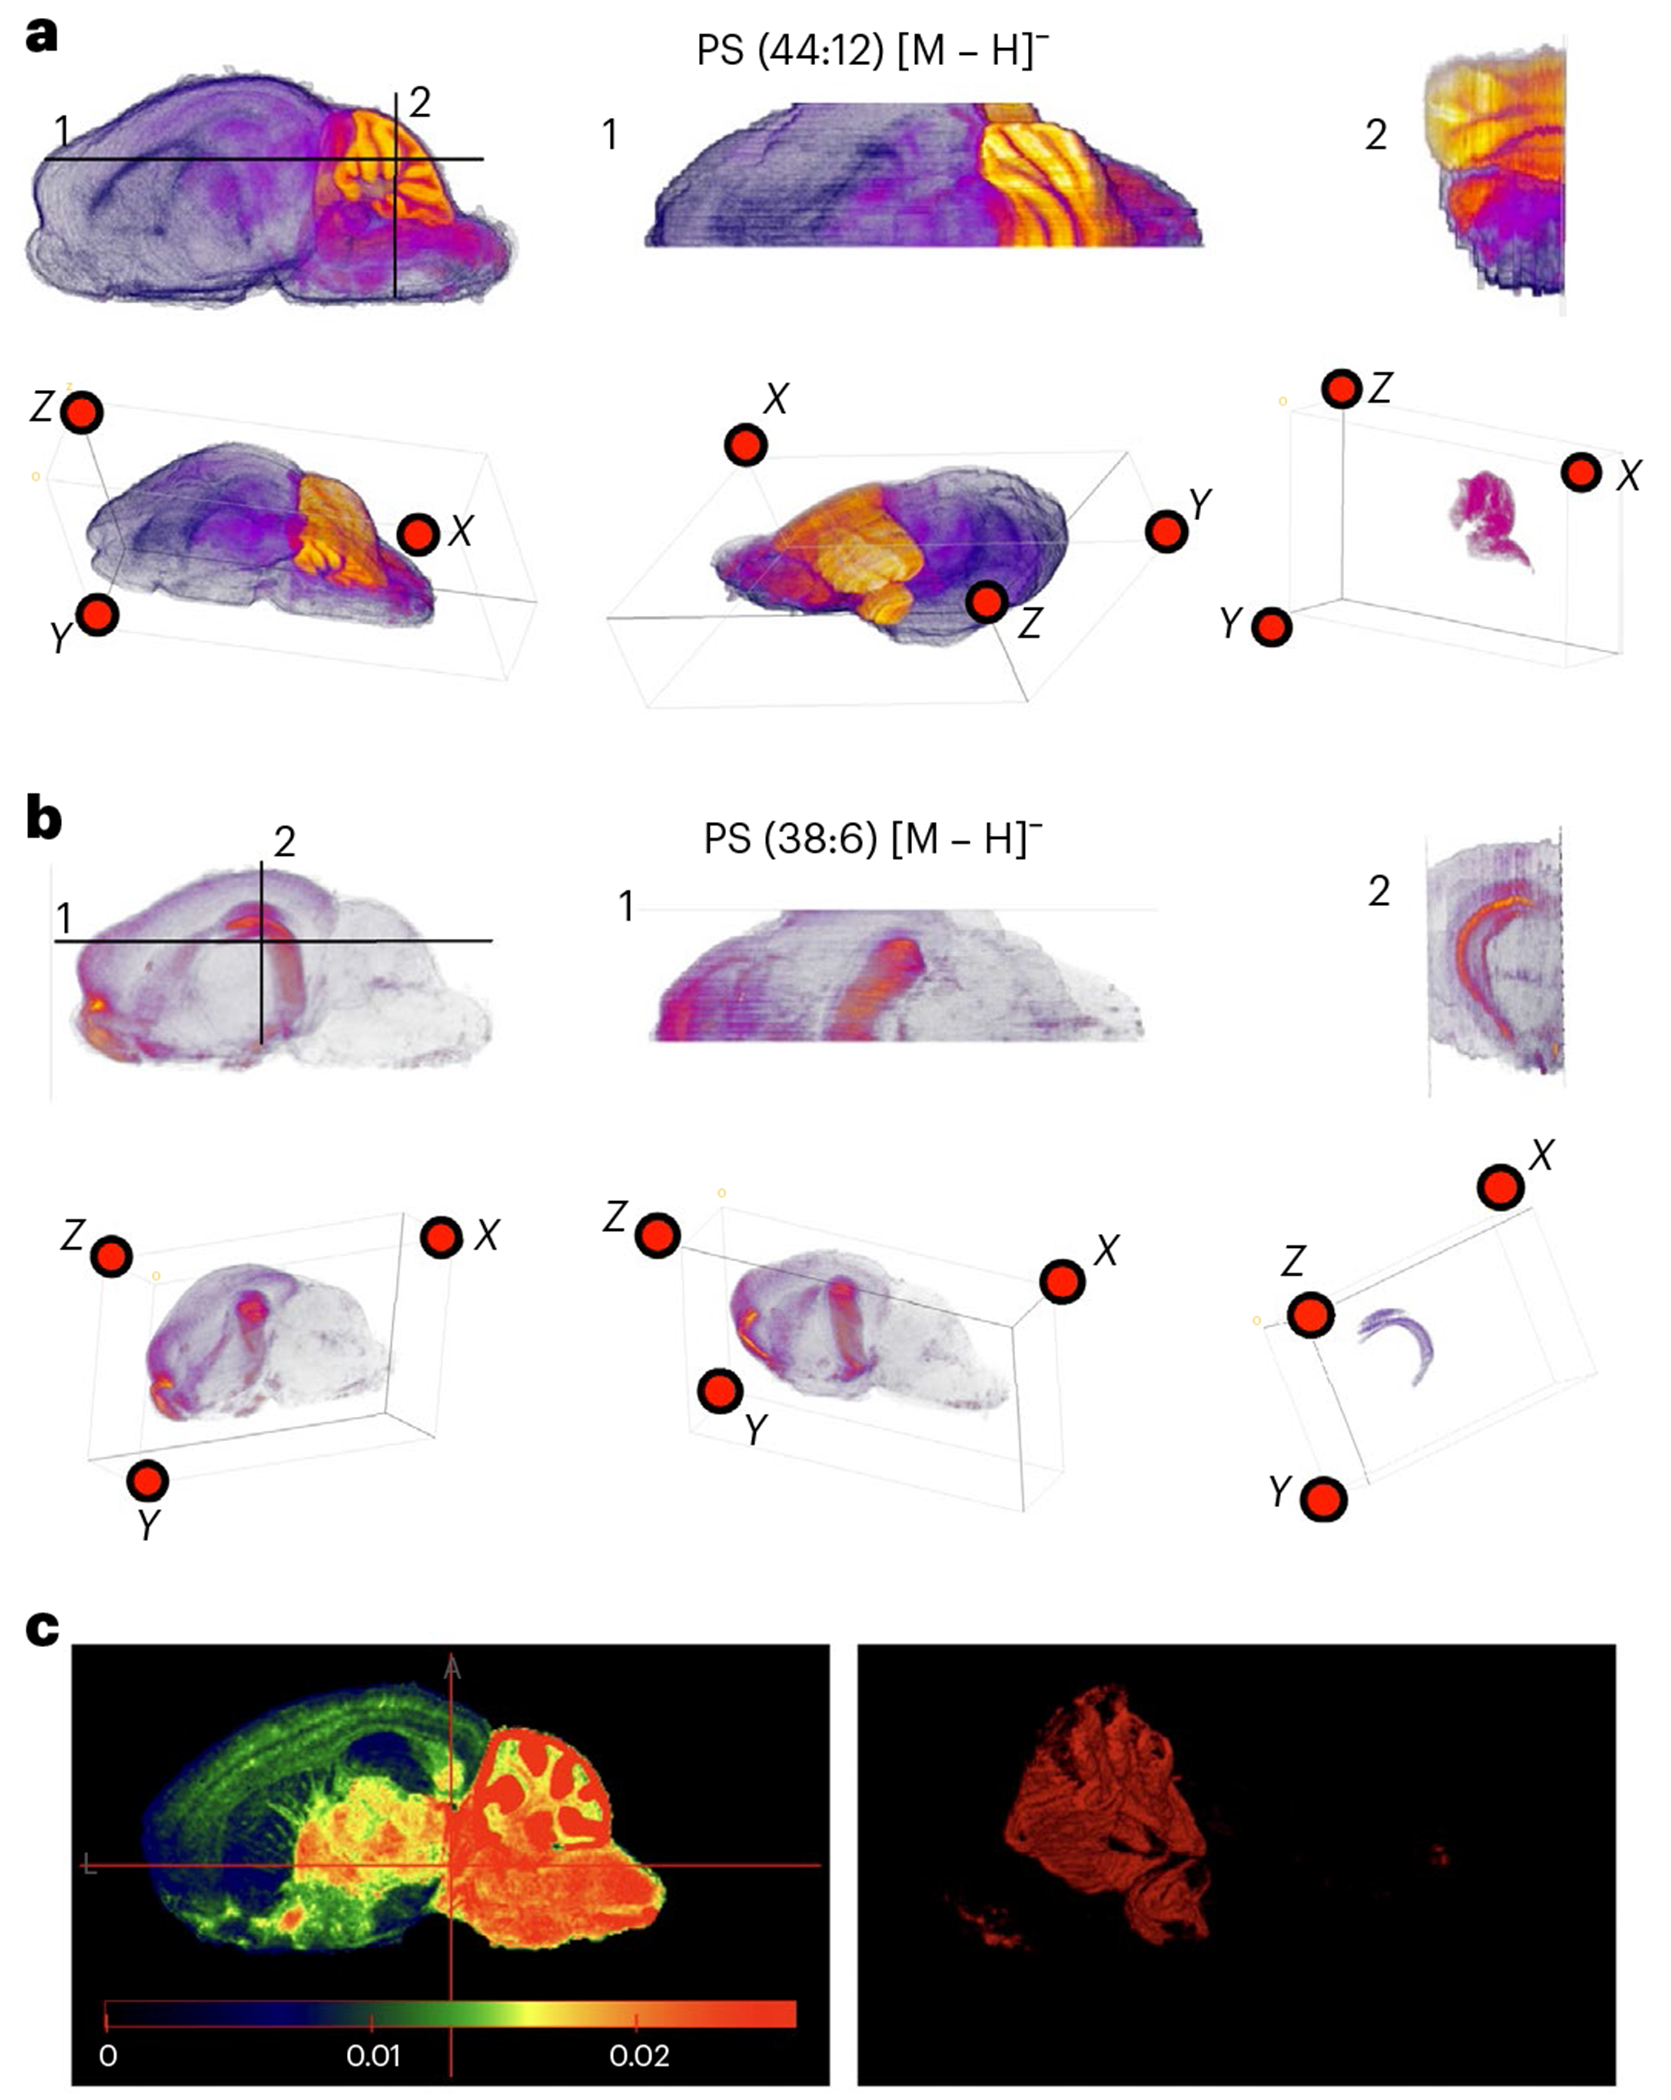
High-resolution spatial imaging is transforming our understanding of foundational biology. Spatial metabolomics is an emerging field that enables the dissection of the complex metabolic landscape and heterogeneity from a thin tissue section. Currently, spatial metabolism highlights the remarkable complexity in two-dimensional (2D) space and is poised to be extended into the three-dimensional (3D) world of biology. Here we introduce MetaVision3D, a pipeline driven by computer vision, a branch of artificial intelligence focusing on image workflow, for the transformation of serial 2D MALDI mass spectrometry imaging sections into a high-resolution 3D spatial metabolome. Our framework uses advanced algorithms for image registration, normalization and interpolation to enable the integration of serial 2D tissue sections, thereby generating a comprehensive 3D model of unique diverse metabolites across host tissues at submesoscale. As a proof of principle, MetaVision3D was utilized to generate the mouse brain 3D metabolome atlas of normal and diseased animals (available at https://metavision3d.rc.ufl.edu ) as an interactive online database and web server to further advance brain metabolism and related research.


Conflict of interest statement

Competing interests: R.C.S. has research support and received consultancy fees from Maze Therapeutics. R.C.S. is a member of the Medical Advisory Board for Little Warrior Foundation. M.S.G. received research support and research compounds from Maze Therapeutics, Valerion Therapeutics and Ionis Pharmaceuticals. M.S.G. also received a consultancy fee from Maze Therapeutics, PTC Therapeutics and the Glut1-Deficiency Syndrome Foundation. The other authors declare no competing interests.

Figures

Extended Data Fig. 1 |
Extended Data Fig. 1 |. 2D MALDI heatmap images of serial mouse brain sagittal sections.
a. Schematic of five serial sagittal cut brain sections from the medial plane (left). Heatmap images for the spatial distribution of the free fatty acid (FFA) 20:4 in 2D for all five serial brain sections tested for alignment. b. Schematic of serial sagittal cut brain sections from the medial to posterior brain with different section sizes (left). Heatmap images for the spatial distribution of the free fatty acid (FFA) 20:4 in 2D for all six serial brain sections with different sizes tested for alignment.
Extended Data Fig. 2 |
Extended Data Fig. 2 |. Normalization of serial brain sections for 3D construction using MetaNorm3D.
a. Representative intensity distribution of PIP 38:4 among all 79 serial sections of the mouse sagittal hemi-brain. b. Representative intensity distribution of PIP 38:4 after slide normalization (see method) among all 79 serial sections of the mouse sagittal hemi-brain.
Extended Data Fig. 3 |
Extended Data Fig. 3 |. 2D MALDI heatmap images of serial mouse brain sagittal sections before and after normalization.
a. Heatmap images for the spatial distribution of PIP 38:4 in 2D for all 79 serial brain sections for 3D construction before and after normalization. Insert sections represents tissue sections with disparities in total abundance are zoomed in below. b. Heatmap images for the spatial distribution of PI 36:4 in 2D for all 79 serial brain sections for 3D construction before and after normalization. Insert sections represents tissue sections with disparities in total abundance are zoomed in below.
Extended Data Fig. 4 |
Extended Data Fig. 4 |. MetaImpute3D to fill in imperfections during sample handling.
a. Heatmap images for the spatial distribution of PE 44:10 in 2D for all 79 serial brain sections for 3D after normalization, but before and after imputation of gaps in tissue. A representative tissue section after imputation is highlighted in the insert.
Extended Data Fig. 5 |
Extended Data Fig. 5 |. MetaInterp3D to fill in imperfections during sample handling.
a. Representatives heatmap images for the spatial distribution of PI 36:2 in 2D for all 79 real and 158 phantom serial brain sections for 3D construction. b. same as a, except phantom sections are highlighted in green. c. Statistical measures of alignment and fit quality measured by enhanced correlation coefficient (ECC), structural similarity index measure (SSIM), and mean squared error (MSE) after interpolation (316 section). The box-and-whisker plot in panel d shows the median (line), interquartile range (box), and variability (whiskers extending to the maximum and minimum data points) n = 857 (11 different lipid class across 79 brain section) before interpolation and n = 2571 (11 different lipid class across 237 brain section).
Extended Data Fig. 6 |
Extended Data Fig. 6 |. Additional examples of spatial metabolome atlas of by MetaVision3D.
a. Front cross section and top-down view of fine brain anatomical structures of mouse brain cerebellum and hippocampal region in manual fit and after MetaVision3D framework. b and c. MetaVision3D rendering of PI 38:5 and PS 40:6 in 3D space. Top down (transverse) and front cross section (coronal) views are designated as 1, 2 or 3 shown on the 2D side view image. 3D rendering is visualized by ImageJ using both projection mode and 3D fill of regions with high intensity of both features.
Extended Data Fig. 7 |
Extended Data Fig. 7 |. Reproducibility of 3D lipid distribution in independent WT mouse brains.
3D rendered views of two independent WT mouse brains (Brain 1 and Brain 2) showing the spatial distribution of three lipid species: PS 36:2, PI 38:5, and PS 40:6. The consistent patterns across the two brains demonstrate the reproducibility of lipid localization in the hippocampus and surrounding regions. 3D renderings are produced by MetaVision website.
Extended Data Fig. 8 |
Extended Data Fig. 8 |. 3D distribution of representative lipids highlighting anatomical regions in the mouse brain.
Representative images showing the spatial distribution of specific lipid species in mouse brain regions. (Left) Nissl-stained sagittal brain section of the same plane from the Allen Brain Atlas and Allen Reference Atlas, – Mouse Brain, Allen Mouse Brain Atlas, mouse.brain-map.org and atlas.brain-map.org with regions of interest highlighted in red, including the isocortex, hindbrain, cerebellar molecular layer, hippocampal region, ventricular system, and cerebral nuclei. (Middle) Sagittal plane images obtained using 2D MALDI imaging from our study, illustrating the relative abundance and localization of the indicated lipid species. (Right) 3D visualization of lipid distributions, highlighting the top 1% highest intensity pixels to resolve their spatial organization. Lipid species are annotated above each row: PE 38:6 [M-H], PE 36:2 [M-H], PS 44:12 [M-H], PE 38:4 [M-H], PI 40:4 [M-H], and LPE 20:4 [M-H]. Intensity scales range from minimum (purple) to maximum (yellow/red) as depicted in the bottom scale bar.
Extended Data Fig. 9 |
Extended Data Fig. 9 |. Comparative analysis of lipid and metabolite distribution in WT, 5xFAD, and Gaa−/− mouse brains.
2D slice and 3D rendered views showing the distribution of specific lipids (LPE 22:4, PE 38:5, LPE 20:0, PE 38:4) and metabolites (ADP) across different mouse models: WT, 5xFAD (Alzheimer’s disease model), and Gaa−/−. The left panel compares WT and 5xFAD brains, while the right panel compares WT and Gaa−/− brains. The color scales indicate the relative intensity of the lipid/metabolite signals, illustrating differences in spatial distribution between the genotypes. These comparisons highlight alterations in brain metabolism and lipid composition associated with Alzheimer’s disease and GAA deficiency.
Extended Data Fig. 10 |
Extended Data Fig. 10 |. Pathway enrichment analysis of neuronal layers of the cerebellum in WT and 5xFAD mouse brains.
a. 2D slice and 3D rendered views of WT and 5xFAD mouse brains displaying the distribution of phosphatidylinositol (PI) 38:5 in the hippocampus and cerebellum. b. The excitatory neuronal bodies of the cerebellum from a Nissl-stained sagittal brain section from the Allen Brain Atlas and Allen Reference Atlas, – Mouse Brain, Allen Mouse Brain Atlas, mouse.brain-map.org and atlas.brain-map.org (left) and pixels corresponding to these regions were extracted (right) for targeted analysis. c. Pathway enrichment analysis was performed on metabolomics (left) and lipidomics (right) datasets extracted from these pixels. Metabolomics pathway enrichment was conducted using MetaboAnalyst using the hypergeometric test and adjusted for multiple comparison (bonferroni correction) highlighting key pathways such as the transfer of acetyl groups into mitochondria, the Warburg effect, and the citric acid cycle based on −log10(pvalue). Lipid ontology enrichment using the one-sided Kolmogorov-Smirnov test and adjusted for multiple comparison (bonferroni correction) was performed using Lipid Ontology (LION) pathway analysis, identifying significant lipid categories related to bilayer thickness and lateral diffusion properties based on −log10(pvalue).
Fig. 1 |
Fig. 1 |. MetaVision3D, a computer vision pipeline for the generation of spatial metabolism in 3D.
Computational framework for MetaVision3D for the generation of spatial metabolome of mouse hemibrain in 3D. MetaVision3D uses an automated alignment framework through computer vision and normalization steps to account for intraslice signal variabilities and then performs imputation and interpolation algorithms to improve overall 3D rendering visualization. Created with BioRender.com.
Fig. 2 |
Fig. 2 |. MetaAlign3D for the automated alignment of serial MALDI imaging tissue sections.
a, Schematics of the computation workflow for the automated alignment of sequential MALDI imaging tissue powered by MetaAlign3D. Created with BioRender.com. b, MetaAlign3D versus manual fit for five serial sagittal sections cut from the medial side of a mouse hemibrain. Created with BioRender.com. c, MetaAlign3D versus manual fit for six sagittal sections cut from the medial side to lateral side of a mouse hemibrain with major shift in tissue size. Created with BioRender.com. d, Statistical measures of alignment and fit quality between manual fit and MetaAlign3D, ECC, SSIM and MSE. The box-and-whisker plot shows the median (line), interquartile range (box) and variability (whiskers extending to the maximum and minimum data points) for 11 different lipid classes across n = 79 brain sections. e, Schematics of the experimental workflow MALDI imaging of mouse hemibrain at 50 μm resolution. A total of 79 sections were acquired. Created with BioRender.com. f, MetaAlign3D versus manual fit for the 79 serial sagittal sections cut from a mouse hemibrain for the creation of spatial metabolome atlas in 3D. Schematics created with BioRender.com.
Fig. 3 |
Fig. 3 |. MetaImpute3D and MetaInterp3D to fill in imperfections during sample handling.
a, Schematics of MetaImpute3D by leveraging anterior and posterior serial sections to fill in gaps in tissue from experimental imperfections. This is done through two steps: imputation of the missing regions, followed by masking to fill in any residue gaps. b, Schematics of MetaInterp3D by leveraging anterior and posterior serial sections to create phantom tissue sections to improve z-axis resolution. Schematics created with BioRender.com. c, Heatmap images for the spatial distribution of PE 36:2 [M – H] in 2D for four serial brain sections from medial and posterior brain regions.
Fig. 4 |
Fig. 4 |. Generation of the spatial metabolome atlas by MetaVision3D.
a, MetaVision3D rendering of PS 44:12 [M – H] in 3D space. Top-down and frontal cross-sectional views are designated as 1 and 2 shown on the 2D side-view image. The 3D rendering is visualized by ImageJ using both projection mode and 3D fill of regions with high intensity of PS 44:12 [M – H] in the cerebellum (Methods). b, MetaVision3D rendering of PS 38:6 [M – H] in 3D space. Top-down and frontal cross-sectional views are designated as 1 and 2 shown on the 2D side-view image. The 3D rendering is visualized by ImageJ using both projection mode and 3D fill of regions with high intensity of PS 38:6 [M – H] in the cerebellum (Methods). c, Screenshot of https://devmetavision3d.rc.ufl.edu/ and its functionalities.
Fig. 5 |
Fig. 5 |. Anatomical structures and visualization of metabolite distributions in the mouse brain in 3D.
a, Gross anatomical regions of the mouse brain from the Allen Brain Atlas. b, Nissl-stained sagittal brain section from the Allen Brain Atlas and Allen Reference Atlas – Mouse Brain, highlighting fibrous tracks in red. c, Two-dimensional MALDI imaging of LPE 20:1 [M – H], showing a spatial distribution closely corresponding to the fibrous tracks. d, Three-dimensional rendering of LPE 20:1 [M – H], demonstrating the volumetric organization of the fibrous tracks. e, A Nissl-stained sagittal brain section highlighting the hippocampal formation and cerebellar cortex in red. f, Two-dimensional MALDI imaging of PI 38:5 [M – H], which mirrors the spatial distribution of the hippocampal formation and cerebellar cortex. g, A zoomed-in image of the cerebellar (Cere) granular layer and hippocampal (Hippo) granular layer, revealing elevated levels of PI 38:5 [M – H] in these distinct cellular layers (indicated by arrows) compared with the Nissl-stained brain section from the Allen Brain Atlas. h, Three-dimensional volumetric visualization of the cerebellar granular layer and hippocampal granular layer as defined by PI 38:5 [M – H]. Intensity scales for 2D images range from minimum (purple) to maximum (yellow/red), as indicated in the colour bar below c. Allen Mouse Brain Atlas, mouse.brain-map.org and atlas.brain-map.org.
Fig. 6 |
Fig. 6 |. Pathway enrichment analysis of neuronal layers of the hippocampus in WT and 5xFAD mouse brains.
a, Two-dimensional slice and 3D rendered views of WT and 5xFAD mouse brains displaying the distribution of PI 38:5 in the hippocampus. A, anterior; L, lateral. b, Left: excitatory neuronal bodies of the hippocampus from a Nissl-stained sagittal brain section from the Allen Brain Atlas and Allen Reference Atlas – Mouse Brain. Allen Mouse Brain Atlas, mouse.brain-map.org and atlas.brain-map.org. Right: pixels corresponding to these regions were extracted for targeted analysis. c, Pathway enrichment analysis was performed on metabolomics (left) and lipidomics (right) datasets extracted from these pixels. Metabolomics pathway enrichment was conducted using MetaboAnalyst using the hypergeometric test and adjusted for multiple comparison (Bonferroni correction), highlighting key pathways such as the Warburg effect and aspartate metabolism based on −log10(P value). LION enrichment using the one-sided Kolmogorov–Smirnov test and adjusted for multiple comparison (Bonferroni correction) was performed using LION pathway analysis, identifying significant lipid categories, including diacylglycerophosphoglycerols and low-transition-temperature lipids based on −log10(P value).

References

    1. Moses L & Pachter L Museum of spatial transcriptomics. Nat. Methods 19, 534–546 (2022). - PubMed
    1. Rao A, Barkley D, França GS & Yanai I Exploring tissue architecture using spatial transcriptomics. Nature 596, 211–220 (2021). - PMC - PubMed
    1. Bendall SC et al. Single-cell mass cytometry of differential immune and drug responses across a human hematopoietic continuum. Science 332, 687–696 (2011). - PMC - PubMed
    1. Angelo M. et al. Multiplexed ion beam imaging of human breast tumors. Nat. Med 20, 436–442 (2014). - PMC - PubMed
    1. Rappez L. et al. SpaceM reveals metabolic states of single cells. Nat. Methods 18, 799–805 (2021). - PMC - PubMed

LinkOut - more resources