. 2025 Mar 18;30(1):32.
doi: 10.1186/s11658-025-00715-9.

AFM reveals differential effects of acidification on LDL- and oxidized LDL-receptor interactions: biomechanical implications in atherogenesis

Affiliations

AFM reveals differential effects of acidification on LDL- and oxidized LDL-receptor interactions: biomechanical implications in atherogenesis

Kun Wang et al. Cell Mol Biol Lett. .

Abstract

The receptor recognition and interaction of plasma lipoproteins (e.g., native low-density lipoproteins (LDL)/oxidized low-density lipoproteins (oxLDL), as well as the influence of microenvironmental/lysosomal acidification, play critical roles in lipoprotein metabolism and diseases (e.g., atherosclerosis) but have been less investigated. Here, the recognition/interaction of LDL or oxLDL with LDL receptor (LDLR) or CD36 (a scavenger receptor) or with living cells at various pHs was evaluated mainly via atomic force microscopy (AFM). To improve force measurement accuracy, a novel, micro-droplet-based method for AFM probe functionalization was developed. We found that solution acidification significantly reduced the LDL-LDLR binding at pH ≤ 6.4, whereas the oxLDL-CD36 binding had no significant change until pH ≤ 4.4. Compared with a traditional immersion method, our micro-droplet method for AFM probe functionalization produced more accurate interaction forces, and revealed that acidification significantly reduced the LDL-LDLR/cell interaction forces, instead of the oxLDL-CD36/cell-specific interaction forces and nonspecific interaction forces. The data imply that the LDL-LDLR/cell recognition and interaction are susceptible to acidification, whereas the oxLDL-CD36/cell recognition and interaction are tolerant of acidification. The results may provide important novel information and biomechanical/pathological implications for understanding lipoprotein metabolism and atherosclerosis.

Keywords: Atherosclerosis; Atomic force microscopy (AFM); Low-density lipoprotein (LDL).


Conflict of interest statement

Declarations. Ethics approval and consent to participate: Not applicable. Consent for publication: All authors approved the publication. Competing interests: The authors declare no competing interests.

Figures

Fig. 1
Fig. 1
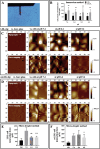
AFM topographical observation of the recognition of native or oxidized LDL by receptors (LDLR or CD36) pre-immobilized on micas. A LDLR only. B Native LDL particles only. CF Binding of native LDL particles to LDLRs at pH 7.4, pH 6.4, pH 5.4, and pH 4.4, respectively. AF Top panels: AFM topographical images; bottom panels: Schematic diagrams presenting the binding of LDL particles (brown) onto LDLR molecules (purple) pre-immobilized on mica (gray). AFM imaging was performed in PBS buffer at different pH values. G Quantitative analysis of the LDL–LDLR binding ratio at different pH values. H Quantitative analysis of the oxLDL–CD36 binding ratio at different pH values (the representative AFM topographical images are not shown). The control group (Ctrl) means the group incubating of LDL/oxLDL on a mica surface coated without receptors to exclude the possibility of nonspecific interaction. *p < 0.05, **p < 0.01, and ***p < 0.001 compared with pH 7.4; #p < 0.05 compared with pH 6.4 (n ≥ 3 images in each group)
Fig. 2
Fig. 2
Immuno-TEM observation of the recognition of native or oxidized LDL pre-immobilized on micas by gold-nanoparticle-conjugated receptors (LDLR or CD36). A Gold nanoparticle (5 nm)-conjugated LDLR only. B Native LDL particles only. CF Binding of gold-nanoparticle-conjugated LDLRs to native LDL particles at pH 7.4, pH 6.4, pH 5.4, and pH 4.4, respectively. AF Top panels: TEM images; bottom panels: schematic diagrams presenting the binding of gold nanoparticle (red)-conjugated LDLR molecules (purple) onto a LDL particle (brown) layer pre-immobilized on copper grid (gray). LDL–LDLR interaction was conducted in PBS buffer at different pH values, whereas TEM imaging was performed in a vacuum. G Quantitative analysis of the LDL–LDLR binding ratio at different pH values. H Quantitative analysis of the oxLDL–CD36 binding ratio at different pH values (the representative TEM images of oxLDL–CD36 recognition are not shown). The control group (Ctrl) means the group incubating of gold nanoparticles (but no LDLR) with LDL/oxLDL on micas to exclude the possibility of nonspecific interaction. The number of gold nanoparticles (black dots) in each image was counted for calculation of the binding ratio (to the data at pH 7.4). ***p < 0.001 compared with pH 7.4 (n ≥ 3 images in each group)
Fig. 3
Fig. 3
Traditional immersion methods and our novel micro-droplet method for AFM probe functionalization. A The schematic diagram comparing AFM probe functionalization between traditional immersion methods (a, b) and our micro-droplet method (c). From top to bottom: the main steps of each method. The process of probe functionalization is controlled by operator’s hands and a stepping motor, respectively, in traditional immersion methods and our micro-droplet method. B Observation of micro-droplets on a mica under an AFM cantilever/probe (even the smallest micro-droplets of up to several microns in diameter can be selected for probe functionalization)
Fig. 4
Fig. 4
Comparison of the effects of two AFM probe functionalization methods, a traditional immersion method and our micro-droplet method, on force spectroscopic measurements. A Representative force spectroscopy of nonspecific interactions (force–distance curves) between bare micas and low-density lipoprotein receptors (LDLRs) functionalized on AFM probes via the immersion method (left panels) and our micro-droplet method (right panels), respectively. From top to bottom: the probes were functionalized with nothing, PEG, and PEG + LDLR, respectively. B Quantitative analysis of the average nonspecific interaction force. C Representative force spectroscopy of specific interactions between LDL particles deposited on mica and LDLRs functionalized on AFM probes via immersion method (left panels) and micro-droplet method (right panels), respectively. The red arrows on the force–distance curves show the number of interactions. D Quantitative analyses of the average peak number (left panel) and average force (right panel) of specific LDL–LDLR interaction. In the schematic diagrams alongside representative force–distance curves, PEG, LDLR, and LDL are displayed as a blue curly line, red dot, and blue dot, respectively (more PEG and LDLR are shown in the left panels than in the right panels). AFM force spectroscopy were performed in PBS buffer at pH 7.4. In B and D, n = 200 interactions in each group from three independent experiments. *p < 0.05 and **p < 0.01 compared our micro-droplet method with the immersion method
Fig. 5
Fig. 5
AFM force spectroscopy of specific interactions of LDL or oxLDL with LDL receptor (LDLR) or CD36 (a type of scavenger receptors) under various acidic conditions. A Specific interactions between LDL/oxLDL and LDLR. B Specific interactions between LDL/oxLDL and CD36. (n = 200 interactions in each group from three independent experiments; *p < 0.05 and **p < 0.01 compared oxLDL with LDL; #p < 0.05 and ##p < 0.01 compared with the pH 7.4 groups). All AFM force spectroscopic experiments were performed in PBS buffer at different pH values
Fig. 6
Fig. 6
Force spectroscopy of the interactions between LDL/oxLDL particles functionalized on AFM probe tips and cell surfaces of endothelial cells under various acidic conditions. A Optical observation of endothelial cells under an AFM cantilever. B Statistical analysis of the interaction forces between LDL or oxLDL particles modified on AFM tips via the immersion method and cell surfaces under different acidic conditions. **p < 0.01 compared oxLDL with LDL; #p < 0.05 compared with pH 7.4 (n = 300 interactions in each group from three independent experiments). C The dynamic changes in topographical (top panels) and force (bottom panels) mapping of the same cells but under different acidic conditions (from left to right: pH 7.4, 6.4, and 5.4, respectively) detected by LDL-modified AFM tips via the micro-droplet method, respectively. D Topographical (top panels) and force (bottom panels) mapping of cells under different acidic conditions (from left to right: pH 7.4, 6.4, and 5.4, respectively) detected by oxLDL-modified AFM tips via the micro-droplet method, respectively. E, F Statistical analysis of the interaction forces between LDL (E) or oxLDL (F) particles modified on tips via the micro-droplet method and cell surfaces under different acidic conditions. The control groups represent the interactions between LDL/oxLDL-modified tips via the micro-droplet method and bare glass (i.e., the substrate of a petri dish for cell culture) at pH 7.4. *p < 0.05 and **p < 0.05 compared with pH 7.4 (n = 300 interactions in each group from three independent experiments). All AFM force spectroscopic experiments were performed in PBS buffer at different pH values
Fig. 7
Fig. 7
AFM topographical observation of the recognition of native LDL by the LDL receptor (LDLR) at pH 7.4, one of which was pretreated at different pHs. A LDL particles were treated at different pHs (from left to right: pH 7.4, pH 6.4, and pH 4.4, respectively; the rightmost panel: the statistical quantification of LDL–LDLR binding ratio) prior to AFM detection of LDL–LDLR interaction at pH 7.4. B LDL receptors (LDLRs) were treated at different pHs (from left to right: pH 7.4, pH 6.4, and pH 4.4, respectively; the rightmost panel: the quantification of LDL–LDLR binding ratio) prior to AFM detection of LDL–LDLR interaction at pH 7.4. **p < 0.01, ***p < 0.001, and ****p < 0.0001 (n ≥ 5 images in each group)
Fig. 8
Fig. 8
Average interaction forces (or unbinding forces) between various intermolecular interactions in literature and in the present study. The intermolecular interactions were artificially divided into six subclasses. The LDL–LDLR, oxLDL–CD36, LDL-HUVEC, and oxLDL-HUVEC interactions detected in the present study are also added into the ligand–receptor and protein–cell interaction subclasses, respectively, and were highlighted with the asterisks. EV71, enterovirus 71; A. anophagefferens, Aureococcus anophagefferens; HSA, human serum albumin; mAb, monoclonal antibody; pAb, polyclonal antibody; EGFR, epidermal growth factor receptor; EGF, epidermal growth factor; HA, hemagglutinin; E1-BSA, estrone–bovine serum albumin; Sendai-PM, Sendai–purple membrane; pIII, gene III protein; HBsAg, hepatitis B surface antigen; PEG, polyethylene glycol; LPS, lipopolysaccharides; PGN, peptidoglycan; ICAM-1, intercellular adhesion molecules-1; ICAM-2, intercellular adhesion molecules-2; LFA-1, leukocyte function-associated antigen-1; RCA, ricinus communis; VAA, viscum album; IgG, immunoglobulin G; BHL, bovine heart; SP-D, surfactant protein D; RBD, receptor-binding domain; ACE2, angiotensin-converting enzyme 2; NRP1, neuropilin-1; WNV, West Nile virus; PS, phosphatidylserine; PE, phosphatidylethanolamine; PC, phosphatidylcholine; EBOV, Ebola virus; VLP, virus-like particle; VSV, vesicular stomatitis virus; POPC, 1-palmitoylv-2-oleoyl-sn-glycero-3-phosphocholine; HUVEC, human umbilical vein endothelial cell; PMN, polymorphonuclear leukocyte; CHO, Chinese hamster ovary cell; RCA120, Ricinus communis agglutinin-120; VECs, vascular endothelial cells
Fig. 9
Fig. 9
Schematic diagram presenting the biomechanical/physiological/pathological implications of our findings. Differential influences of microenvironmental/lysosomal solution acidification on receptor binding/recognition and interaction force of different LDL forms (e.g., native and oxidized LDLs) induce their different fates and atherosclerosis

Similar articles

References

    1. Hussain MM. Intestinal lipid absorption and lipoprotein formation. Curr Opin Lipidol. 2014;25(3):200–6. - PMC - PubMed
    1. Barth JD, Arntzenius AC. Progression and regression of atherosclerosis, what roles for LDL-cholesterol and HDL-cholesterol—a perspective. Eur Heart J. 1991;12(8):952–7. - PubMed
    1. Qin SC. LDL and HDL Oxidative modification and atherosclerosis. In: Jiang XC, editor. Lipid transfer in lipoprotein metabolism and cardiovascular disease, vol. 1276. Singapore: Springer; 2020. p. 157–69. - PubMed
    1. Ao MY, Gan CY, Shao WX, Zhou X, Chen Y. Effects of cyclodextrins on the structure of LDL and its susceptibility to copper-induced oxidation. Eur J Pharm Sci. 2016;91:183–9. - PubMed
    1. Qiao YN, Zou YL, Guo SD. Low-density lipoprotein particles in atherosclerosis. Front Physiol. 2022;13:931931. - PMC - PubMed