. 2025 Mar 18;26(1):268.
doi: 10.1186/s12864-025-11385-4.

An mRNA expression atlas for the duck with public RNA-seq datasets

Affiliations

An mRNA expression atlas for the duck with public RNA-seq datasets

Qiuyu Tao et al. BMC Genomics. .

Abstract

Background: Ducks are globally important poultry species and a major source of farm animal products, including meat, eggs, and feathers. A thorough understanding of the functional genomic and transcriptomic sequences is crucial for improving production efficiency.

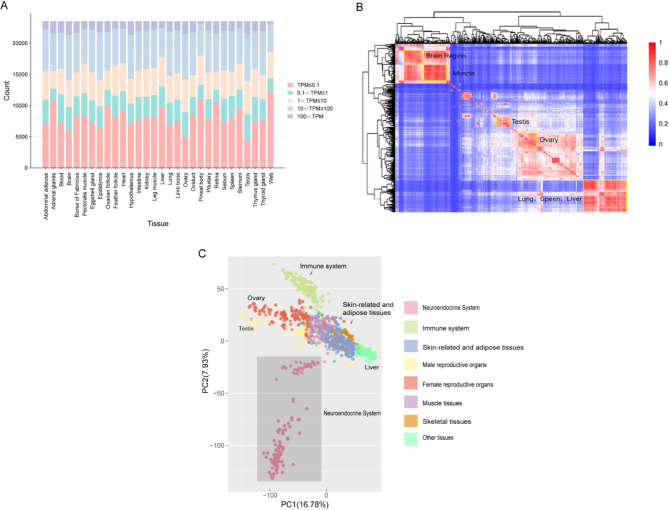
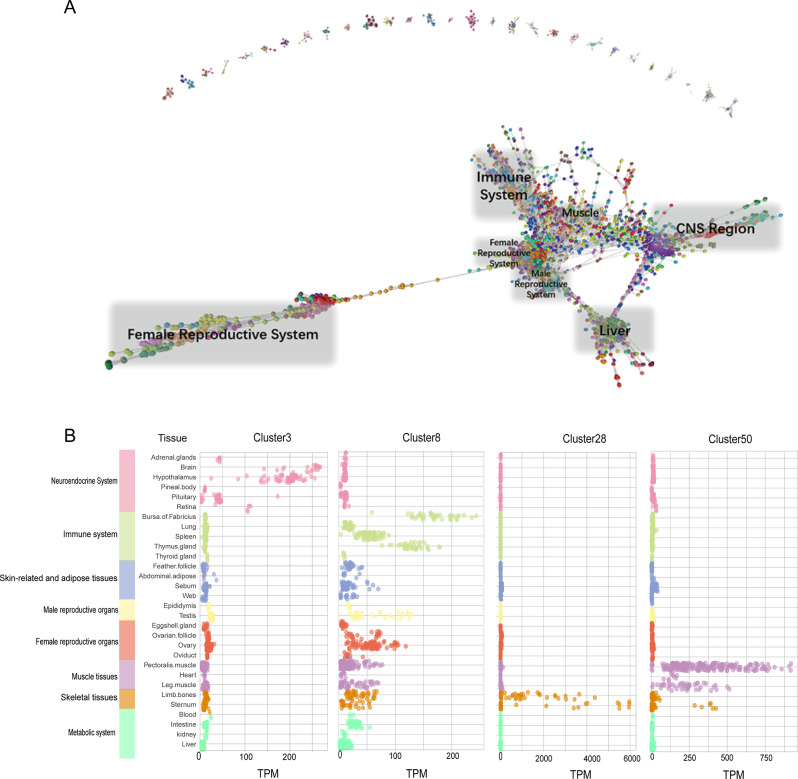
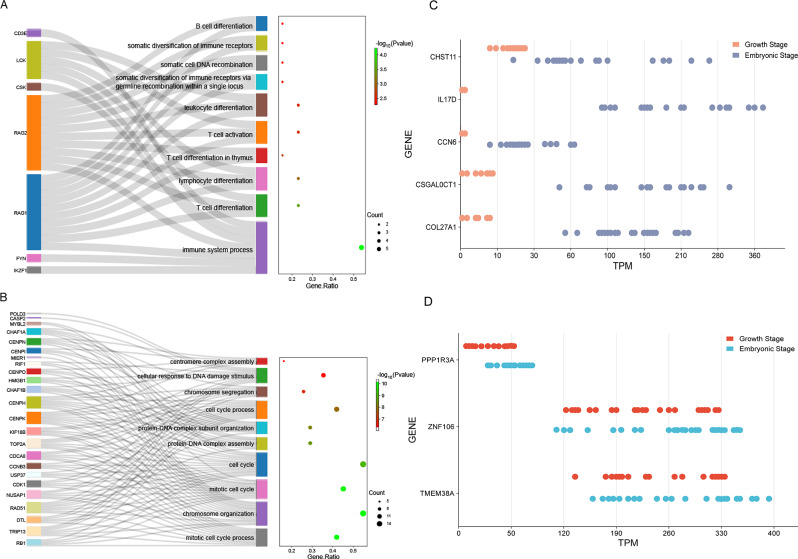
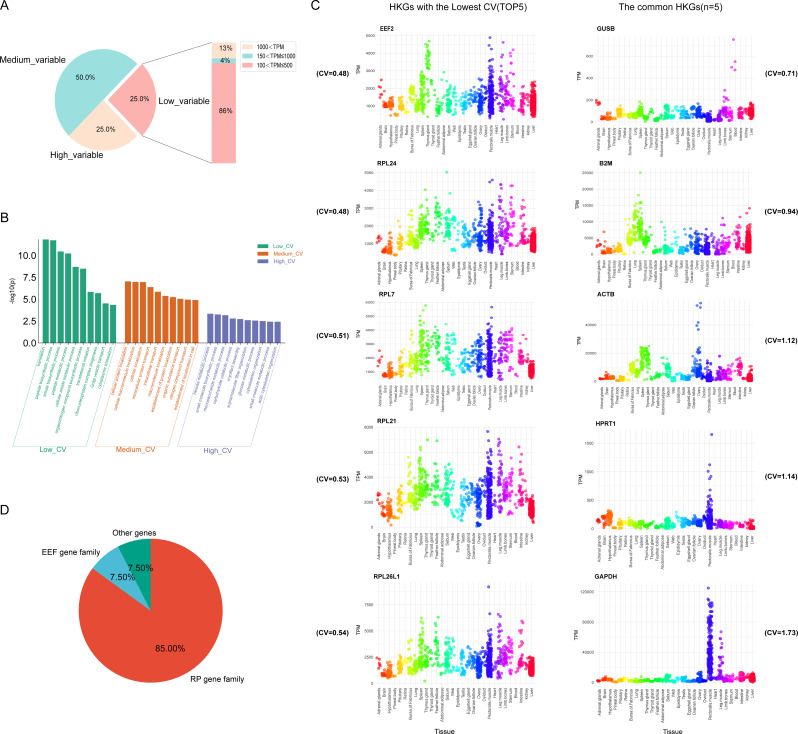
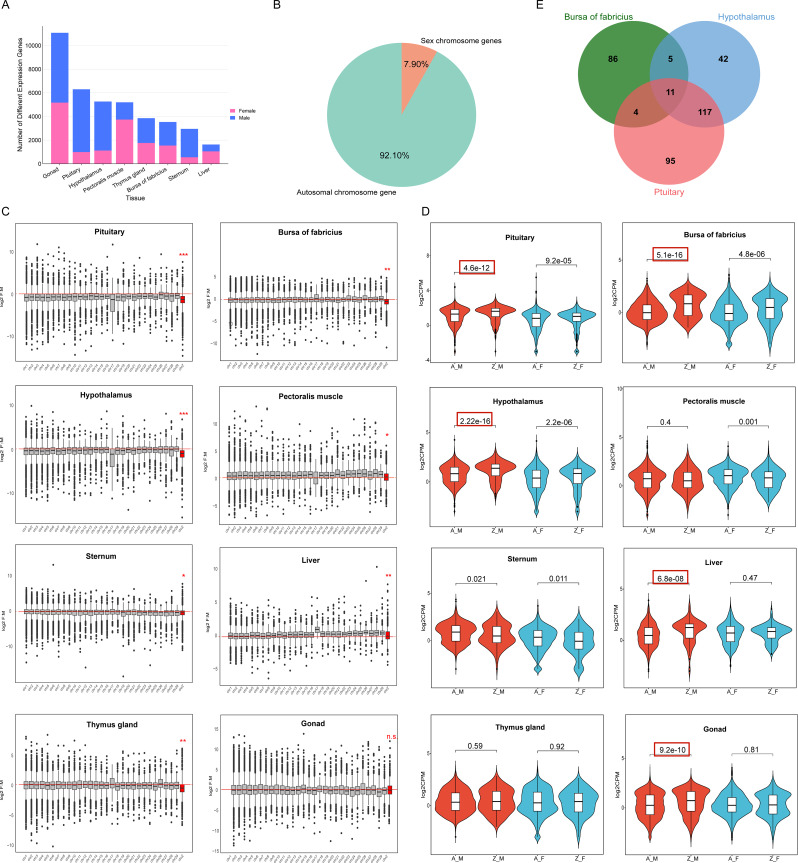
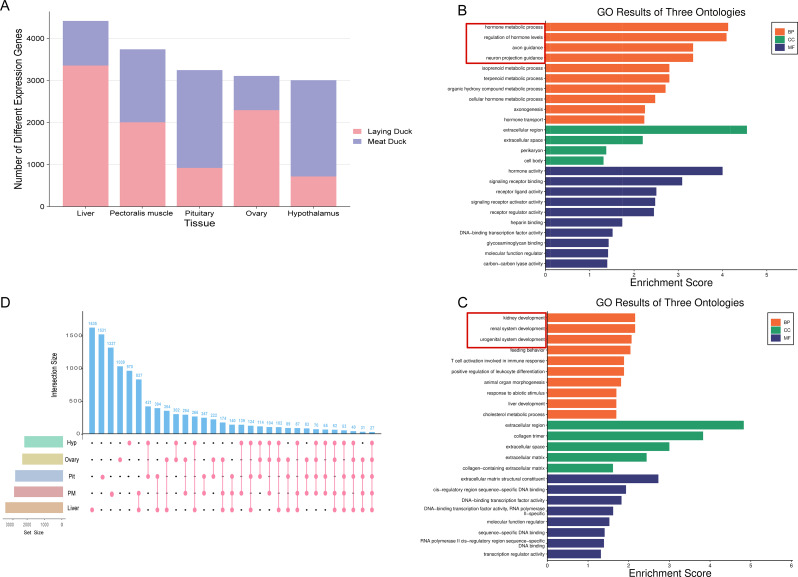
Result: This study constructed the largest duck mRNA expression atlas among all waterfowl species to date. The atlas encompasses 1,257 tissue samples across 30 tissue types, representing all major organ systems. Using advanced clustering analysis, we established co-expression network clusters to describe the transcriptional features in the duck mRNA expression atlas and, when feasible, assign these features to unique tissue types or pathways. Additionally, we identified 27 low-variance, highly expressed housekeeping genes suitable for gene expression experiments. Furthermore, in-depth analysis revealed potential sex-biased gene expression patterns within tissues and specific gene expression profiles in meat-type and egg-type ducks, providing valuable resources to understand the genetic basis of sex differences and particular phenotypes. This research elucidates the biological processes affecting duck productivity.

Conclusion: This study presents the most extensive gene expression atlas for any waterfowl species to date. These findings are of significant value for advancing duck biological research and industrial applications.

Keywords: Co-expression network; Differentially expressed genes; Duck; Expression atlas; Housekeeping genes; RNA-seq.


Conflict of interest statement

Declarations. Ethics approval and consent to participate: All methods were carried out following relevant guidelines and regulations. All duck work was conducted following a protocol approved by Sichuan Agricultural University China’s animal ethics and welfare committee (AEWC). Consent for publication: Not applicable. Competing interests: The authors declare no competing interests.

Figures

Fig. 1
Fig. 1
Gene expression profile among 30 tissue types. (A) Statistical distribution chart of gene TPM values across different tissue samples. (B) Unbiased hierarchical clustering heat map based on Pearsons’s correlation coefficient for all genes. Color intensity indicates the correlation between tissues, red indicates a high correlation (1), and blue indicates a low correlation (0.5). (C) The principal component analysis (PCA) plot shows the relation and clustering of all duck tissue samples. (CNS = central nervous system)
Fig. 2
Fig. 2
Interrogation of the underlying expression profiles allows regions of the graph (r = 0.75, MCL = 2.0) to be associated with specific tissues or tissue types. (A) A three-dimensional visualization of a Pearson correlation gene-to-gene graph of expression levels derived from RNA-Seq data from analysis of all duck tissues. (B) It shows scatter plots of gene expression profiles in the selected cluster (Cluster 3, 8, 28, and 50)
Fig. 3
Fig. 3
Functional annotation and details of selected cluster genes. GO term analysis of (A) cluster 11, 16, 22 and (B) cluster 8, 34 (Sankey diagram: The nodes on the left represent individual genes; The nodes on the right represent enriched biological pathways; The width of the links between genes and processes indicates the contribution of the gene to a particular biological pathways). Genes enriched in (C) cluster 28 and (D) cluster 50 are more expressed in the embryonic stage than in the growth stage
Fig. 4
Fig. 4
The expression pattern and hierarchical clustering of 1088 HKGs across 30 duck tissues. (A) The HKGs are variably expressed, and only 25% are constantly expressed. Among those constant HK genes, only 13% are highly expressed with TPM larger than 100. (B) GO Enrichment Analysis of Housekeeping Genes with High, medium, and low CV (Top 10). (C) Expression of the Top 5 HKGs with the Lowest CV and 5 Common HKGs of Variation Across Various Tissues (CV = Coefficients of Variation). (D) Proportion of genes in 27 HKGs
Fig. 5
Fig. 5
Expression patterns of sex-biased genes in ducks. (A) The distribution of sex-specific genes in the eight tissues (female-biased genes in red; Blue for the male-bias genes) (B) The location of the distribution ratio of differentially expressed genes (green as autosomal gene number proportion; Orange is the ratio of sex chromosome genes) (C) Fold-change map (***indicates P ≤ 0.001; **indicates 0.001 < P ≤ 0.01; *indicates 0.01 < P ≤ 0.05; n.s. indicates P > 0.05) and (D) zither map of the duck Z chromosome for pituitary, hypothalamus, sternum, thymus gland, bursa of Fabricius, pectoralis muscle, liver and gonads. (E) Venn diagram of Z chromosome of dose-effect genes in the bursa of Fabricius, pituitary, and hypothalamus
Fig. 6
Fig. 6
Differentially expressed genes between egg-type and meat-type ducks. (A) The number of differentially expressed genes in the five tissues (red indicates genes highly expressed in laying ducks, blue indicates genes highly expressed in meat ducks). KEGG enrichment plot of highly expressed genes (B) in egg-type ducks and (C) in meat-type ducks. (D) Venn diagram shows the shared and unique differentially expressed genes among the hypothalamus, ovary, pituitary, pectoralis muscle, and liver tissues between meat and laying ducks. (Hyp = hypothalamus, Pit = pituitary, PM = pectoralis muscle)

Similar articles

References

    1. Li J. Analysis of the evolution of sex chromosomes in Pekin Duck and monotremes. Zhejiang University; 2020.
    1. Zhu F, Yin Z-T, Wang Z, Smith J, Zhang F, Martin F, Ogeh D, Hincke M, Lin F-B, Burt DW. Three chromosome-level Duck genome assemblies provide insights into genomic variation during domestication. Nat Commun. 2021;12(1):5932. - PMC - PubMed
    1. Cunningham F, Allen JE, Allen J, Alvarez-Jarreta J, Amode MR, Armean IM, Austine-Orimoloye O, Azov AG, Barnes I, Bennett R. Ensembl 2022. Nucleic Acids Res. 2022;50(D1):D988–95. - PMC - PubMed
    1. Wickramasinghe S, Cánovas A, Rincón G, Medrano JF. RNA-sequencing: a tool to explore new frontiers in animal genetics. Livest Sci. 2014;166:206–16.
    1. Freeman TC, Ivens A, Baillie JK, Beraldi D, Barnett MW, Dorward D, Downing A, Fairbairn L, Kapetanovic R, Raza S, et al. A gene expression atlas of the domestic pig. BMC Biol. 2012;10:90. - PMC - PubMed

LinkOut - more resources