. 2025 Mar 18;23(1):217.
doi: 10.1186/s12951-025-03310-4.

Blocking copper transporter protein-dependent drug efflux with albumin-encapsulated Pt(IV) for synergistically enhanced chemo-immunotherapy

Affiliations

Blocking copper transporter protein-dependent drug efflux with albumin-encapsulated Pt(IV) for synergistically enhanced chemo-immunotherapy

Man Fang et al. J Nanobiotechnology. .

Abstract

Non-small cell lung cancer (NSCLC) represents the most prevalent form of lung cancer, exerting a substantial impact on global health. Cisplatin-based chemotherapy is the standard treatment for NSCLC, but resistance and severe side effects present significant clinical challenges. Recently, novel tetravalent platinum compounds have attracted significant interest. While numerous studies concentrate on their functional modifications and targeted delivery, tumor-induced platinum resistance is frequently overlooked. Previous tetravalent platinum compound demonstrated antitumor activity, yet proved ineffective against cells exhibiting resistance to cisplatin. In order to enhance the efficacy and potential applications of tetravalent platinum in NSCLC, a glutathione (GSH)-responsive albumin nanoquadrivalent platinum (HSA@Pt) have been constructed. In light of previous research into drug conjugation, this study was to develop a combined chemo-immunotherapy approach. The HSA@Pt demonstrated high efficacy and low toxicity, with targeted tumor accumulation. Furthermore, Ammonium Tetrathiomolybdate (TM) has been demonstrated to exert a synergistic inhibitory effect on ATPase Copper Transporting Beta (ATP7B) and Programmed Death Ligand 1 (PD-L1), impede platinum efflux, induce cellular stress, and activate antitumor immunity. The findings suggest HSA@Pt's potential for clinical use and a novel chemo-immunotherapy strategy for NSCLC, enhancing the utility of established drugs through synergistic sensitization.

Keywords: Albumin; Ammonium Tetrathiomolybdate; NSCLC; Novel tetravalent platinum; Tumor chemo-immunotherapy.


Conflict of interest statement

Declarations. Ethics approval and consent to participate: All animal experiments were conducted in accordance with the guidelines of Hunan SJA Laboratory Institutional Animal Care and Use Committee (SJA2022128). Consent for publication: Consents for publication were obtained from all the authors of this study. Competing interests: The authors declare no competing interests.

Figures

Sch. 1
Sch. 1
Schematic illustration of HSA@Pt-based synergistic antitumor therapy via blocking platinum efflux and enhancing ER stress. (A) Chemical structure of Pt(IV), self-assembly of human serum albumin with Pt(IV) to form HSA@Pt. (B) Intravenously injected HSA@Pt preferred to accumulate and remain in tumor tissue through enhanced permeability and retention (EPR) effect. Stimulated by the tumor microenvironment, Pt(IV) released by HSA@Pt is reduced to divalent platinum by depleting GSH, causing DNA damage and inducing apoptosis. Concurrently, orally administered Ammonium Tetrathiomolybdate (TM) gains access to tumor cells via free diffusion, inhibits the expression of the copper transporter protein ATP7B as well as PD-L1, blocks platinum exocytosis, intensifies the cellular stress state, prompts the cells to release damage-associated molecular patterns, and further activates the antitumor immune response.
Fig. 1
Fig. 1
Preparation and characterization of HSA@Pt. (A) TEM images of HSA@Pt. Scalar bar: 100 nm. (B) Hydrodynamic diameters of HSA@Pt measured by DLS. (C) Cumulative release of Pt from HSA@Pt in the presence of 10 mM GSH or PBS at 37 ℃, respectively. (D) Flow cytometric profiles and (E) the corresponding quantification of intracellular uptake of HSA@Cy5.5 for 0 h, 1 h, 4 h and 7 h, respectively, in A549 cells. (F) CLAS images of A549 cells treated with Cy5.5-labeled HSA@Pt at 0 h, 1 h, 4 h and 7 h, respectively. Scalar bar: 50 μm. (G) The confocal images of Cy5.5-labeled HSA@Pt endocytosed by H1299 3D spheroids. Scalar bar: 100 μm. Cell nuclear is strained by DAPI with blue fluorescence. The red fluorescence and green fluorescence come from Cy5.5 and cell skeleton stained with Actin, respectively. n = 3. Data are presented as mean ± SD. Statistical significances between every two groups were calculated vivo one-way ANOVA with Tukey’s multiple comparisons test. *p < 0.05, ** p < 0.01, *** p < 0.001.
Fig. 2
Fig. 2
In vitro anticancer effects of HSA@Pt combined with TM. (A) Amount of accumulated Pt in A549 cells treated with PBS, TM, CisPt, Pt(IV) and HSA@Pt (10 µM Pt), or combination with TM (100 µM) for 24 h, respectively. (B) ROS generation in A549 cells after various treatments by flow cytometry (C) and the corresponding quantification of ROS generation. (D) Intracellular ROS generation in A549 cells after various treatments by CLSM. Scale bar: 100 μm. (E) Quantification of apoptotic ratio via FCM in A549 cells with various treatments. (F) Final colonies stained with crystal violet dye after different treatments for two weeks. (G) The 2D CLSM images of A549 cells stained with calcein-AM (green, viable) and PI (red, dead) after various treatments. Scale bar: 200 μm. n = 3. Data are presented as mean ± SD. Statistical significances between every two groups were calculated via one-way ANOVA with Tukey’s multiple comparisons test. *p < 0.05, ** p < 0.01, *** p < 0.001.
Fig. 3
Fig. 3
Blocked platinum efflux and enhanced ER stress by HSA@Pt combined with TM in vitro. (Aand B) Proteins expression levels of apoptosis-related proteins and PD-L1 in A549 cells after various treatments as mentioned above for 24 h by Western blot. Tubulin and β-actin were used as the internal reference protein. 1: PBS; 2: CisPt; 3: Pt(IV); 4: HSA@Pt; 5:TM; 6: CisPt+TM; 7: Pt(IV)+TM; 8: HSA@Pt+TM; (C) Representative CLSM images to show the ATP7B expression in A549 cells with various treatments. Scalar bar: 50 μm. (D) PD-L1 expression in A549 cells after various treatments by flow cytometry and (E) the corresponding quantification of PD-L1 expression. (F) Schematic illustration of possible mechanism of HSA@Pt combined with TM for antitumor activity. (G) Flow cytometry analysis and (H) quantitative study of DC maturation co-cultured with A549 cells with various treatments. n = 3. Data are presented as mean ± SD. Statistical significances between every two groups were calculated via one-way ANOVA with Tukey’s multiple comparisons test. *p < 0.05, **p < 0.01, ***p < 0.001.
Fig. 4
Fig. 4
Metabolomic analysis of A549 cells treated with PBS, TM, CisPt and HSA@Pt+TM. (A) Heat map showing unsupervised hierarchical clustering of metabolites quantified by liquid chromatography/mass spectrometry. (B) Dot plot depicting the top-15 KEGG enrichment pathways between A549 cells treated with HSA@Pt+TM and PBS. (C) Bubble plot depicting the pathway analysis between A549 cells treated with HSA@Pt+TM and PBS. The size of the dots corresponds to the enrichment ratio, and the color of the dots corresponds to the correlated p-value. (D) The network analysis of differentially expressed metabolites between A549 cells treated with HSA@Pt+TM and PBS. Red dots indicate a metabolic pathway, yellow dots represent information on a substance-associated regulatory enzyme, green dots represent a background substance for a metabolic pathway, purple dots represent information on the class of molecular modules of a substance, blue dots represent a substance’s chemical interactions, and green squares represent the differences between substances obtained from this comparison. (E-G) Different abundances of associated with GSH metabolism in metabonomic data. n = 3. Data are presented as mean ± SD. Statistical significances between every two groups were calculated via one-way ANOVA with Tukey’s multiple comparisons test. * p < 0.05, **p < 0.01, *** p < 0.001.
Fig. 5
Fig. 5
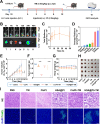
In vivo biodistribution and antitumor effects of HSA@Pt combined with TM. (A) Schematic illustration of in vivo treatment and biodistribution study. (B) Tumor imaging of LLC-bearing mice after intravenous injection of HSA@Cy7.5 at different times (top panel). (C) Quantification of fluorescence intensity in mice at different time points and (D) mean fluorescence intensity of HSA@Cy7.5 in major organs and tumor 48 h after intravenous injection. (E) Relative tumor growth inhibition curves and (F) corresponding tumor weight. (G) Body weight changes of mice treated with Saline, CisPt, HSA@Pt, CisPt+TM, HSA@Pt+TM at 2.5 mg Pt/kg or 0.5 mg TM/kg body weight. (H) Representative tumor images of different groups after 18 days of treatment. (I) H&E (above) and TUNEL (below) staining of tumor tissues in various treatments. Scalar bar: 100 μm. n = 5. Data are presented as mean ± SD. Statistical significances between every two groups were calculated via one-way ANOVA with Tukey’s multiple comparisons test. *p < 0.05, **p < 0.01, ***p < 0.001.
Fig. 6
Fig. 6
In vivo activation of systemic antitumor immune response by HSA@Pt combined with TM. (A) Immunohistochemistry images of ATP7B (above), and immunofluorescence images of PD-L1(middle) and infiltration of CD8+ T cells (below) staining sections within tumor tissues after various treatments. Scale bar: 100 μm. (B) Representative flow cytometric analysis of CD8+ and CD4+ T cells gating on CD3+ cells within spleen after various treatments. (C) The percentages of populations of mature DCs (CD80+ CD86+) within DLNs in each group are presented as histograms. (D) The percentages of populations of CD8+ T cells and (E) CD4+ T cells within spleen in each group are presented as histograms. (F) The percentages of populations of mature DCs (CD80+ CD86+) within tumor in each group are presented as histograms. (G) The percentages of populations of CD8+ T cells and (H) CD4+ T cells within tumor in each group are presented as histograms.(I) The percentages of populations of M1 TAM cells (CD80+ CD206−) and (J) M2 TAM cells (CD80− CD206+) within tumor in each group are presented as histograms. n = 3. Data are presented as mean ± SD. Statistical significances between every two groups were calculated via one-way ANOVA with Tukey’s multiple comparisons test. *p < 0.05, **p < 0.01, ***p < 0.001.

Similar articles

Cited by

References

    1. Siegel RL, Giaquinto AN, Jemal A. Cancer statistics, 2024. CA Cancer J Clin. 2024;74:12–49. - PubMed
    1. Han B, Zheng R, Zeng H, Wang S, Sun K, Chen R, Li L, Wei W, He J. Cancer incidence and mortality in China, 2022. J Natl Cancer Cent. 2024;4:47–53. - PMC - PubMed
    1. Wu YL, Tsuboi M, He J, John T, Grohe C, Majem M, Goldman JW, Laktionov K, Kim SW, Kato T, et al. Osimertinib in resected EGFR-Mutated Non-Small-Cell lung Cancer. N Engl J Med. 2020;383:1711–23. - PubMed
    1. Zenke Y, Tsuboi M, Chiba Y, Tsujino K, Satouchi M, Sawa K, Shimizu J, Daga H, Fujimoto D, Mori M, et al. Effect of Second-generation vs Third-generation chemotherapy regimens with thoracic radiotherapy on unresectable stage III Non-Small-Cell lung cancer: 10-Year Follow-up of a WJTOG0105 phase 3 randomized clinical trial. JAMA Oncol. 2021;7:904–9. - PMC - PubMed
    1. Yang JC, Lee DH, Lee JS, Fan Y, de Marinis F, Iwama E, Inoue T, Rodriguez-Cid J, Zhang L, Yang CT et al. Phase III KEYNOTE-789 study of pemetrexed and platinum with or without pembrolizumab for tyrosine kinase Inhibitor–Resistant, EGFR-Mutant, metastatic nonsquamous Non-Small cell lung Cancer. J Clin Oncol 2024:JCO2302747. - PMC - PubMed

LinkOut - more resources