

Interpretable machine learning models for prolonged Emergency Department wait time prediction
- PMID: 40102847
- PMCID: PMC11917090
- DOI: 10.1186/s12913-025-12535-w
Interpretable machine learning models for prolonged Emergency Department wait time prediction
Abstract
Objective: Prolonged Emergency Department (ED) wait times lead to diminished healthcare quality. Utilizing machine learning (ML) to predict patient wait times could aid in ED operational management. Our aim is to perform a comprehensive analysis of ML models for ED wait time prediction, identify key feature importance and associations with prolonged wait times, and interpret prediction model clinical relevance among ED patients.
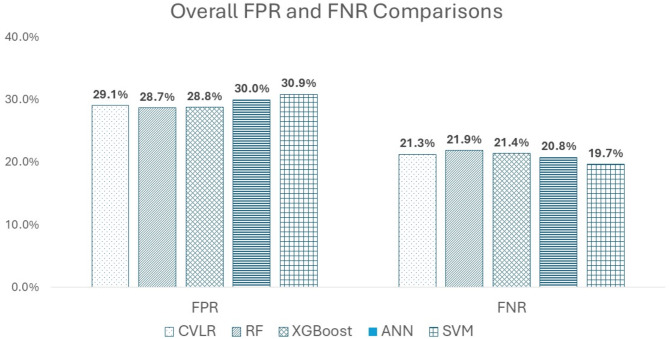
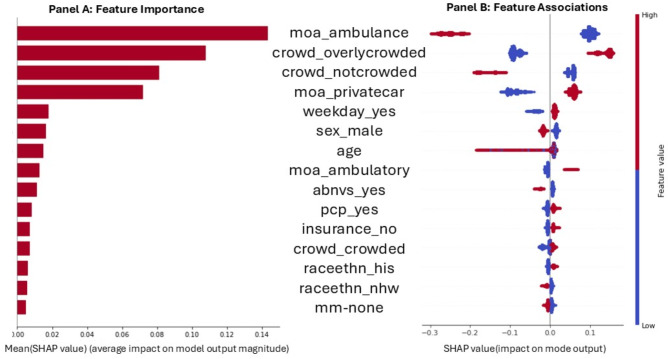
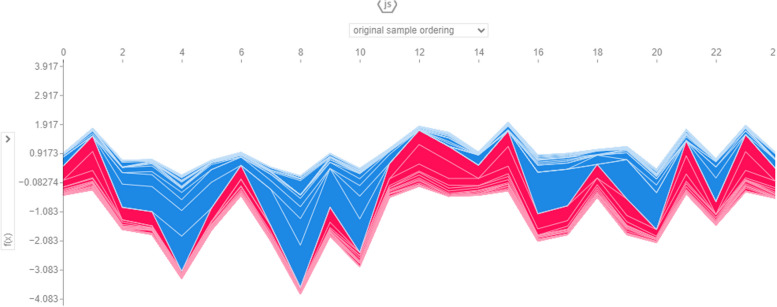
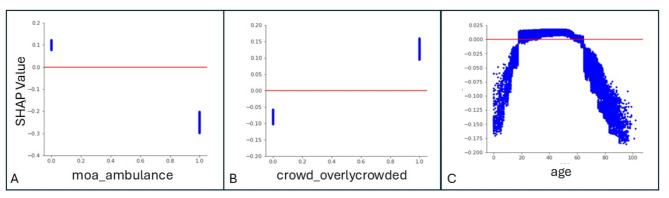
Methods: This is a single-centered retrospective study. We included ED patients assigned an Emergency Severity Index (ESI) level of 3 at triage. Patient wait times were categorized as <30 minutes and ≥30 minutes (prolonged wait time). We employed five ML algorithms - cross-validation logistic regression (CVLR), random forest (RF), extreme gradient boosting (XGBoost), artificial neural network (ANN), and support vector machine (SVM) - for predicting patient prolonged wait times. Performance assessment utilized accuracy, recall, precision, F1 score, false positive rate (FPR), and false negative rate (FNR). Furthermore, using XGBoost as an example, model key features and partial dependency plots (PDP) of these key features were illustrated. Shapley additive explanations (SHAP) were employed to interpret model outputs. Additionally, a top key feature interaction analysis was conducted.
Results: Among total 177,665 patients, nearly half of them (48.20%, 85,632) experienced prolonged ED wait times. Though all five ML models exhibited similar performance, minimizing FNR is associated with the most clinical relevance for wait time predictions. The top features influencing patient wait times and gaining the top ranked interactions were ED crowding condition and patient mode of arrival.
Conclusions: Nearly half of the patients experienced prolonged wait times in the ED. ML models demonstrated acceptable performance, particularly in minimizing FNR when predicting ED wait times. The prediction of prolonged wait times was influenced by multiple interacting factors. Proper application of ML models to clinical practice requires interpreting their predictions of prolonged wait times in the context of clinical significance.
Keywords: Emergency department; Machine learning; Performance; Wait time.
© 2025. The Author(s).
Conflict of interest statement
Declarations. Ethics approval and consent to participate: This study was approved by the University of North Texas Health Science Center Regional Institutional Review Board with a waiver of informed consent (IRB#1967558-1). The study was conducted in full compliance with the ethical principles outlined in the Declaration of Helsinki. Consent for publication: Not applicable. Competing interests: The authors declare no competing interests.
Figures

Similar articles
-
Evaluating fairness of machine learning prediction of prolonged wait times in Emergency Department with Interpretable eXtreme gradient boosting.PLOS Digit Health. 2025 Mar 20;4(3):e0000751. doi: 10.1371/journal.pdig.0000751. eCollection 2025 Mar. PLOS Digit Health. 2025. PMID: 40111994 Free PMC article.
-
A Gradient Boosting Machine Learning Model for Predicting Early Mortality in the Emergency Department Triage: Devising a Nine-Point Triage Score.J Gen Intern Med. 2020 Jan;35(1):220-227. doi: 10.1007/s11606-019-05512-7. Epub 2019 Nov 1. J Gen Intern Med. 2020. PMID: 31677104 Free PMC article.
-
Advancing Emergency Department Triage Prediction With Machine Learning to Optimize Triage for Abdominal Pain Surgery Patients.Surg Innov. 2024 Dec;31(6):583-597. doi: 10.1177/15533506241273449. Epub 2024 Aug 16. Surg Innov. 2024. PMID: 39150388
-
Are patients with longer emergency department wait times less likely to consent to research?Acad Emerg Med. 2012 Apr;19(4):396-401. doi: 10.1111/j.1553-2712.2012.01310.x. Acad Emerg Med. 2012. PMID: 22506943
-
A Machine Learning Approach to Predicting Need for Hospitalization for Pediatric Asthma Exacerbation at the Time of Emergency Department Triage.Acad Emerg Med. 2018 Dec;25(12):1463-1470. doi: 10.1111/acem.13655. Epub 2018 Nov 29. Acad Emerg Med. 2018. PMID: 30382605
References
-
- Sonnenfeld N, Pitts SR, Schappert SM, Decker SL. Emergency department volume and racial and ethnic differences in waiting times in the United States. Med Care. 2012;50(4):335–41. - PubMed
-
- Plunkett PK, Byrne DG, Breslin T, Bennett K, Silke B. Increasing wait times predict increasing mortality for emergency medical admissions. Eur J Emerg Med. 2011;18(4):192–6. - PubMed
MeSH terms
Grants and funding
LinkOut - more resources
Full Text Sources
