. 2025 Mar 19;24(1):83.
doi: 10.1186/s12943-025-02295-w.

Lactate accumulation induces H4K12la to activate super-enhancer-driven RAD23A expression and promote niraparib resistance in ovarian cancer

Affiliations

Lactate accumulation induces H4K12la to activate super-enhancer-driven RAD23A expression and promote niraparib resistance in ovarian cancer

Bingfeng Lu et al. Mol Cancer. .

Abstract

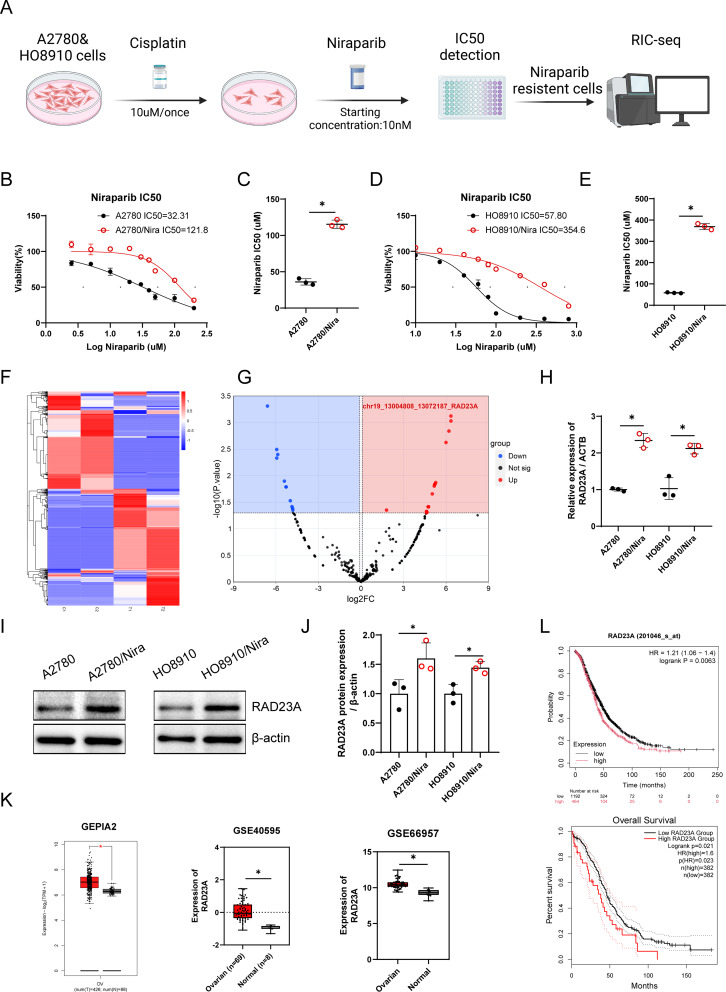
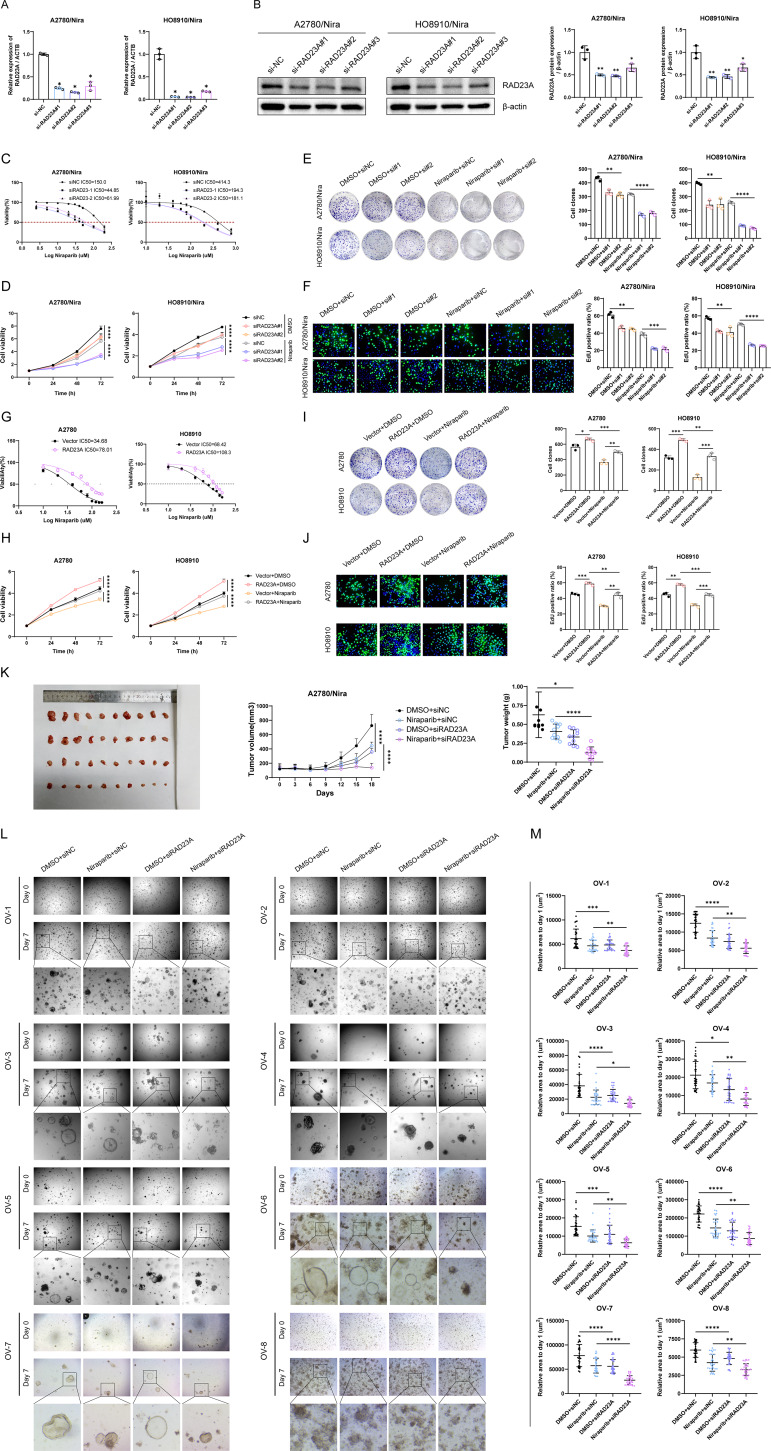
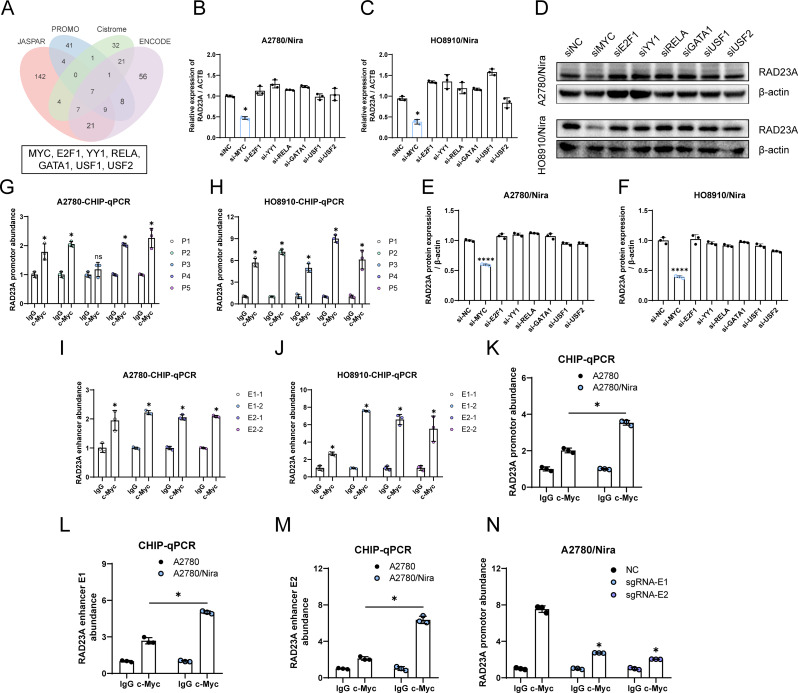
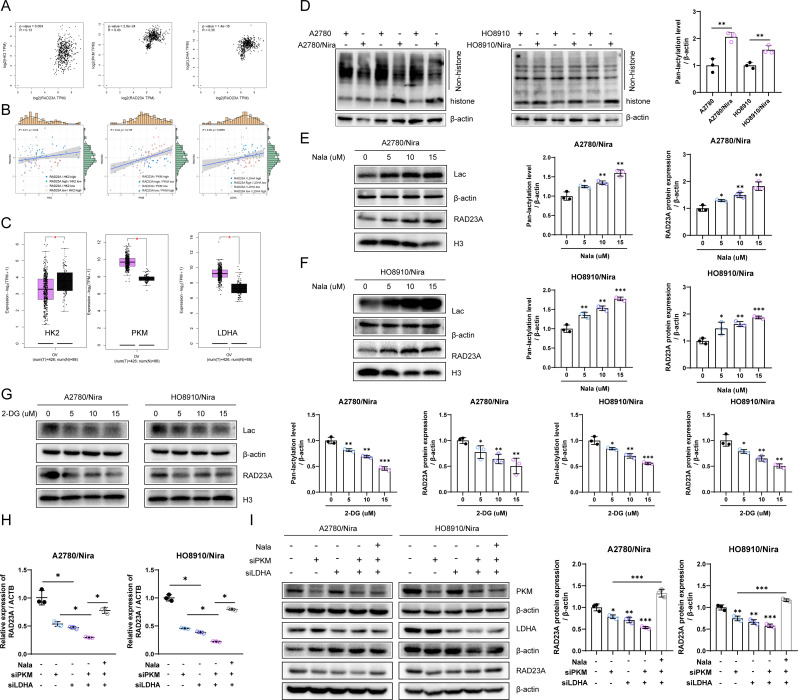
Ovarian cancer is a gynecological malignancy with the highest recurrence and mortality rates. Although niraparib can effectively affect its progression, the challenge of drug resistance remains. Herein, niraparib-resistant ovarian cancer cell lines were constructed to identify the abnormally activated enhancers and associated target genes via RNA in situ conformation sequencing. Notably, the target gene RAD23A was markedly upregulated in niraparib-resistant cells, and inhibiting RAD23A restored their sensitivity. Additionally, abnormal activation of glycolysis in niraparib-resistant cells induced lactate accumulation, which promoted the lactylation of histone H4K12 lysine residues. Correlation analysis showed that key glycolysis enzymes such as pyruvate kinase M and lactate dehydrogenase A were significantly positively correlated with RAD23A expression in ovarian cancer. Additionally, H4K12la activated the super-enhancer (SE) of niraparib and RAD23A expression via MYC transcription factor, thereby enhancing the DNA damage repair ability and promoting the drug resistance of ovarian cancer cells. Overall, the findings of this study indicate that lactic acid accumulation leads to lactylation of histone H4K12la, thereby upregulating SE-mediated abnormal RAD23A expression and promoting niraparib resistance in ovarian cancer cells, suggesting RAD23A as a potential therapeutic target for niraparib-resistant ovarian cancer.

Keywords: Glycolysis; H4K12la; Niraparib resistance; RAD23A; Super-enhancer.


Conflict of interest statement

Declarations. Ethics approval and consent to participate: The Ethics Committee of the third affiliated Hospital of Guangzhou Medical University [NO: 2024 − 301] and Liaoning Cancer Hospital & Institute [NO: KY20231103] approved the use of human tissue in this study. Informed consent was obtained from all patients. Animal experiments were approved by the Experimental Animal Ethics Committee of Guangzhou Medical University [NO: S2024-004]. Consent for publication: All authors have reviewed the final version of the manuscript and approve it for publication. Competing interests: The authors declare no competing interests.

Figures

Fig. 1
Fig. 1
RIC-seq characterizes the interaction map between super enhancers and target gene promoters in niraparib resistance in ovarian cancer. (A). Consructions of Niraparib resistant cells and RIC-seq. (B-C) IC50 detection of Niraparib in A2780 and A2780/Nira cells. (D-E) IC50 detection of Niraparib in HO8910 and HO8910/Nira cells. (F) RIC-seq sequencing shows a heat map of the interaction between aberrantly activated super enhancers and target genes in A2780/Nira cells. (G) Volcano plot showing that the super enhancer Nira-SE interacts most frequently with the target gene RAD23A. (H) QPCR detection of RAD23A mRNA levels in Niraparib-resistant and parental cells of ovarian cancer. (I-J) Detection of RAD23A protein levels in Niraparib-resistant and parental cells of ovarian cancer. (K) Expression levels of RAD23A in GEPIA2, GSE40595, and GSE66957 ovarian cancer datasets. (L) KMplot-OV database analysis of the relationship between RAD23A and overall survival of ovarian cancer patients. *p < 0.05
Fig. 2
Fig. 2
In vitro and vivo as well as organoid experiments showed that targeting RAD23A reversed niraparib resistance in ovarian cancer. (A-B) RNA and protein levels of knockdown RAD23A in A2780/Nira and HO8910/Nira cells. (C) Detection of the IC50 of Niraparib after knockdown of RAD23A in Niraparib-resistant cells. (D) Detection of cell viability after knockdown of RAD23A in Niraparib-resistant cells. (E) Detection of clone formation ability after knockdown of RAD23A in Niraparib-resistant cells. (F) EdU assay to detect cell proliferation ability after knockdown of RAD23A in Niraparib-resistant cells. (G-J) RAD23A overexpression increased Niraparib resistance and cell proliferation ability in platinum-pretreated A2780 and HO8910 cells. (K) Xenograft tumor experiment showed that compared with the siNC group, the siRAD23A group exhibited significant inhibition of subcutaneous tumor formation; the combination of siRAD23A and niraparib group exhibited significant inhibition of subcutaneous tumor formation than siNC + niraparib group, the tumor volume in the siRAD23A combined with Niraparib treatment group was the smallest. (L-M) The ovarian cancer organoid experiment showed that compared with the siNC group, the siRAD23A group exhibited significant inhibition of the growth of organoids; the combination of siRAD23A and niraparib group also exhibited significant inhibition of the growth of organoids than siNC + niraparib group. The bar graph shows the statistical analysis of the 30 organoids in each group. The microscopic imaging ratio is 4 × 10 times. *p < 0.05, **p < 0.01, ***p < 0.001, ****p < 0.0001
Fig. 3
Fig. 3
RAD23A regulates DNA damage repair in Niraparib-resistant ovarian cancer. (A-B) Immunofluorescence shows decreased level of γ-H2AX after RAD23A overexpression in A2780 and HO8910 cells, Nikon confocal imaging: 60x. (C-D) Comet assay shows decreased DNA damage levels after RAD23A overexpression in A2780 and HO8910 cells, microscopic imaging ratio: 20 × 10x. (E-H) the level of γ-H2AX and DNA damage levels after knocking down RAD23A in A2780/Nira and HO8910/Nira cells. (I) Immunohistochemistry shows that the γ-H2AX level in the siRAD23A combined with Niraparib treatment group was the highest compared to the control group and Niraparib alone group. **p < 0.01, ***p < 0.001, ****p < 0.0001
Fig. 4
Fig. 4
Blocking super enhancers effectively reduces RAD23A expression and reverses Niraparib resistance in ovarian cancer. (A) The enhancers E1 and E2 in the Nira-SE region are shown in the FAMTOMP5 database and visualized using IGV software. (B) Specific sgRNAs targeting enhancers E1 and E2 were designed, and E1 and E2 were knocked out using CRISPR-Cas9 technology; (C) DNA gel electrophoresis showed partial knockout of E1 and E2 in A2780/Nira and HO8910/Nira cells. (D) Detection of RAD23A mRNA level after knockout of enhancers E1 and E2 in Niraparib-resistant cells. (E) Detection of RAD23A protein level after knockout of enhancers E1 and E2 in Niraparib-resistant cells. (F-G) Detection of the IC50 of Niraparib after knockout of enhancers E1 or E2 in Niraparib-resistant cells. (H) Detection of clone formation ability after knockout of enhancers E1 or E2 in Niraparib-resistant cells. (I) EdU assay to detect cell proliferation ability after knocking out enhancer E1 or E2 in Niraparib-resistant cells. (J) Immunofluorescence to detect the level of DNA damage marker γ-H2AX after knocking out enhancer E1 or E2 in Niraparib-resistant cells. (K) Comet assay showed that the level of cellular DNA damage increased after knocking out enhancer E1 or E2 in A2780/Nira and HO8910/Nira cells. *p < 0.05, **p < 0.01, ***p < 0.001, ****p < 0.0001
Fig. 5
Fig. 5
Super-enhancer Nira-SE promotes the recruitment of the oncogenic transcription factor MYC to the promoter. (A) The JASPAR, PROMO, Cistrome and ENCODE databases predict the transcription factors of RAD23A. The intersection shows that YY1, USF2, MYC, E2F1, RELA, GATA1 and USF1 are the possible transcription factors of RAD23A. (B-C) The above seven transcription factors were knocked down in ovarian cancer resistant cells. The results showed that when the transcription factor MYC was knocked down, the mRNA level of RAD23A was significantly decreased. (D-F) When the transcription factor MYC was knocked down, the protein level of RAD23A was significantly decreased. (G-H) CHIP-qPCR detected the enrichment of transcription factor MYC in the promoter region of RAD23A. P1-P5 represent primers in 5 different regions on the RAD23A promoter. (I-J) CHIP-qPCR detected the enrichment of transcription factor MYC in the E1 and E2 regions of RAD23A enhancer. Two pairs of primers were designed for each region. (K) MYC is enriched more on the RAD23A promoter in ovarian cancer resistant cells. (L-M) MYC is enriched more on enhancers E1 and E2 in ovarian cancer resistant cells. (N) Knocking out enhancers E1 and E2 in ovarian cancer resistant cells significantly reduced the enrichment of transcription factor MYC in the RAD23A promoter region. ns means p > 0.05, *p < 0.05, **p < 0.01, ***p < 0.001, ****p < 0.0001
Fig. 6
Fig. 6
Glycolysis is significantly activated in niraparib-resistant ovarian cancer cells. (A) OCR assay to detect oxygen consumption rate in A2780/Nira, HO8910/Nira and their parental cells. (B) ECAR assay to detect extracellular acidification rate in A2780/Nira, HO8910/Nira and their parental cells. (C) Detection of changes in lactate content in A2780/Nira, HO8910/Nira and their parental cells. (D) Detection of Niraparib IC50 after knockdown of the key enzymes of glycolysis and addition of exogenous lactate in ovarian cancer resistant cells. (E) Clone formation assay to detect proliferation ability of ovarian cancer resistant cells after knockdown of the key enzymes of glycolysis and addition of exogenous lactate. (F) Immunofluorescence to detect the level of DNA damage marker γ-H2AX after knockdown of the key enzymes of glycolysis and addition of exogenous lactate in ovarian cancer resistant cells. Nala: Sodium L-lactate. ns means p > 0.05, *p < 0.05, **p < 0.01
Fig. 7
Fig. 7
Histone lactylation promotes RAD23A expression levels. (A-B) The correlation between key glycolysis enzymes HK2, PKM, LDHA and RAD23A was analyzed in the GEPIA2 and ICGC datasets. (C) The expression of HK2, PKM and LDHA in ovarian cancer tissues was analyzed in GEPIA2 datasets. (D) The overall level of lactylation in parental and niraparib-resistant cells was detected by pan-lactate antibody. (E-F) The change of the overall level of lactylation in niraparib-resistant cells after adding exogenous lactate was detected. (G) The change of the overall level of lactylation in niraparib-resistant cells after adding glycolysis inhibitor 2-DG was detected. (H-I) After knocking down PKM or LDHA in ovarian cancer-resistant cells, RAD23A mRNA and protein levels decreased, while the addition of exogenous lactate could restore RAD23A expression. Lac: lactylation, Nala: Sodium L-lactate. ns means p > 0.05, *p < 0.05, **p < 0.01, ***p < 0.001
Fig. 8
Fig. 8
Histone H4K12la promotes RAD23A transcription by activating the super enhancer Nira-SE. (A-B) CO-IP detected the lactylation levels of four core histones (H2A, H2B, H3, H4) in ovarian cancer niraparib-resistant cells, among which the lactylation level of histone H4 was significantly increased. (C-D) The lactylation levels of common sites of histone H4 were detected in ovarian cancer resistant cells, among which the lactylation level of H4K12la was significantly increased. (E-F) Adding exogenous lactate to ovarian cancer resistant cells can significantly increase the level of H4K12la, while adding the glycolysis inhibitor 2-DG significantly reduces the level of H4K12la. (G-H) The changes of H4K12la after knocking down the key glycolysis enzymes PKM and LDHA in ovarian cancer resistant cells and adding exogenous lactate. (I-J) The enrichment of H4K12la in the RAD23A promoter and enhancers E1 and E2 was detected in ovarian cancer parental cells. (K-L) CHIP-qPCR showed that the enrichment of H4K12la increased on the RAD23A promoter and enhancers E1 and E2 in ovarian cancer resistant cells. (M) CHIP-qPCR showed that the enrichment of H4K12la in the RAD23A promoter region decreased after knocking out the core regions E1 and E2 of the super enhancer Nira-SE, and the addition of exogenous lactate could not restore it. Lac: lactylation, Nala: Sodium L-lactate. ns means p > 0.05, *p < 0.05, **p < 0.01, ***p < 0.001, ****p < 0.0001

Similar articles

Cited by

References

    1. Siegel RL, Miller KD, Wagle NS, Jemal A. Cancer statistics, 2023. CA Cancer J Clin. 2023;73(1):17–48. - PubMed
    1. Holmes D. Ovarian cancer: beyond resistance. Nature. 2015;527(7579):S217. - PubMed
    1. Christie EL, Bowtell DDL. Acquired chemotherapy resistance in ovarian cancer. Ann Oncol. 2017;28(suppl8):viii13–5. - PubMed
    1. Penn CA, Wong MS, Walsh CS. Cost-effectiveness of maintenance therapy based on molecular classification following treatment of primary epithelial ovarian Cancer in the united States. JAMA Netw Open. 2020;3(12):e2028620. - PMC - PubMed
    1. Li GH, Qu Q, Qi TT, Teng XQ, Zhu HH, Wang JJ, et al. Super-enhancers: a new frontier for epigenetic modifiers in cancer chemoresistance. J Exp Clin Cancer Res. 2021;40(1):174. - PMC - PubMed

MeSH terms

LinkOut - more resources