

Increased melanin induces aberrant keratinocyte - melanocyte - basal - fibroblast cell communication and fibrogenesis by inducing iron overload and ferroptosis resistance in keloids
- PMID: 40102920
- PMCID: PMC11917160
- DOI: 10.1186/s12964-025-02116-z
Increased melanin induces aberrant keratinocyte - melanocyte - basal - fibroblast cell communication and fibrogenesis by inducing iron overload and ferroptosis resistance in keloids
Abstract
Background: Keloid is a typical skin fibrotic disease with unclear mechanisms and limited therapeutic options. Fibroblast-induced fibrogenesis is a crucial cause of KD. However, the types of cells involved in fibroblast fibrogenesis in KD and the specific mechanisms are unclear. This study aimed to investigate the role of melanocyte-secreted melanin in promoting fibroblast fibrogenesis and its mechanism and to evaluate the potential therapeutic effect of intervening melanin in treating keloid.
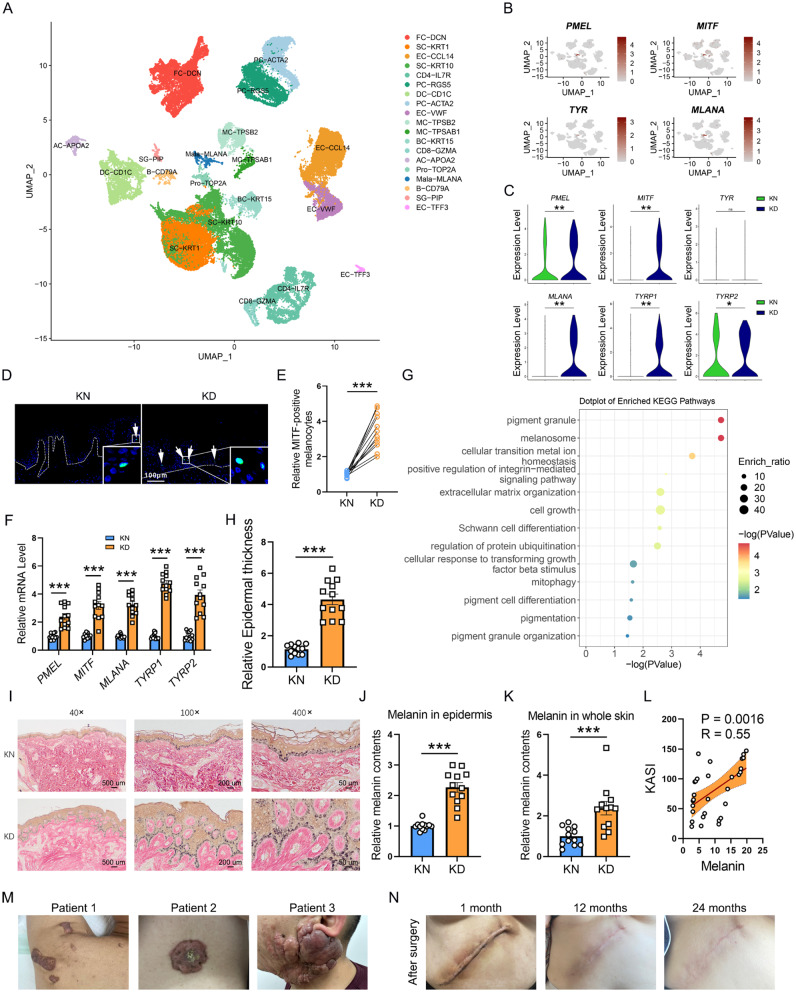
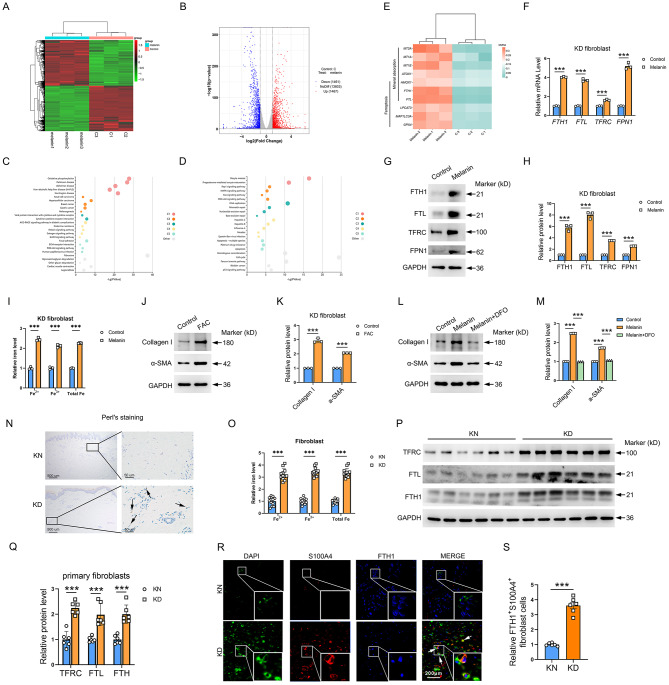
Methods: The activity of pigmentation-related pathways in KD melanocytes was examined using single-cell RNA-sequence (scRNA-seq) analysis. Masson-Fontana staining or isolated melanin quantification detected the melanin levels and distribution in the skin and cells. Collagen deposition, wounding healing, and proliferation analysis were employed to integratively assess fibroblast fibrogenesis. After melanin treatment, bulk-seq identified fibroblasts' differentially expressed genes (DEGs). The iron levels were detected by Perl's staining or isolated iron quantification. Cell viability, LipidROS, and malondialdehyde assay accessed the ferroptosis levels. The therapeutic potential of ML329 was evaluated in keloid-bearing mice.
Results: We found the enriched skin pigmentation-related pathways in the melanocytes of keloid by single-cell RNA-sequence (scRNA-seq) analysis. We further validated increased melanin levels in keloid patients. Additionally, melanin positively correlated with the Keloid Area and Severity Index in keloid. Furthermore, melanocyte-secreted melanin significantly promoted fibroblast proliferation, migration, and collagen synthesis. Mechanically, melanin increased basal cell permeability and inflammation to facilitate its transfer to the dermis, where it further activated fibroblasts by evoking iron overload and ferroptosis resistance. Consistently, iron overload and ferroptosis resistance were validated in primary fibroblasts and skin tissues of keloid patients. Inhibition of iron overload and ferroptosis resistance effectively diminish melanin-induced fibrogenesis. Interestingly, melanin induced iron overload and ferroptosis resistance in melanocytes in an autocrine manner and further stimulated keratinocytes to take up melanin to deepen skin color by upregulating the F2R-like trypsin receptor 1 (F2RL1). In vivo, the delivery of ML329, a microphthalmia-associated transcription factor (MITF) inhibitor, could suppress melanogenesis and alleviate keloid in human keloid-bearing nude mice. Meanwhile, ML329 decreased the iron content and restored the sensitivities of ferroptosis.
Conclusion: Collectively, melanin-lowing strategies may appear as a potential new therapeutic target for keloid.
Keywords: Ferroptosis resistance; Fibrogenesis; Iron overload; Keloid; Melanin.
© 2025. The Author(s).
Conflict of interest statement
Declarations. Ethics approval and consent to participate: Every animal experiment complied with the regulations authorized by Fudan University’s Institutional Animal Care and Use Committee (Approval number. FE20002). Every experiment involving human subjects complied with the ethical guidelines and protocols authorized by Fudan University’s School of Life Sciences ethics committee (Approval no. KY2023-015). Before beginning the study, each participant received information about it and completed informed consent papers. Consent for publication: All authors have agreed to publish this manuscript. Competing interests: The authors declare no competing interests.
Figures


Similar articles
-
BMP1 Promotes Keloid by Inducing Fibroblast Inflammation and Fibrogenesis.J Cell Biochem. 2024 Jul;125(7):e30609. doi: 10.1002/jcb.30609. Epub 2024 Jun 11. J Cell Biochem. 2024. PMID: 38860429
-
Ferrostatin-1 inhibits fibroblast fibrosis in keloid by inhibiting ferroptosis.PeerJ. 2024 Jun 14;12:e17551. doi: 10.7717/peerj.17551. eCollection 2024. PeerJ. 2024. PMID: 38887622 Free PMC article.
-
Identification of novel immune-related signatures for keloid diagnosis and treatment: insights from integrated bulk RNA-seq and scRNA-seq analysis.Hum Genomics. 2024 Jul 16;18(1):80. doi: 10.1186/s40246-024-00647-z. Hum Genomics. 2024. PMID: 39014455 Free PMC article.
-
Interplay Between Keratinocytes and Fibroblasts: A Systematic Review Providing a New Angle for Understanding Skin Fibrotic Disorders.Front Immunol. 2020 May 6;11:648. doi: 10.3389/fimmu.2020.00648. eCollection 2020. Front Immunol. 2020. PMID: 32477322 Free PMC article.
-
Precise role of dermal fibroblasts on melanocyte pigmentation.J Dermatol Sci. 2017 Nov;88(2):159-166. doi: 10.1016/j.jdermsci.2017.06.018. Epub 2017 Jul 1. J Dermatol Sci. 2017. PMID: 28711237 Review.
Cited by
-
Natural protection against oxidative stress in human skin melanocytes.Commun Biol. 2025 Aug 26;8(1):1283. doi: 10.1038/s42003-025-08725-1. Commun Biol. 2025. PMID: 40858814 Free PMC article. Review.
-
Molecular Insights into Oxidative-Stress-Mediated Cardiomyopathy and Potential Therapeutic Strategies.Biomolecules. 2025 May 6;15(5):670. doi: 10.3390/biom15050670. Biomolecules. 2025. PMID: 40427563 Free PMC article. Review.
References
-
- Al-Attar A, Mess S, Thomassen JM, Kauffman CL, Davison SP. Keloid pathogenesis and treatment. Plast Reconstr Surg. 2006;117:286–300. - PubMed
-
- Wang Y, Chen Y, Wu J, Shi X. BMP1 promotes keloid by inducing fibroblast inflammation and fibrogenesis. J Cell Biochem. 2024;125:e30609. - PubMed
-
- Direder M, Weiss T, Copic D, Vorstandlechner V, Laggner M, Pfisterer K, Mildner CS, Klas K, Bormann D, Haslik W, et al. Schwann cells contribute to keloid formation. Matrix Biol. 2022;108:55–76. - PubMed
MeSH terms
Substances
Grants and funding
- 82270070/the National Science Foundation of China
- 82030003/the National Science Foundation of China
- 82373507/the National Science Foundation of China
- 2023YFC2507102/National Key Research and Development Program of China
- DGF828024-3/007/Young clinical full-time research team training program
- 2019-I2M-5-066/CAMS Innovation Fund for Medical Sciences
- 2017SHZDZX01/the Shanghai Municipal Science and Technology Major Project
- 19DZ2250500/Shanghai Engineering Research Center of Hair Medicine
- 2022LJ017/Leading Talent Project of Shanghai Health Commission
- 2021ZB01/Jing'an District Clinical Advantage Special Disease Construction Project
- SHDC22022302/Clinical Research Plan of SHDC
- 2023ZZ02018/Shanghai Municipal Commission of Health and Family Planning
- shslczdzk01002/Shanghai Municipal Key Clinical Specialty
LinkOut - more resources
Full Text Sources
