

Predicting diabetic retinopathy based on routine laboratory tests by machine learning algorithms
- PMID: 40102923
- PMCID: PMC11921716
- DOI: 10.1186/s40001-025-02442-5
Predicting diabetic retinopathy based on routine laboratory tests by machine learning algorithms
Abstract
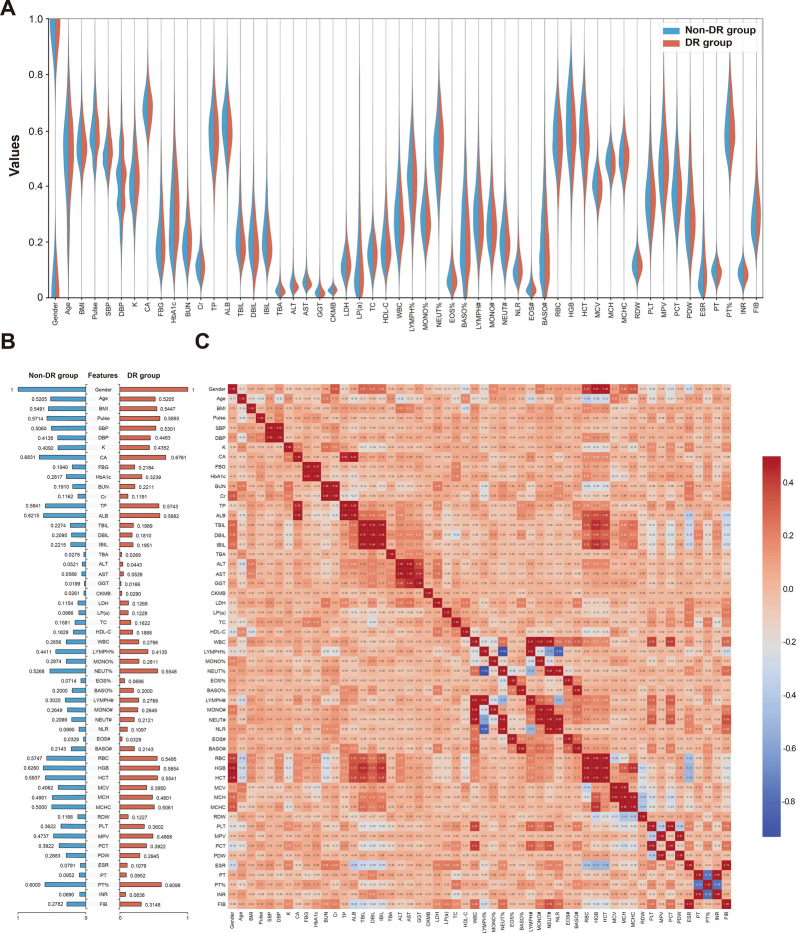
Objectives: This study aimed to identify risk factors for diabetic retinopathy (DR) and develop machine learning (ML)-based predictive models using routine laboratory data in patients with type 2 diabetes mellitus (T2DM).
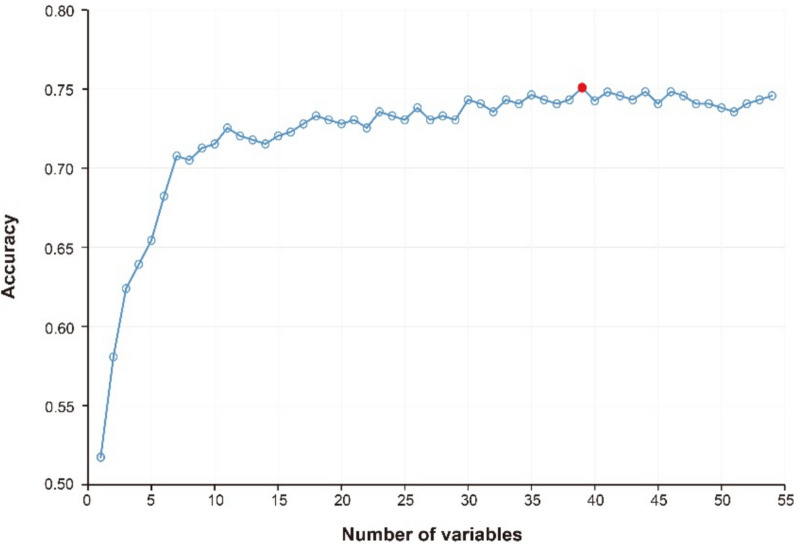
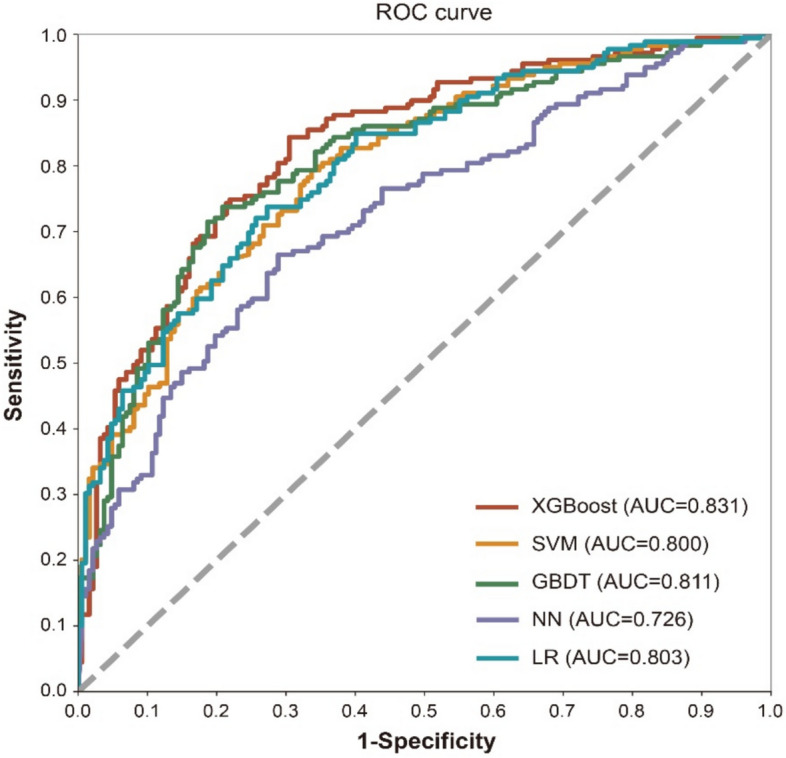
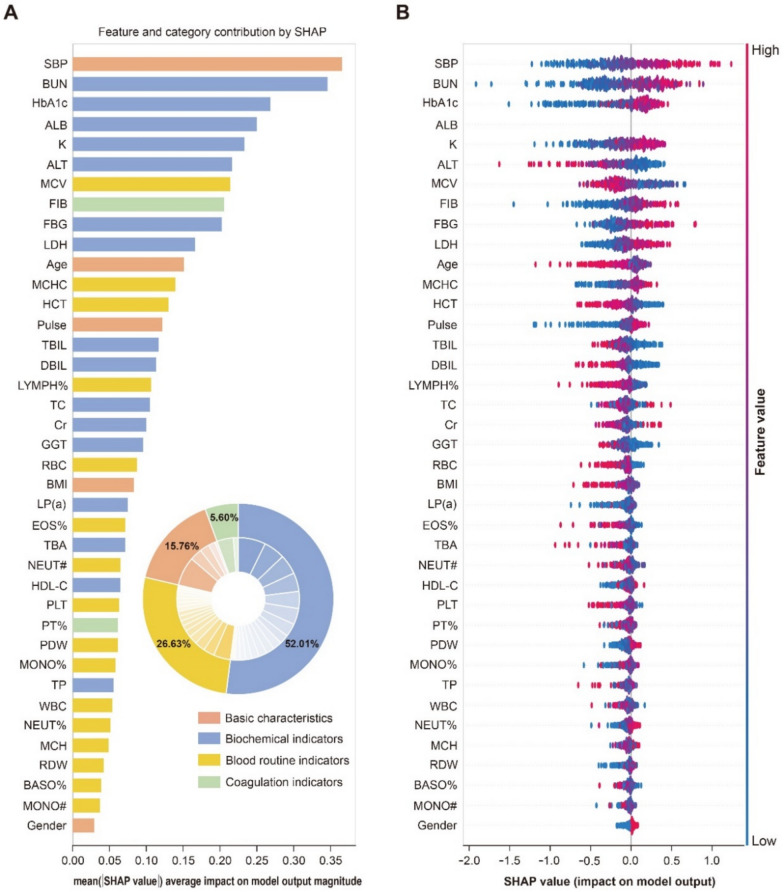
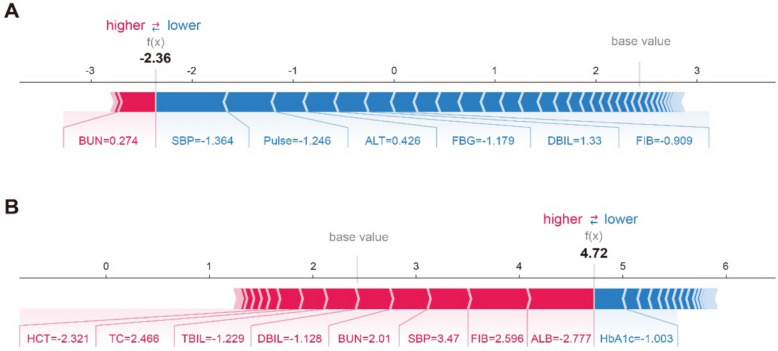
Methods: Clinical data from 4259 T2DM inpatients at Beijing Tongren Hospital were analyzed, divided into a model construction data set (N = 3936) and an external validation data set (N = 323). Using 39 optimal variables, a prediction model was constructed using the eXtreme Gradient Boosting (XGBoost) algorithm and compared with four other algorithms: support vector machine (SVM), gradient boosting decision tree (GBDT), neural network (NN), and logistic regression (LR). The Shapley Additive exPlanation (SHAP) method was employed to interpret the XGBoost model. External validation was performed to assess model performance.
Results: DR was present in 47.69% (N = 1877) of T2DM patients in the model construction data set. Among the models tested, the XGBoost model performed best with an AUC of 0.831, accuracy of 0.757, sensitivity of 0.754, specificity of 0.759, and F1-score of 0.752. SHAP explained feature importance for XGBoost model and identified key risk factors for DR. External validation yielded an accuracy of 0.650 for the XGBoost model.
Conclusions: The XGBoost-based prediction model effectively assesses DR risk in T2DM patients using routine laboratory data, aiding clinicians in identifying high-risk individuals and guiding personalized management strategies, especially in medically underserved areas.
Keywords: Diabetic retinopathy; Machine learning; Predictive model; Routine laboratory tests; Type 2 diabetes mellitus; XGBoost.
© 2025. The Author(s).
Conflict of interest statement
Declarations. Ethics approval and consent to participate: This study was approved by the ethics committee of Beijing Tongren Hospital, Capital Medical University (No. TREC2024-KY040). Human ethics and consent to participate: Every human participant agreed to participate in the study and signed an informed consent form. Competing interests: The authors declare no competing interests.
Figures


Similar articles
-
Predictive model and risk analysis for peripheral vascular disease in type 2 diabetes mellitus patients using machine learning and shapley additive explanation.Front Endocrinol (Lausanne). 2024 Feb 28;15:1320335. doi: 10.3389/fendo.2024.1320335. eCollection 2024. Front Endocrinol (Lausanne). 2024. PMID: 38481447 Free PMC article.
-
Machine learning algorithms for diabetic kidney disease risk predictive model of Chinese patients with type 2 diabetes mellitus.Ren Fail. 2025 Dec;47(1):2486558. doi: 10.1080/0886022X.2025.2486558. Epub 2025 Apr 7. Ren Fail. 2025. PMID: 40195601 Free PMC article.
-
Risk prediction of integrated traditional Chinese and western medicine for diabetes retinopathy based on optimized gradient boosting classifier model.Medicine (Baltimore). 2024 Dec 20;103(51):e40896. doi: 10.1097/MD.0000000000040896. Medicine (Baltimore). 2024. PMID: 39705459 Free PMC article.
-
Predictive model and risk analysis for diabetic retinopathy using machine learning: a retrospective cohort study in China.BMJ Open. 2021 Nov 26;11(11):e050989. doi: 10.1136/bmjopen-2021-050989. BMJ Open. 2021. PMID: 34836899 Free PMC article.
-
Development and Validation of a Machine Learning Algorithm for Predicting Diabetes Retinopathy in Patients With Type 2 Diabetes: Algorithm Development Study.JMIR Med Inform. 2025 Feb 7;13:e58107. doi: 10.2196/58107. JMIR Med Inform. 2025. PMID: 39924304 Free PMC article.
Cited by
-
Nonlinear association between visceral fat metabolism score and heart failure: insights from LightGBM modeling and SHAP-Driven feature interpretation in NHANES.BMC Med Inform Decis Mak. 2025 Jul 1;25(1):223. doi: 10.1186/s12911-025-03076-7. BMC Med Inform Decis Mak. 2025. PMID: 40597284 Free PMC article.
-
Optimized prediction of diabetes complications using ensemble learning with Bayesian optimization: a cost-efficient laboratory-based approach.Front Endocrinol (Lausanne). 2025 Jun 20;16:1593068. doi: 10.3389/fendo.2025.1593068. eCollection 2025. Front Endocrinol (Lausanne). 2025. PMID: 40626239 Free PMC article.
References
-
- Vision Loss Expert Group of the Global Burden of Disease Study; GBD. Blindness and Vision Impairment Collaborators (2024) Global estimates on the number of people blind or visually impaired by diabetic retinopathy: a meta-analysis from 2000 to 2020. Eye (Lond). 2019;38(11):2047–57. 10.1038/s41433-024-03101-5. - PMC - PubMed
-
- Teo ZL, Tham YC, Yu M, Chee ML, Rim TH, Cheung N, et al. Global prevalence of diabetic retinopathy and projection of burden through 2045: systematic review and meta-analysis. Ophthalmology. 2021;128(11):1580–91. 10.1016/j.ophtha.2021.04.027. - PubMed
-
- Chinese Diabetes Society. Guideline for the prevention and treatment of type 2 diabetes mellitus in China (2020 edition). Chin J Diabetes Mellit. 2021;13(4):315–409. 10.3760/cma.j.cn115791-20210221-00095.
-
- Fundus Disease Group of Ophthalmological Society of Chinese Medical Association, Fundus Disease Group of Ophthalmologist Branch of Chinese Medical Doctor Association. Evidence-based guidelines for diagnosis and treatment of diabetic retinopathy in China (2022). Chin J Ocul Fundus Dis. 2023;39(2):99–124. 10.3760/cma.j.cn511434-20230110-00018.
MeSH terms
Grants and funding
LinkOut - more resources
Full Text Sources
Medical
