

Single-cell RNA sequencing and spatial transcriptomics reveal the heterogeneity and intercellular communication of cancer-associated fibroblasts in gastric cancer
- PMID: 40102930
- PMCID: PMC11917039
- DOI: 10.1186/s12967-025-06376-8
Single-cell RNA sequencing and spatial transcriptomics reveal the heterogeneity and intercellular communication of cancer-associated fibroblasts in gastric cancer
Abstract
Background: Gastric cancer is a highly aggressive malignancy characterized by a complex tumor microenvironment (TME). Cancer-associated fibroblasts (CAFs), which are a key component of the TME, exhibit significant heterogeneity and play crucial roles in tumor progression. Therefore, a comprehensive understanding of CAFs is essential for developing novel therapeutic strategies for gastric cancer.
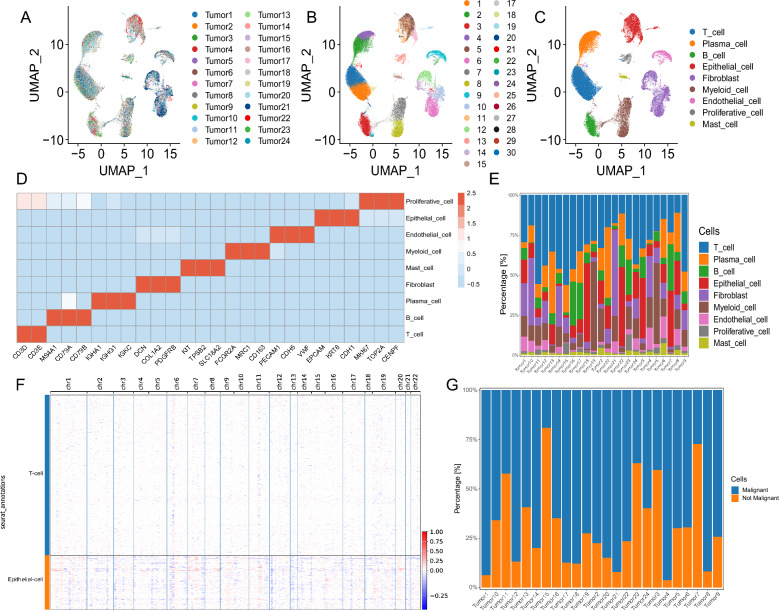
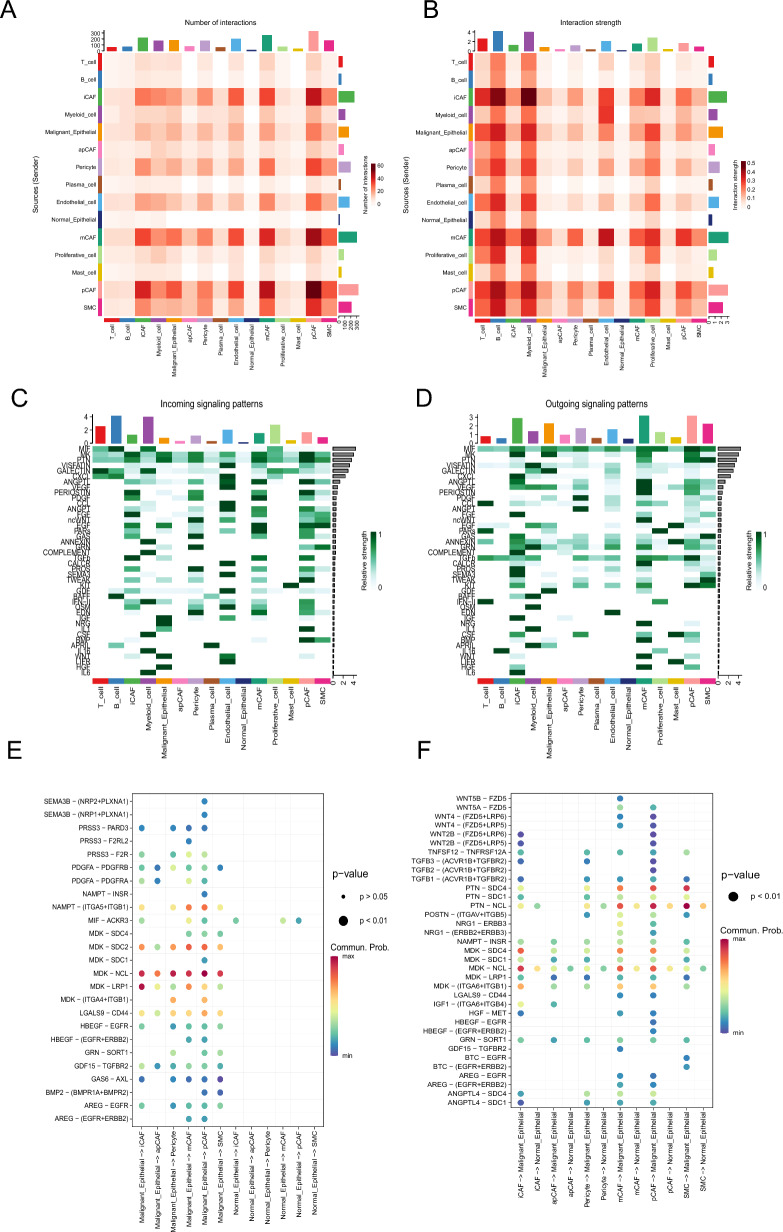
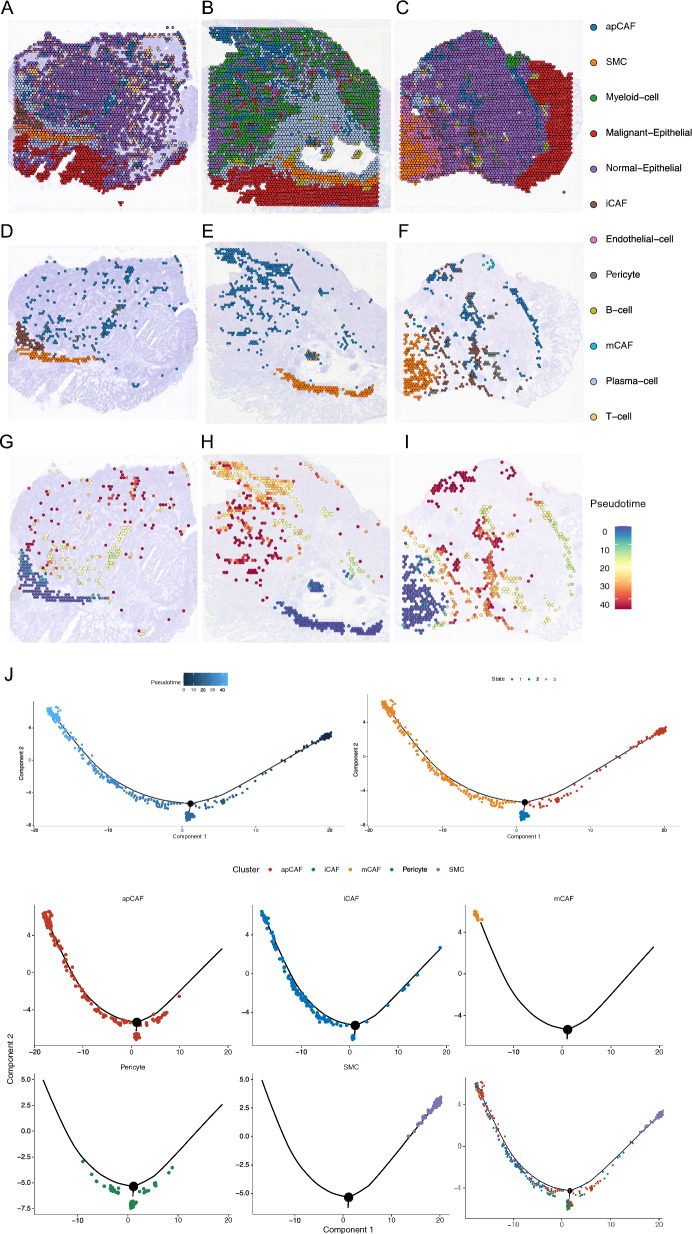
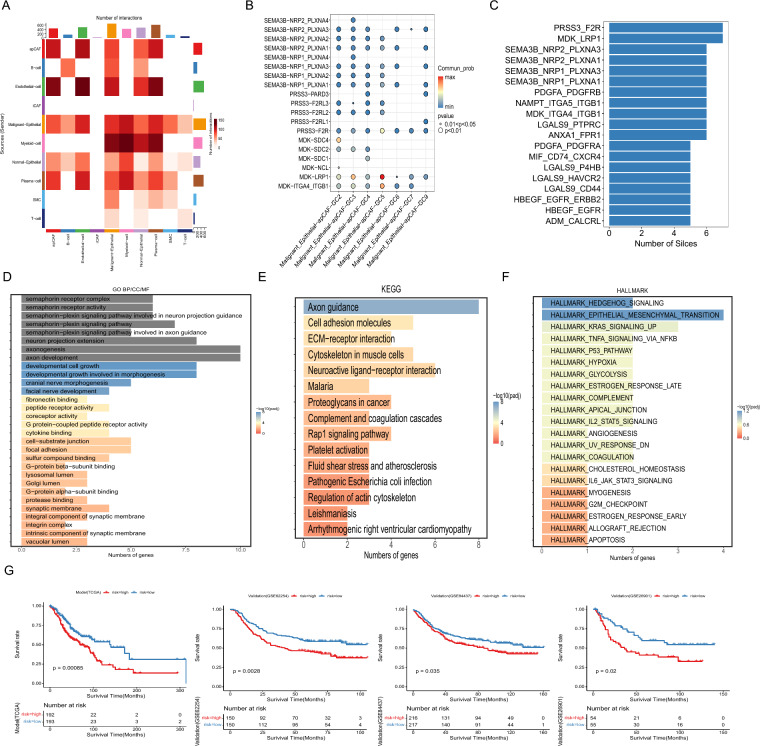
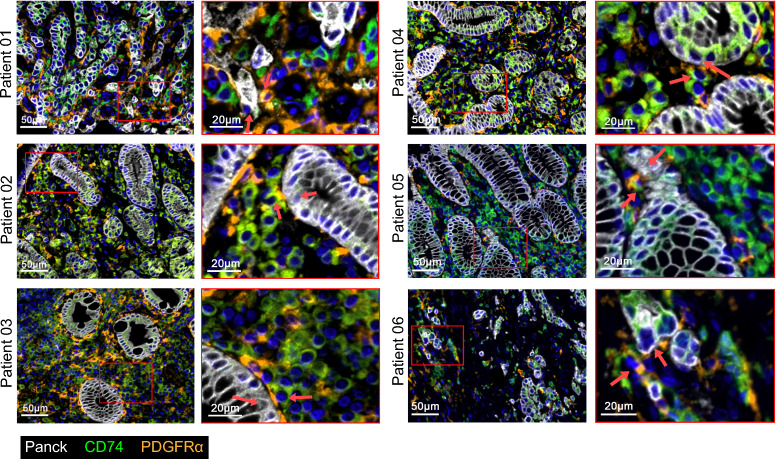
Methods: This study investigates the characteristics and functional information of CAF subtypes and explores the intercellular communication between CAFs and malignant epithelial cells (ECs) in gastric cancer by analyzing single-cell sequencing data from 24 gastric cancer samples. CellChat was employed to map intercellular communication, and Seurat was used to integrate single-cell sequencing data with spatial transcriptome data to reconstruct a comprehensive single-cell spatial map. The spatial relationship between apCAFs and cancer cells was analyzed using multicolor immunohistochemistry.
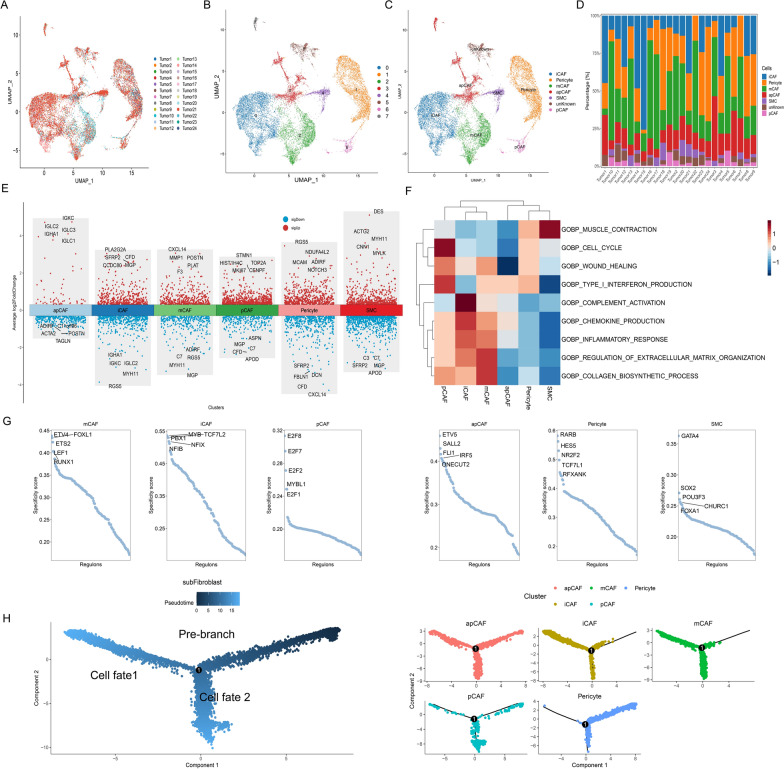
Results: Cells were categorized into nine distinct categories, revealing a positive correlation between the proportions of epithelial cells (ECs) and fibroblasts. Furthermore, six fibroblast subpopulations were identified: inflammatory (iCAFs), pericytes, matrix (mCAFs), antigen-presenting (apCAFs), smooth muscle cells (SMCs), and proliferative CAFs (pCAFs). Each of these subpopulations was linked to various biological processes and immune responses. Malignant ECs exhibited heightened intercellular communication, particularly with CAF subpopulations, through specific ligand-receptor interactions. High-density regions of CAF subpopulations displayed spatial exclusivity, with pericytes serving as a source for iCAFs, mCAFs, and apCAFs. Notably, malignant ECs and apCAFs showed increased interactions, with certain ligand-receptor pairs potentially impacting the prognosis of gastric cancer. Multiplex immunohistochemistry (mIHC) confirmed the close spatial proximity of apCAFs to cancer cells in gastric cancer.
Conclusion: Our study provided a comprehensive characterization of CAF heterogeneity in gastric cancer and revealed the intricate intercellular networks within the TME. The identified CAF subpopulations and their interactions with malignant cells could serve as potential therapeutic targets.
Keywords: Cancer-associated fibroblasts; Cell–cell interactions; Gastric cancer; Single-cell transcriptomics; Tumor microenvironment.
© 2025. The Author(s).
Conflict of interest statement
Declarations. Ethics approval and consent to participate: The study was approved by the ethics committee of affiliated cancer hospital of Zhengzhou University (2021-KY-0012-001) and conducted in accordance with the Declaration of Helsinki. All subjects gave written informed consent before participating in the study. Consent for publication: Not applicable. Competing interests: The authors declare no competing interests.
Figures
References
-
- Bray F, Laversanne M, Sung H, Ferlay J, Siegel RL, Soerjomataram I, Jemal A. Global cancer statistics 2022: GLOBOCAN estimates of incidence and mortality worldwide for 36 cancers in 185 countries. CA Cancer J Clin. 2024;74:229–63. - PubMed
-
- Smyth EC, Nilsson M, Grabsch HI, van Grieken NC, Lordick F. Gastric cancer. Lancet. 2020;396:635–48. - PubMed
-
- Zeng Y, Jin RU. Molecular pathogenesis, targeted therapies, and future perspectives for gastric cancer. Semin Cancer Biol. 2022;86:566–82. - PubMed
MeSH terms
Grants and funding
LinkOut - more resources
Full Text Sources
Medical
