

Association between the haemoglobin glycation index and 30-day and 365-day mortality in patients with heart failure admitted to the intensive care unit
- PMID: 40102933
- PMCID: PMC11916851
- DOI: 10.1186/s13098-025-01661-4
Association between the haemoglobin glycation index and 30-day and 365-day mortality in patients with heart failure admitted to the intensive care unit
Abstract
Background: The hemoglobin glycation index (HGI) represents the difference between the observed and predicted values of haemoglobin A1c (HbA1c). However, the association between HGI and prognosis of heart failure (HF) is not completely clarified yet and requires more investigation. This study aimed to explore the connection between HGI and mortality in HF patients.
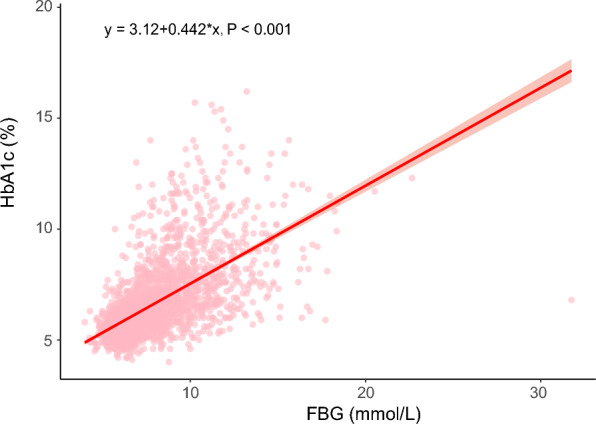
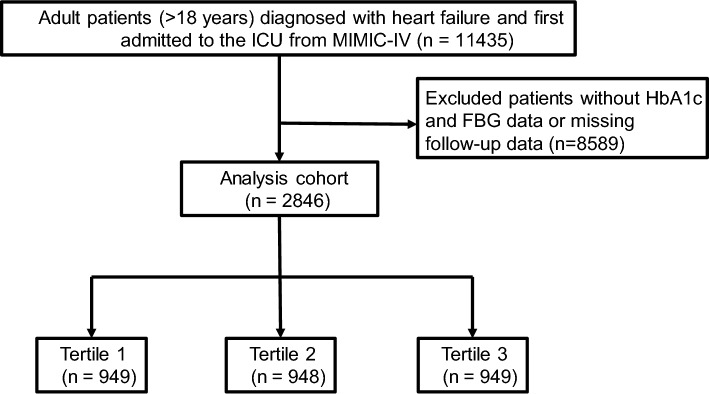
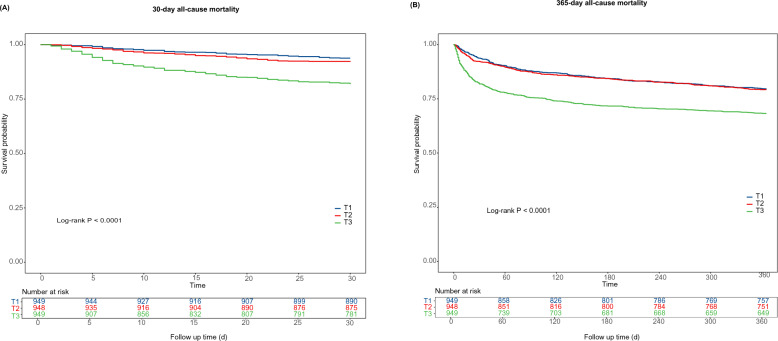
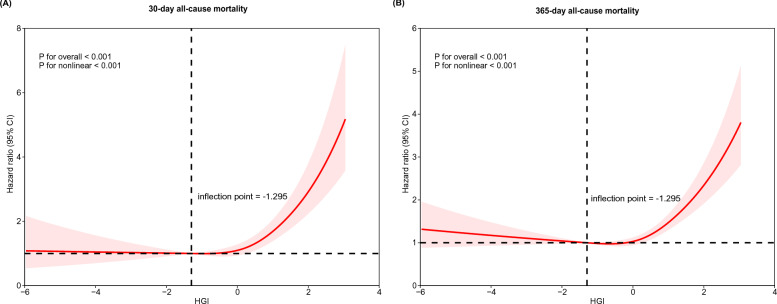
Methods: The data for the study were derived from the MIMIC-IV database from 2008 to 2019, a publicly available clinical database in intensive care. A linear regression equation between HbA1c and fasting blood glucose (FBG) was established to calculate predicted HbA1c. The endpoints were 30-day and 365-day all-cause mortality. Kaplan-Meier analysis was utilized to compare survival rates across groups differentiated by their HGI levels. The Cox regression models and restricted cubic spline (RCS) analysis were utilized to analyze the association between HGI and mortality.
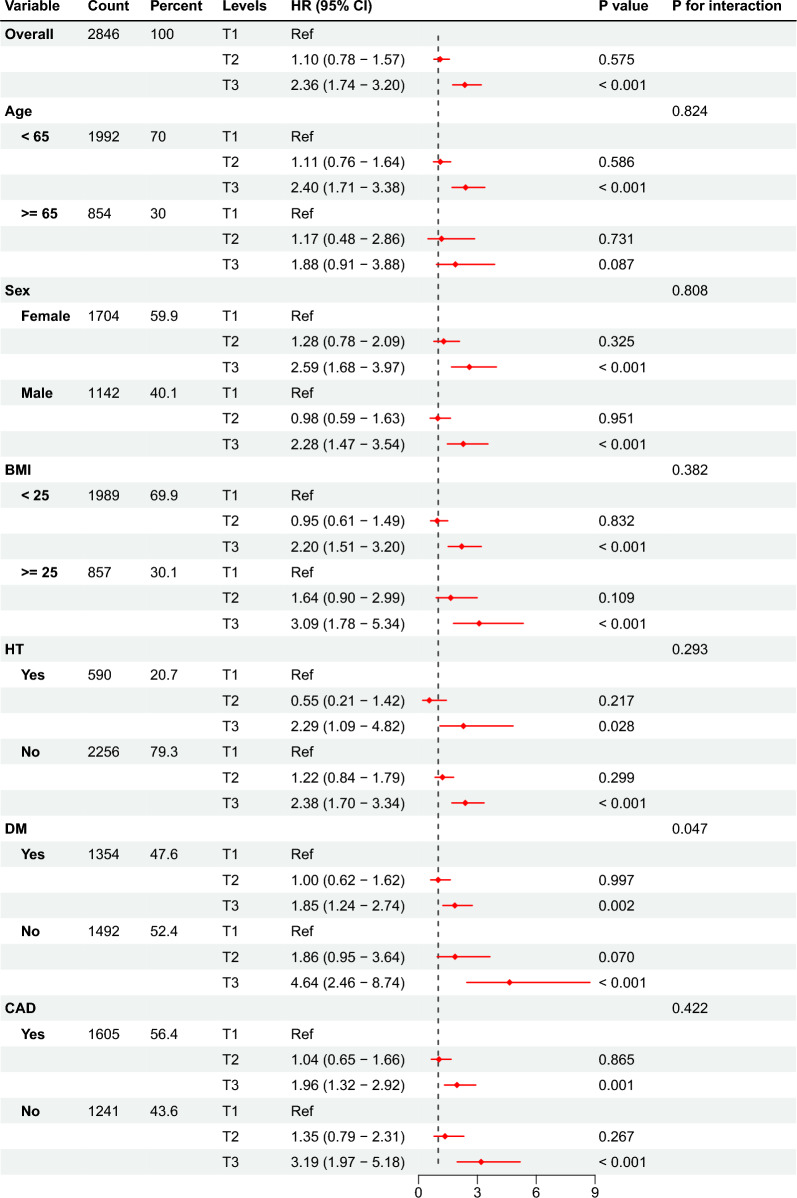
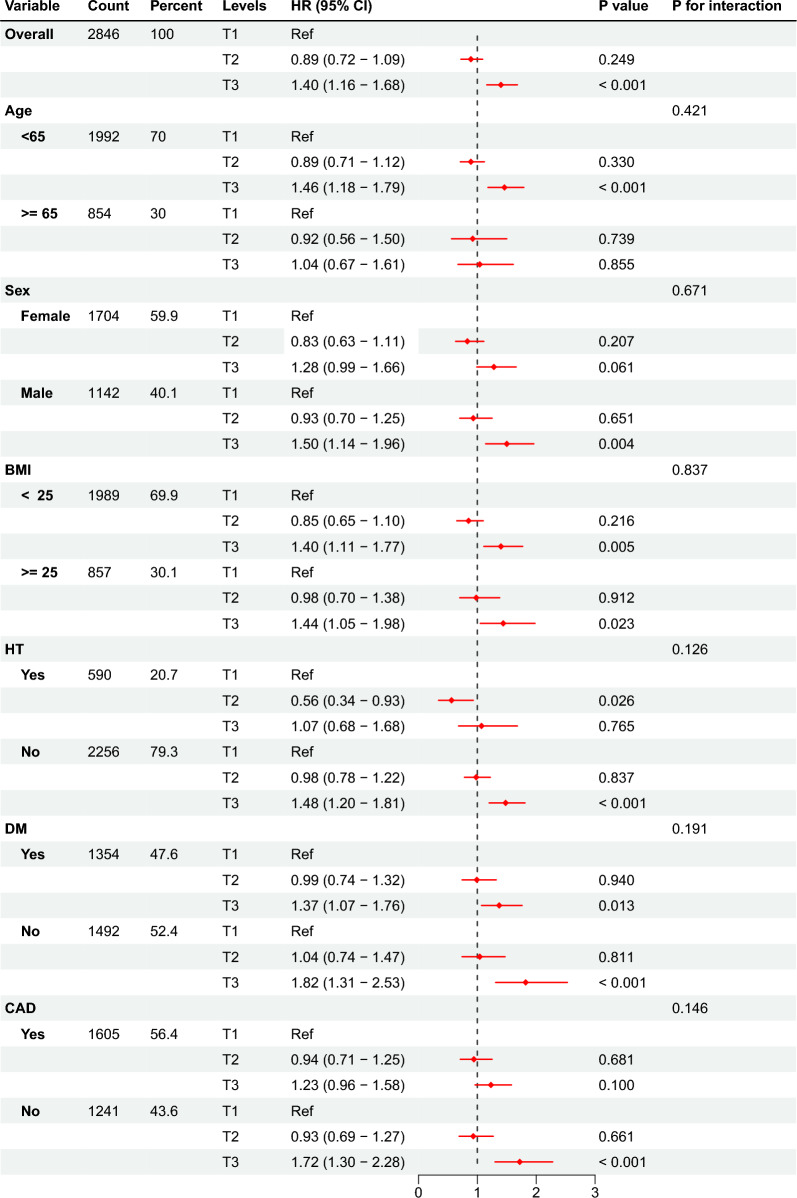
Results: The study collected a total of 2846 patients with HF (40.1% male), of whom 305 patients (10.7%) died within 30 days and 954 patients (33.5%) died within 365 days. Kaplan-Meier curves revealed patients with higher HGI had significantly higher mortality risks (log-rank P < 0.001). A high HGI was significantly associated with 30-day mortality (adjusted HR [aHR]: 2.36, 95% CI: 1.74-3.20, P < 0.001) and 365-day mortality (aHR: 1.40, 95% CI: 1.16-1.68, P < 0.001) after adjustment for potential confounders. Likewise, each unit increase in the HGI correlated with a 1.42-fold higher risk of 30-day mortality (aHR: 1.42, 95% CI: 1.28-1.57, P < 0.001) and 1.19-fold higher risk of 365-day mortality (aHR: 1.19, 95% CI: 1.11-1.68, P < 0.001). RCS analysis suggested an L-shaped nonlinear association between HGI and clinical endpoints (P for nonlinearity < 0.001), with an inflection point value of - 1.295. Subgroup analysis and sensitivity analysis revealed that the correlation between HGI and 30-day and 365-day all-cause mortality remained consistent.
Conclusions: In ICU-admitted HF patients, HGI was independently associated with increased risks of 30-day and 365-day mortality and the identification of high HGI (> 0.709) provided a valuable tool for clinicians to detect high-risk populations. Integrating HGI into routine clinical practice might strengthen the prognosis-based decision making improve HF patient outcomes.
Keywords: All-cause mortality; Haemoglobin glycation index; Heart failure; MIMIC-IV database.
© 2025. The Author(s).
Conflict of interest statement
Declarations. Ethics approval and consent to participate: This study was conducted according to the guidelines of the Declaration of Helsinki. The MIMIC-IV protocol was revised and approved by the Ethics Review Committee of the Massachusetts Institute of Technology and Beth Israel Deaconess Medical Center. Because the data were publicly available, ethics approval statements and informed consent were not required. Consent for publication: All the authors read and approved the manuscript. Competing interests: The authors declare no competing interests.
Figures
Similar articles
-
Association between hemoglobin glycation index and poor prognosis in patients with AKI: a retrospective cohort analysis of the MIMIC-IV database.Ren Fail. 2025 Dec;47(1):2499232. doi: 10.1080/0886022X.2025.2499232. Epub 2025 May 13. Ren Fail. 2025. PMID: 40356360 Free PMC article.
-
The relationship between hemoglobin glycation index and all-cause mortality in ill critically patients with heart failure: a retrospective study in MIMIC-IV database.BMC Cardiovasc Disord. 2025 Apr 24;25(1):317. doi: 10.1186/s12872-025-04711-x. BMC Cardiovasc Disord. 2025. PMID: 40275131 Free PMC article.
-
Risk analysis of the association between different hemoglobin glycation index and poor prognosis in critical patients with coronary heart disease-A study based on the MIMIC-IV database.Cardiovasc Diabetol. 2024 Mar 30;23(1):113. doi: 10.1186/s12933-024-02206-1. Cardiovasc Diabetol. 2024. PMID: 38555454 Free PMC article.
-
Risk and mediation analyses of hemoglobin glycation index and survival prognosis in patients with sepsis.Clin Exp Med. 2024 Aug 7;24(1):183. doi: 10.1007/s10238-024-01450-9. Clin Exp Med. 2024. PMID: 39110305 Free PMC article.
-
Association Between Hemoglobin Glycation Index and Risk of Cardiovascular Disease and All Cause Mortality in Type 2 Diabetic Patients: A Meta-Analysis.Front Cardiovasc Med. 2021 May 28;8:690689. doi: 10.3389/fcvm.2021.690689. eCollection 2021. Front Cardiovasc Med. 2021. PMID: 34124211 Free PMC article.
Cited by
-
The Association Between the Hemoglobin Glycation Index and Cardiometabolic Diseases: A Mini-Review.J Clin Hypertens (Greenwich). 2025 Jul;27(7):e70092. doi: 10.1111/jch.70092. J Clin Hypertens (Greenwich). 2025. PMID: 40662995 Free PMC article. Review.
References
-
- Savarese G, Becher PM, Lund LH, Seferovic P, Rosano GMC, Coats AJS. Global burden of heart failure: a comprehensive and updated review of epidemiology. Cardiovasc Res. 2023;118(17):3272–87. 10.1093/cvr/cvac013. - PubMed
-
- Heidenreich PA, Bozkurt B, Aguilar D, Allen LA, Byun JJ, Colvin MM, et al. 2022 AHA/ACC/HFSA Guideline for the Management of Heart Failure: A Report of the American College of Cardiology/American Heart Association Joint Committee on Clinical Practice Guidelines. Circulation. 2022;145(18):e895–1032. 10.1161/cir.0000000000001063. - PubMed
-
- Lehrke M, Marx N. Diabetes mellitus and heart failure. Am J Med. 2017;130(6s):S40-s50. 10.1016/j.amjmed.2017.04.010[publishedOnlineFirst:2017/05/21]. - PubMed
Grants and funding
- No.2022-1-4062/Capital's Funds for Health Advancement and Research
- 2024-NHLHCRF-YS-01, 2024-NHLHCRF-JBGS-WZ-06, 2023-NHLHCRF-YXHZ-ZRMS-09/the National High-Level Hospital Clinical Research Funding
- No.82270352/National Natural Science Foundation of China
- 2022-YJXBF-04-03/Beijing Research Ward Construction Clinical Research Project
LinkOut - more resources
Full Text Sources
Research Materials
Miscellaneous
