. 2025 Mar 18;26(1):63.
doi: 10.1186/s13059-025-03527-4.

Analysis of 30 chromosome-level Drosophila genome assemblies reveals dynamic evolution of centromeric satellite repeats

Affiliations

Analysis of 30 chromosome-level Drosophila genome assemblies reveals dynamic evolution of centromeric satellite repeats

Daniel Gebert et al. Genome Biol. .

Abstract

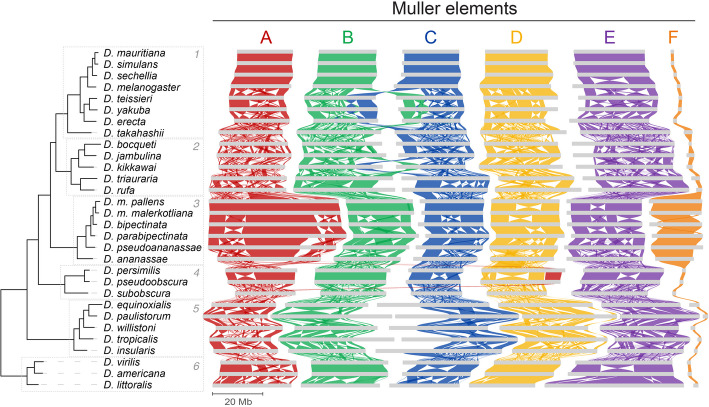
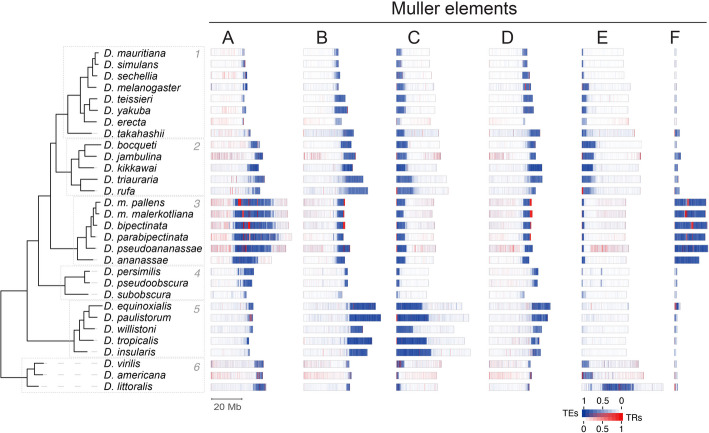
Background: The Drosophila genus is ideal for studying genome evolution due to its relatively simple chromosome structure and small genome size, with rearrangements mainly restricted to within chromosome arms, such as Muller elements. However, work on the rapidly evolving repetitive genomic regions, composed of transposons and tandem repeats, have been hampered by the lack of genus-wide chromosome-level assemblies.

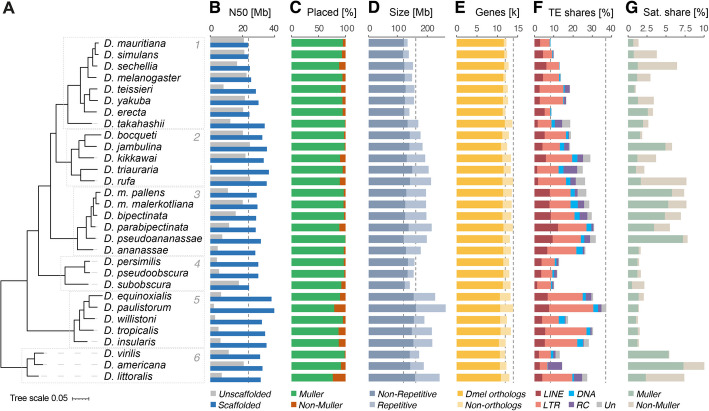
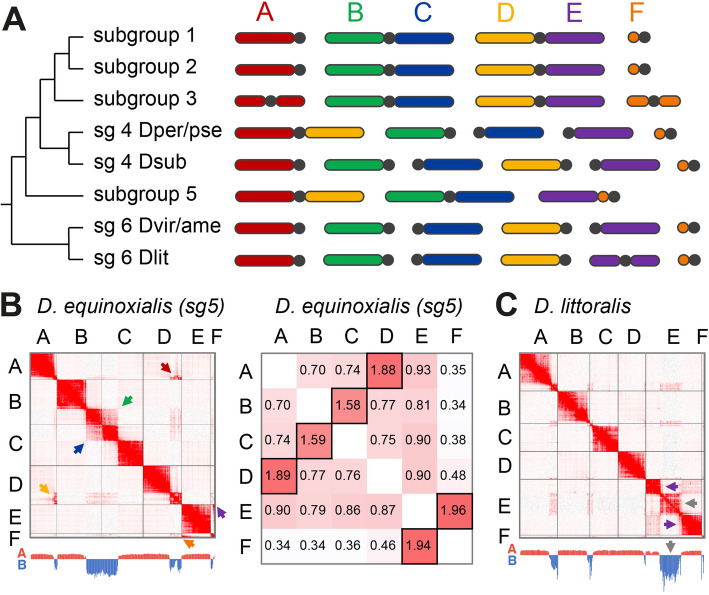
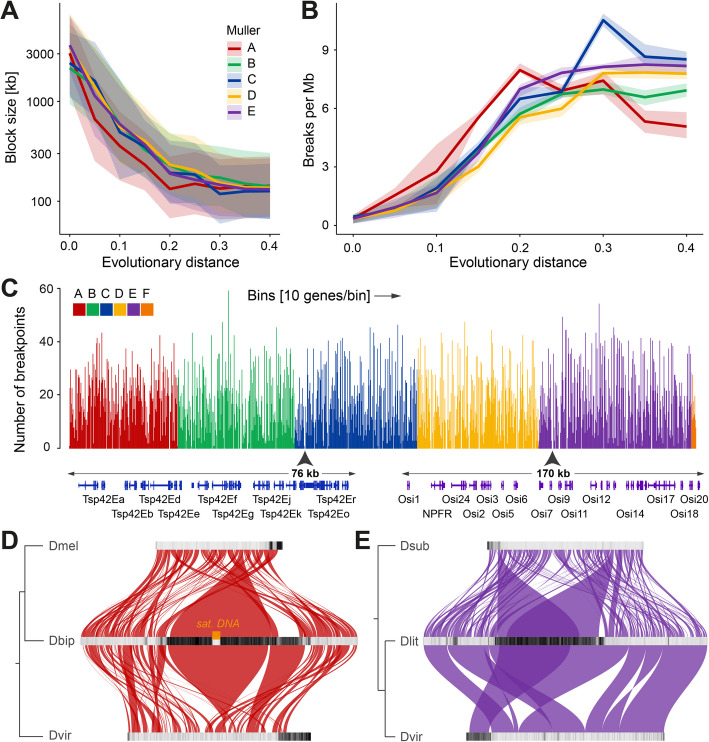
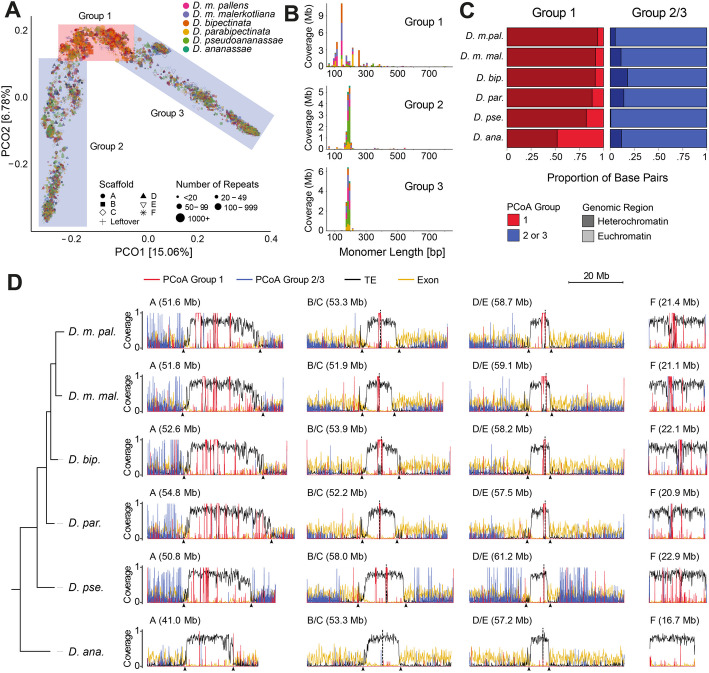
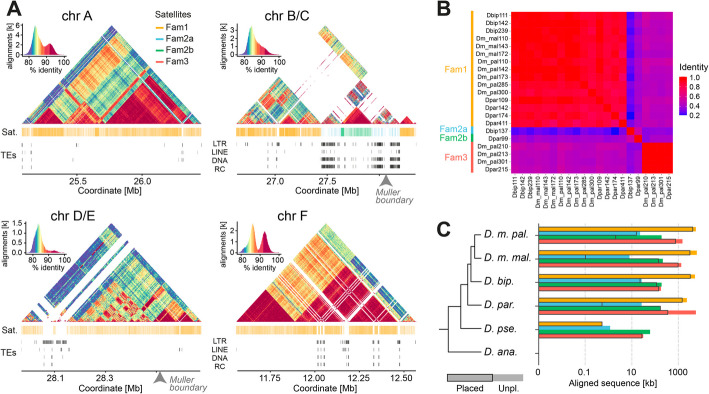
Results: Integrating long-read genomic sequencing and chromosome capture technology, here we produce and annotate 30 chromosome-level genome assemblies within the Drosophila genus. Based on this dataset, we reveal the evolutionary dynamics of genome rearrangements across the Drosophila phylogeny, including the identification of genomic regions that show comparatively high structural stability throughout evolution. Moreover, within the ananassae subgroup, we uncover the emergence of new chromosome conformations and the rapid expansion of novel satellite DNA sequence families, which form large and continuous pericentromeric domains with higher-order repeat structures that are reminiscent of those observed in the human and Arabidopsis genomes.

Conclusions: These chromosome-level genome assemblies present a valuable resource for future research, the power of which is demonstrated by our analysis of genome rearrangements and chromosome evolution. In addition, based on our findings, we propose the ananassae subgroup as an ideal model system for studying the evolution of centromere structure.


Conflict of interest statement

Declarations. Ethics approval and consent to participate: Not applicable. Competing interests: The authors declare that they have no competing interests.

Figures

Fig. 1
Fig. 1
Overview of assembly quality, Muller placement, size, and annotation of genes, TEs, and satellites. A Phylogenetic tree produced by OrthoFinder based on the consensus of all gene trees. Species subgroups are numbered 1–6. Tree scale shows (0.05) rate of substitutions per amino acid site. B N50 values of unscaffolded assemblies published by Kim et al. [28] (gray) and assemblies scaffolded in this study (blue) in Mb (million base pairs). The dashed line indicates the minimal N50 value after scaffolding (D. mauritiana) among all 30 species. C Percentage of genomic sequence placed within Muller element scaffolds (green) or unplaced scaffolds (orange). D Size of scaffolded genome assemblies in Mb. Non-repetitive DNA shown in dark shade, repetitive DNA shown in light blue. E Number of thousands of genes with (dark) and without (light) identified D. melanogaster orthologs. The dashed lines indicate the minimal and maximal non-repetitive genome sizes. F Share of annotated transposable elements (TE) classes as percentage of genomic sequence. G Share of satellite DNA as percentage of genomic sequence that are located within Muller element scaffolds (green) or unplaced scaffolds (beige)
Fig. 2
Fig. 2
The chromosomal organization of Muller elements in different species subgroups. A Schematic of Muller element chromosomal organizations. Chromosome bodies are colored according to Muller element and centromeres are represented by black dots. B Left panel: HiC contact map of Muller elements for D. equinoxialis (subgroup 5). Contacts between different Muller elements are highlighted by arrows: B and C contacts in green and blue arrows; A and D contacts in red and yellow arrows; E and F contacts in purple and orange arrows. Distribution of A/B compartment along the genome is shown below the HiC maps (whole genome PCA eigenvectors; for Muller element-specific PCA, see Additional file 1: Fig. S2). Right panel: Normalized contact intensity values between different Muller elements. Individual squares for each pairwise comparison are colored on a white-to-red scale representing low-to-high contact values. Squares containing the highest values for each pair of Muller elements are highlighted by black borders. C HiC contact map of Muller elements for D. littoralis (subgroup 6). Purple arrows highlight A compartment of Muller E; gray arrows highlight B-compartment
Fig. 3
Fig. 3
Overview of genomic rearrangements across Drosophila species. Ribbons between Muller elements of different species represent syntenic blocks based on gene synteny. The F elements of D. pseudoananassae, D. ananassae, D. persimilis, and D. pseudoobscura were reversed for visual clarity
Fig. 4
Fig. 4
Evolutionary analysis of genomic rearrangements and syntenic blocks. A Syntenic block sizes in kilo base pairs (kb) relative to evolutionary distance in substitutions per amino acid site for each Muller element. Ribbons around lines represent interquartile range (IQR). B Breaks between synteny blocks per million base pairs (Mb) relative to evolutionary distance for each Muller element. Ribbons around lines represent IQR. C Number of synteny breakpoints within bins of 10 genes across the D. melanogaster genome when compared to the remaining 29 species. One thousand one hundred ninety eight gene bins are shown continuously in the order as they are located on Muller elements from A to F. Zoomed-in genomes browser views of gene cluster of Tetraspanin 42E and Osiris gene families are shown below, as representatives of prominent sites with multiple consecutive bins devoid of breakpoints. D Synteny between A elements of D. bipectinata compared to D. melanogaster and D. virilis. TE densities per 200-kb bins are shown with black (high TE density) to light gray (low TE density) scales. E Synteny between E elements of D. littoralis compared to D. subobscura and D. virilis
Fig. 5
Fig. 5
Distribution of TEs and satellite DNA across Muller elements. Density of TEs (blue) and satellite DNA (red) are shown in bins of 100 kb. Satellite DNA includes both simple and complex sequences
Fig. 6
Fig. 6
Satellite DNA analysis in ananassae subgroup. A Principal coordinate analysis (PCoA) plot on multiple sequence alignments for satellite array consensus sequences. Each point represents an array with its shape according to the scaffold/Muller element it is located on, colored by species, and its size representing the number of repeats in the array. Colored squares define three groups of Satellite DNA: red square for group 1; blue squares for groups 2 and 3. B Length distribution of satellite DNA repeat monomers in PCoA groups 1–3. Bar colors represent species as depicted in A. C Sequence (bp) proportion of satellite DNA from PCoA group 1 and combined PCoA groups 2 and 3 in the heterochromatic (dark) and euchromatic (light) compartments as defined by TE density (see Methods). D Distribution of PCoA group 1 satellite DNA (red), combined PCoA groups 2 and 3 satellite DNA (blue), TEs (black), and gene exons (yellow) across the chromosomes of the species in the ananassae subgroup. Bins of 100 kb were used for TEs and exons, while 30-kb bins were used for satellite DNA
Fig. 7
Fig. 7
Analysis of the heterochromatic satellite DNA arrays in the ananassae subgroup. A Higher-order structure analysis of long satellite DNA arrays in D. bipectinata. StainedGlass sequence identity heatmap of putative centromeric regions of chromosomes A, B/C, D/E, and F, using a window size of 1 kb. Histograms at the top left show the assignment of colors to sequence identity values for each heatmap. Blast alignment hits of satellite DNA families and TE annotations are shown below. B Identity heatmap of multiple sequence alignments of consensus sequences of peri/centromeric satellite DNA arrays. C Combined lengths (kb) of all sequence alignments of satellite DNA families 1, 2a/b, and 3 in the genomes of the ananassae subgroup. Dispersed, very short alignments (< 50 bp) were filtered out

Similar articles

References

    1. Sturtevant AH. The linear arrangement of six sex-linked factors in Drosophila, as shown by their mode of association. J Exp Zool. 1913;14:43–59.
    1. Sturtevant AH. A case of rearrangement of genes in Drosophila. Proc Natl Acad Sci U S A. 1921;7:235–7. - PMC - PubMed
    1. Bridges CB. SALIVARY CHROMOSOME MAPS: with a key to the banding of the chromosomes of Drosophila Melanogaster. J Hered. 1935;26:60–4.
    1. Dobzhansky T. Genetics and the origin of species. New York: Columbia University Press; 1937.
    1. Muller HJ. An analysis of the process of structural change in chromosomes of Drosophila. J Genet. 1940;40:1–66.

LinkOut - more resources