. 2025 Mar 18;13(1):62.
doi: 10.1186/s40478-025-01979-0.

Spatiotemporal perturbations of the plasminogen activation system in a rat model of acute organophosphate intoxication

Affiliations

Spatiotemporal perturbations of the plasminogen activation system in a rat model of acute organophosphate intoxication

Thomas J Blackmon et al. Acta Neuropathol Commun. .

Abstract

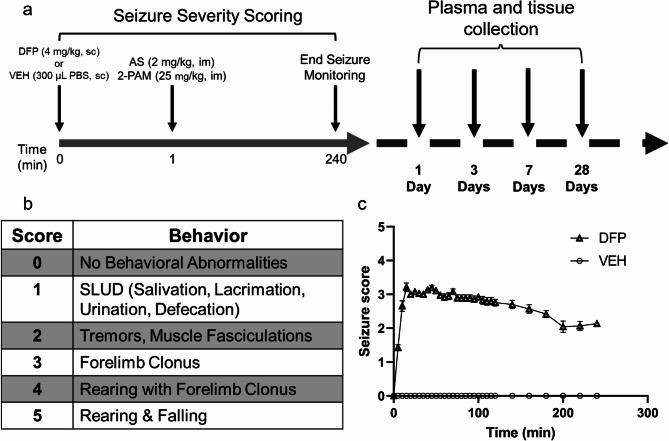
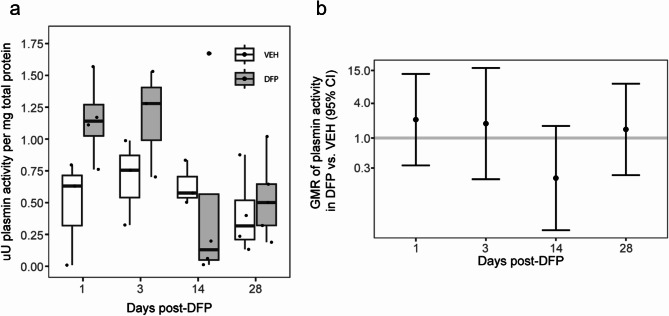
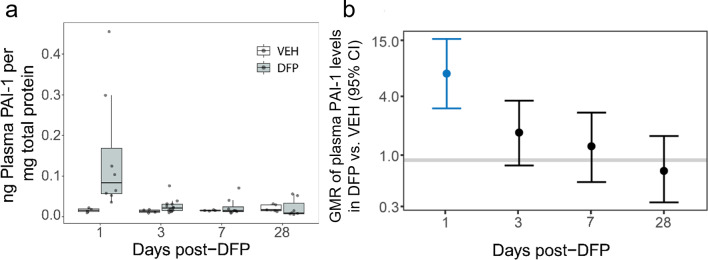
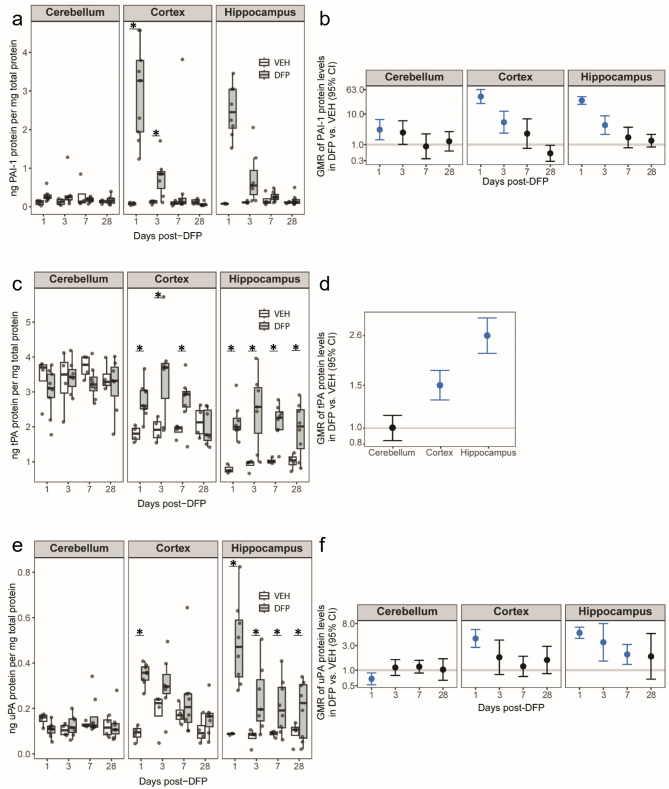
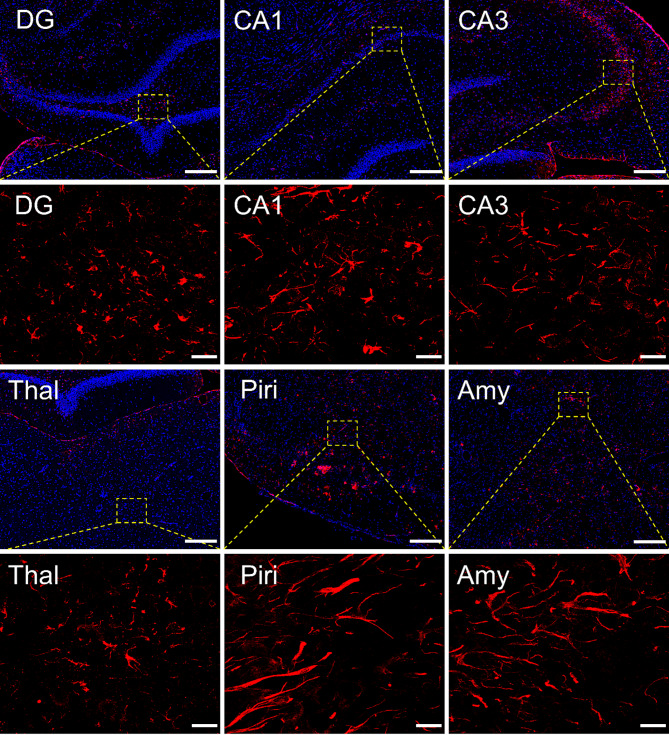
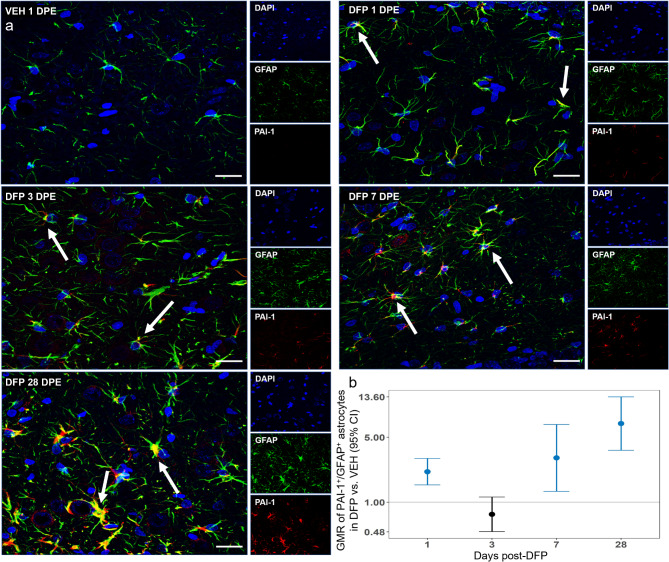
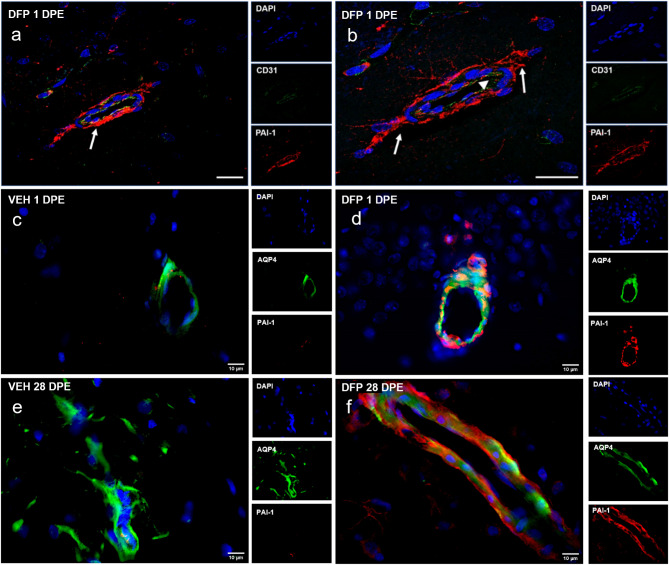
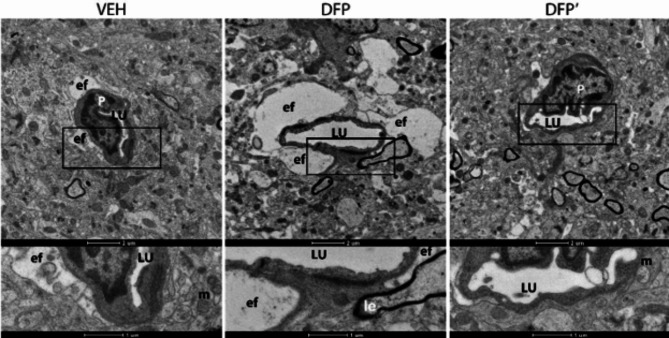
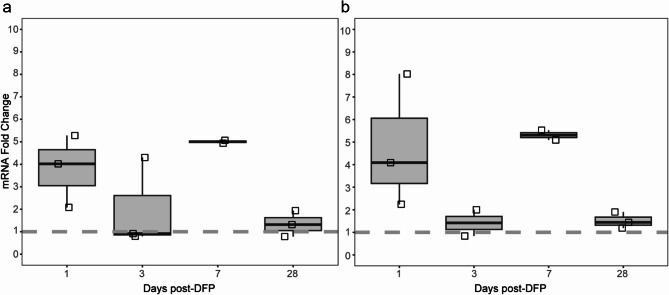
Neuroinflammation is widely posited to be a key pathogenic mechanism linking acute organophosphate (OP)-induced status epilepticus (SE) to persistent brain injury and abnormal electrical activity that contribute to epilepsy and cognitive impairment. The plasminogen activation system (PAS) promotes neuroinflammation in diverse neurological diseases but whether it is activated following acute OP intoxication has yet to be evaluated. To address this data gap, we characterized the spatiotemporal expression patterns of multiple components of the PAS in a rat model of acute intoxication with the OP, diisopropylfluorophosphate (DFP). Adult male Sprague Dawley rats administered DFP (4 mg/kg, sc), atropine sulfate (2 mg/kg, im) and 2-pralidoxime (25 mg/kg, im) went into SE that persisted for hours. One day after acute DFP-induced SE, plasmin activity and protein concentrations of plasminogen activator inhibitor-1 (PAI-1) in the plasma were increased, though not significantly. In contrast, acute DFP intoxication significantly increased brain levels of PAI-1, tissue-type plasminogen activator (tPA), urokinase plasminogen activator (uPA), and transcripts of TGF-β in a time- and region-dependent manner. In the cortex and hippocampus, quantification of PAI-1, tPA, and uPA by ELISA indicated significantly increased levels at 1 day post-exposure (DPE). PAI-1 and uPA returned to control values by 7 DPE while tPA protein remained elevated at 28 DPE. Immunohistochemistry detected elevated PAI-1 expression in the DFP brain up to 28 DPE. Co-localization of PAI-1 with biomarkers of neurons, microglia, and astrocytes demonstrated that PAI-1 localized predominantly to a subpopulation of astrocytes. Cytologically, PAI-1 localized to astrocytic end feet, but not adjacent neurovascular endothelium. Electron microscopy revealed neuronal metabolic stress and neurodegeneration with disruption of adjacent neurovascular units in the hippocampus post-DFP exposure. These data indicate that acute DFP intoxication altered PAS expression in the brain, with aberrant PAI-1 expression in a subset of reactive astrocyte populations.

Keywords: Blood-brain barrier; Diisopropylfluorophosphate; Epilepsy; Neuroinflammation; Plasminogen activator inhibitor-1 (PAI-1).


Conflict of interest statement

Declarations. Ethics approval: Animals were maintained in facilities fully accredited by the Association for Assessment and Accreditation of Laboratory Animal Care (AAALAC), and all studies were performed with regard to the alleviation of pain and suffering under protocols approved by the UC Davis Institutional Animal Care and Use Committee (IACUC protocol numbers 201865, 201954). Animal experiments were conducted in accordance with ARRIVE guidelines and the National Institutes of Health Guide for the Care and Use of Laboratory Animals. Consent to Publish: Not applicable; no human subjects involved. Competing interests: The authors declare no competing interests.

Figures

Fig. 1
Fig. 1
Rat model of acute diisopropylflurophosphate (DFP) intoxication (a) Schematic of the dosing paradigm used to initiate DFP-induced seizures in adult male Sprague Dawley rats and timeline of sample collection. (b) Behavioral seizure scale used to score seizure behavior in DFP-intoxicated rats. (c) Profile of seizure scores in DFP and vehicle (VEH) animals. Data presented as mean ± SE (n = 38 DFP and 19 VEH)
Fig. 2
Fig. 2
Acute DFP intoxication altered plasmin activity in plasma (a) Active plasmin enzymatic content normalized to total plasma protein in VEH (white, n = 3–5) and DFP (grey, n = 3–5) animals at varying DPE. Data are presented as box plots in which dots represent individual animals; the box plot bounds, the interquartile range (IQR); the horizontal line in each box, the median; and the whiskers extend to the last observation within 1.5 x the IQR. (b) Geometric mean ratios (GMR, dot) and 95% CI (bar) of normalized plasmin activities in plasma from DFP vs. VEH animals at specific DPE. If the 95% CI crosses the horizontal line at 1.0, there was no significant difference between DFP and VEH animals
Fig. 3
Fig. 3
Temporal profile of DFP effects on plasma PAI-1 levels (a) Plasma PAI-1 levels were quantified by ELISA and normalized to total plasma protein. Data are presented as box plots of VEH (white, n = 4–5) and DFP (grey, n = 7–13) animals. Dots represent an individual animal; box plot bounds, the interquartile range (IQR); the horizontal line within the box, the median; and the whiskers extend to the last observation within 1.5 x the IQR. (b) Geometric mean ratio (GMR, dot) and 95% CI (bar) of the total plasma PAI-1 in DFP vs. VEH animals at 1, 3, 7, and 28 DPE. A GMR with a 95% CI that crosses the horizontal line at 1.0 indicates no significant difference. If the 95% CI lies entirely above or below the 1.0 line, there was a significant increase or decrease, respectively, in DFP animals relative to VEH. Blue CIs indicate significant differences between DFP and VEH groups after FDR correction (p < 0.05)
Fig. 4
Fig. 4
Acute DFP intoxication perturbed multiple components of the plasminogen activating system in a time- and region-dependent manner Protein levels of plasminogen activator inhibitor type 1 (PAI-1), tissue plasminogen activator (tPA), and urokinase plasminogen activator (uPA) in various brain regions were quantified by ELISA and normalized to total protein content. (a, b) PAI-1, (c, d) tPA, and (e, f) uPA protein levels in the cerebellum, cortex and hippocampus of VEH (white, n = 3–4) and DFP (grey, n = 7–9) animals at varying DPE. (a, c, e) Data are presented as box plots where dots represent individual animals; box plot bounds, the interquartile range (IQR); the horizontal line in the box, the median; and the whiskers extend to the last observation within 1.5x the IQR. * Indicates a significant difference in protein level between treatment groups at the same time point, as determined by mixed-effects analysis and FDR correction (p < 0.05). (b, d, f) Geometric mean ratios (GMR, dot) and 95% CI (bar) of normalized PAI-I, tPA or uPA levels in DFP vs. VEH brains at specific DPE. If the 95% CI crosses the horizontal line at 1.0 there was no significant difference between DFP and VEH animals. Blue CIs indicate a statistically significant difference between DFP and VEH animals. Note that in panel d, differences in tPA levels between groups did not vary significantly by DPE, so an overall estimate of the group differences by brain region is presented
Fig. 5
Fig. 5
Acute DFP intoxication induced PAI-1 expression in multiple brain regions at 28 DPE Representative photomicrographs of PAI-1 (red) immunoreactivity to identify PAI-1 protein in the dentate gyrus (DG), CA1 and CA3 regions of the hippocampus, thalamus (Thal), piriform cortex (Piri), and amygdala (Amy) at 28 DPE. Sections were counterstained with DAPI (blue) to identify cell nuclei. Boxed areas are shown at higher magnification in the image below. Low magnification bars = 200 μm, high magnification bars = 20 μm
Fig. 6
Fig. 6
Acute DFP intoxication induced PAI-1 expression in astrocytic sub-populations (a) Representative confocal photomicrographs of PAI-1 (red) and GFAP (green) immunoreactivity in the dentate gyrus of a VEH animal at 1 DPE and DFP animals at 1, 3, 7 and 28 DPE. Sections were counterstained with DAPI (blue) to identify cell nuclei. Bar = 20 μm. Arrows indicate PAI-1 positive staining in astrocytic cell bodies and processes. (b) Geometric mean ratio (GMR, dot) and 95% CI (bar) of PAI-1 and GFAP colocalization in DFP (n = 10–12) vs. VEH (n = 10–12) animals, as determined by high content image analysis. Differences between groups did not vary by brain region; therefore, overall differences between groups are presented as a function of DPE. If the 95% CI falls entirely above or below the horizontal line at 1.0, there was a significant increase or decrease, respectively, between DFP and VEH animals. CIs in blue indicate significant difference between DFP and VEH animals at p < 0.05 after FDR correction
Fig. 7
Fig. 7
PAI-1 expression was localized to specific cell types in the brain of DFP-intoxicated animals (a) Representative photomicrographs of PAI-1 (red) and CD31 (green) immunoreactivity in the hippocampus of a DFP-intoxicated animal at 1 DPE. Sections were counterstained with DAPI (blue) to identify cell nuclei. Bar = 20 μm. (b) A higher magnification image of (a). Arrows indicate PAI-1 immunoreactivity is adjacent to but not present within arteriolar blood vessels (arrowhead). (c-f) Representative photomicrographs of PAI-1 (red) immunoreactivity and aquaporin 4 (AQP4, green) immunoreactivity. AQP4 identifies astrocytic end feet on the abluminal surface of vessels in a VEH (c, e) and DFP (d, f) animal at 1 and 28 DPE
Fig. 8
Fig. 8
DFP induced cellular damage in the hippocampus Transmission electron micrographs of the dentate gyrus in VEH or DFP at 1 DPE (DFP’: same animal, different region of hippocampus). Intra-myelinic edema (Ie; middle lower panel) was noted in the DFP brain compared to a time matched VEH control. Astrocytic mitochondria (m) in the DFP brain exhibited loss of cristae resolution not seen with the VEH control. Astrocytes in the DFP animal also presented swollen astrocytic end feet and edema. There were no signs of endothelial damage or loss of tight junctions in DFP or VEH tissue. LU, vascular lumen; P, pericyte; ef, end feet
Fig. 9
Fig. 9
Acute DFP intoxication upregulated TGF-β transcripts in the brain as determined by qPCR TGF-β mRNA was quantified in the hippocampus (a) and cortex (b) of DFP animals at 1, 3, 7 and 28 DPE (n = 2–3) and normalized to TGF-β levels in the corresponding brain regions of VEH animals at 1 DPE (n = 2). Data are presented as box and whisker plots in which squares represent individual animals; the ends of the whiskers, the minimum and maximum values; and the horizontal line in the box, the median. The dashed line at y = 1 represents the baseline value from 1 DPE VEH animals

Similar articles

References

    1. Newmark J (2019) Therapy for acute nerve agent poisoning: an update. Neurol Clin Pract 9:337–342. 10.1212/CPJ.0000000000000641 - PMC - PubMed
    1. Chen Y (2012) Organophosphate-induced brain damage: mechanisms, neuropsychiatric and neurological consequences, and potential therapeutic strategies. Neurotoxicology 33:391–400. 10.1016/j.neuro.2012.03.011 - PubMed
    1. Chuang C-S, Yang K-W, Yen C-M, Lin C-L, Kao C-H (2019) Risk of seizures in patients with organophosphate poisoning: A nationwide Population-Based study. Int J Environ Res Public Health 16:3147. 10.3390/ijerph16173147 - PMC - PubMed
    1. Loh Y, Swanberg MM, Ingram MV, Newmark J (2010) Case report: Long-term cognitive sequelae of sarin exposure. Neurotoxicology 31:244–246. 10.1016/j.neuro.2009.12.004 - PubMed
    1. Ohbu S, Yamashina A, Takasu N, Yamaguchi T, Murai T et al (1997) Sarin poisoning on Tokyo subway. South Med J 90:587–593. 10.1097/00007611-199706000-00002 - PubMed

Publication types

MeSH terms