. 2025 Mar 18;21(1):7.
doi: 10.1186/s12993-025-00271-4.

Improving effects of melatonin on memory and synaptic potentiation in a mouse model of Alzheimer's-like disease: the involvement of glutamate homeostasis and mGluRs receptors

Affiliations

Improving effects of melatonin on memory and synaptic potentiation in a mouse model of Alzheimer's-like disease: the involvement of glutamate homeostasis and mGluRs receptors

Narjes Khatoun Shabani Sadr et al. Behav Brain Funct. .

Abstract

Background: Alzheimer's disease (AD) is characterized by progressive cognitive decline and synaptic dysfunction, largely driven by amyloid plaques and neurofibrillary tangles (NFTs) composed of hyperphosphorylated tau. These pathological hallmarks disrupt glutamate signaling, which is essential for synaptic plasticity and memory consolidation. This study investigates the therapeutic potential of melatonin on memory and synaptic plasticity in an AD-like mouse model, with a focus on its regulatory effects on glutamate homeostasis and metabotropic glutamate receptors (mGluRs).

Methods: The study began with an in-silico bioinformatics analysis of RNA-seq datasets from hippocampal tissues of AD patients to identify differentially expressed genes (DEGs) related to glutamate signaling and tau pathology. An AD-like model was induced via intra-hippocampal injection of cis-phospho tau in C57BL/6 mice. Memory function was assessed using behavioral tests. Synaptic plasticity was evaluated using in vitro field potential recording of hippocampal slices. Histological analyses included Nissl staining for neuronal density, Luxol Fast Blue for myelin integrity, and immunofluorescence for tau hyperphosphorylation. Molecular studies employed qPCR and Western blot to assess glutamate-related markers and tau phosphorylation. Melatonin (10 mg/kg) was administered intraperitoneally, starting either two weeks (early intervention) or four weeks (late intervention) post-induction.

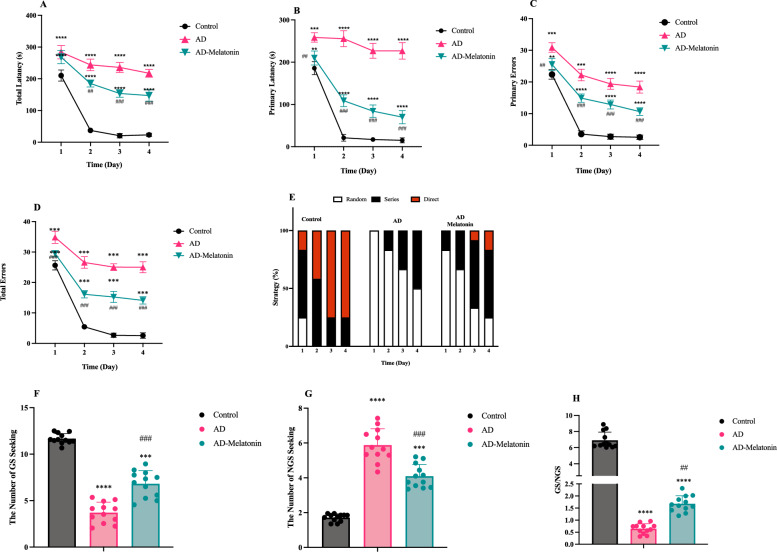
Results: Key molecular targets in glutamate signaling pathways were identified using bioinformatics. AD-like mice displayed memory deficits and synaptic dysfunction. Melatonin improved cognitive function, especially with early intervention, as confirmed by behavioral tests. Histological studies revealed reduced neuronal loss, improved myelin integrity, and decreased tau hyperphosphorylation. Molecular findings showed restored mGluR expression and reduced GSK3 activity. Early intervention yielded superior outcomes, with partial restoration of synaptic plasticity observed in LTP recordings.

Conclusions: These findings underscore the neuroprotective properties of melatonin, mediated by its ability to modulate glutamate signaling and mGluR activity, offering new insights into its potential as a therapeutic agent for AD. Additionally, the results suggest that earlier administration of melatonin may significantly enhance its efficacy, highlighting the importance of timely intervention in neurodegenerative diseases.

Keywords: Alzheimer's disease; Cis-phospho tau; Glutamate signaling; Melatonin; Memory; Metabotropic glutamate receptors; Synaptic plasticity.


Conflict of interest statement

Declarations. Ethics approval and consent to participate: All experiments were conducted following the Guidelines for the care and use of laboratory animals and approved by the “Ethics Committee of Tarbiat Modares University” (IR.MODARES.REC.1400.217). Consent for publication: Not applicable Competing interests: The authors declare no competing interests.

Figures

Fig. 1
Fig. 1
Transcriptome analysis and gene expression changes in the hippocampus of AD patients. A Volcano plot depicting gene expression changes. The x-axis represents log2 fold change (log2FC), and the y-axis represents the p-value. Genes with −0.5 ≤ log2FC ≤ 0.5 and p-value ≥ 0.05 are considered significant. Blue dots on the right indicate increased expression, while dots on the left indicate decreased expression in AD samples. Red dots represent GPCR genes outside the specified range. This plot was generated using the ggplot2 package in R. B Principal Component Analysis (PCA) graph illustrating differences between control and AD samples based on gene expression. C Heatmap showing significant expression changes in genes involved in the glutamatergic system. Each row on the Y-axis represents a single gene, and dendrograms represent genes with similar expressions. The X-axis represents all samples, and the dendrogram clusters control and patient samples. The color gradient from blue to red indicates low to high expression levels. This plot was created using the p-heatmap package in R
Fig. 2
Fig. 2
Improvement of working memory impairment due to melatonin treatment in AD-like animal model. A Working memory assessment pre- and post-melatonin treatment when the melatonin injection (10 mg/kg) was initiated at the 2nd week post-induction. B Working memory assessment pre- and post-melatonin treatment when the melatonin (10 mg/kg) was initiated at the 4th week post-induction. The results represent the average performance of 12 samples per group, indicating observed trends in working memory improvement. *** p < 0.001 compared to control group, ### p < 0.001 compared to AD group
Fig. 3
Fig. 3
Improvement of spatial memory and learning impairment due to melatonin treatment initiated at the 2nd-week post-induction. A Diagram illustrating the circular Barnes maze with 20 equally spaced holes, including the goal sector (GS) and non-goal sector (NGS). BPrimary latency to locate the goal hole. C: Total latency to enter the goal box. D Primary errors during exploration. E Total errors across training days. F Search strategies (direct, serial, and random) adopted by animals across training days. G Goal sector exploration frequency. H Non-goal sector exploration frequency. I Goal sector preference (goal/non-goal exploration ratio). The results represent the average performance of 12 samples per group, and data are presented as mean ± SEM. Statistical significance: *** p < 0.001 compared to the control group, ### p < 0.001 compared to the AD group
Fig. 4
Fig. 4
Reduced improvement in spatial memory and learning impairment due to delayed melatonin treatment initiated at the 4th-week post-induction. A Primary latency to locate the goal hole. B Total latency to enter the goal box. C: Primary errors during exploration. D Total errors across training days. E Search strategies (direct, serial, and random) adopted by animals across training days. F Goal sector exploration frequency. G Non-goal sector exploration frequency. H Goal sector preference (goal/non-goal exploration ratio). The results represent the average performance of 12 samples per group, and data are presented as mean ± SEM. Statistical significance: *** p < 0.001 compared to the control group, ### p < 0.001 compared to the AD group
Fig. 5
Fig. 5
The effect of melatonin on reducing CA1 hippocampal tissue damage in the AD-like model. A Luxol Fast Blue (LFB) staining of the CA1 hippocampal region, illustrating the extent of myelin preservation and demyelination across different experimental groups. LFB is a histological stain that specifically binds to lipoproteins in the myelin sheath, allowing visualization of myelin integrity. Intact myelin appears deep blue, whereas demyelinated or damaged regions show lighter staining or loss of staining. This technique is particularly relevant in neurodegenerative conditions such as AD, where white matter integrity is progressively compromised. B Graph showing the quantitative intensity of LFB staining, representing the average percentage of myelin staining in samples from each group. This provides a comparative assessment of myelin loss and its potential restoration following melatonin treatment. C Nissl staining indicating neuronal death, with arrows pointing to degenerated or pyknotic cells in the CA1 region. C: Nissl staining indicating neuronal death, with arrows pointing to dead cells. D Quantitative analysis of the percentage of dead cells in the CA1 region, with data averaged across the samples in each group. The tissue samples displayed in the histological images include Control animals, an AD-like model with 4 weeks of disorder (AD 4W), and model under melatonin treatment (AD 4W-Melatonin), an AD-like model with 8 weeks of disorder (AD 4W), and model under melatonin treatment (AD 8W-Melatonin). The groups in the graphs are presented as Control animals, AD-like models (AD) with 4 weeks (4W) and 8 weeks (8W) of disorder, and models under melatonin treatment (AD-Melatonin) starting from the second-week post-induction (4W) and starting from the fourth-week post-induction (8W). The symbol * indicates statistically significant differences compared to the Control, and the symbol # compared to the model animals without treatment
Fig. 6
Fig. 6
The effect of melatonin treatment on Gls1, Glul, GSK3, and phosphorylated GSK3 levels in AD-like models. A Western blot for protein quantification in study animals, including Control animals, AD-like model at 4 weeks (AD 4W) and 8 weeks (AD 8W) post-induction, and under melatonin treatment initiated at two different time points. B Gls1-65 KDa protein levels across the experimental groups. C Gls1-58 KDa protein levels, illustrating the relative changes among the groups. D Glul protein levels showing trends of variation in response to melatonin treatment. E GSK3α protein levels across the groups. F GSK3β protein levels, highlighting differences between treated and untreated groups. G Phosphorylated GSK3α levels, indicating changes in kinase activity under melatonin treatment. H Phosphorylated GSK3β levels, showing the effect of treatment on kinase activity. The results were derived from pooled samples, with 5 samples pooled per group. Due to pooling, statistical analysis was not performed, and the data are presented descriptively
Fig. 7
Fig. 7
Positive effect of melatonin treatment on mGluRs expression in the AD-like models. Heat map created from qPCR data reflecting the expression of Grm genes across the study animal groups. Columns represent the studied animal samples, including Control, AD-like models with 4 weeks of disorder (AD 4W) and those under melatonin treatment (AD 4W Melatonin), AD-like models with 8 weeks of disorder (AD 8W), and models under melatonin treatment (AD 8W-Melatonin). Rows represent different Grm genes, including Grm1 and Grm5 related to the mGluR I group, Grm2, and Grm3 related to the mGluR II group, and Grm4, Grm7, and Grm8 related to mGluR III group. The intensity of color corresponds to the relative expression for each gene calculated using 2^−∆Ct. The color gradient from red to white indicates high to low expression levels, reflecting relative gene expression among the different groups. Results are presented as the average values from independent biological samples (n = 5) within each group
Fig. 8
Fig. 8
Melatonin treatment leads to a decrease in tau phosphorylation levels in the AD-Like model. A Immunofluorescence staining for pT231-tau (Green = cis pT231-tau, Blue = DAPI). B Quantitative graph of pT231-tau. Results are presented as the average values from independent biological samples (n = 5) within each group. Groups in the images are Control, AD-like model with 4 weeks of disorder (AD 4W) and under melatonin treatment from the second-week post-induction (AD 4W Melatonin), AD-like model with 8 weeks of disorder (AD 8W) and under melatonin treatment from the fourth-week post-induction (AD 8W Melatonin); and in the graphs as Control animals, AD-like models (AD) with 4 weeks (4W) and 8 weeks (8W) of disorder, and models under melatonin treatment (AD-Melatonin) starting from the second-week post-induction (4W) and starting from the fourth-week post-induction (8W). The symbol * indicates statistically significant differences compared to the Control, and the symbol # compared to model animals without treatment
Fig. 9
Fig. 9
Improvement of long-term potentiation (LTP) generation by melatonin in the AD-like animal model. A Timeline curve showing the impairment in LTP generation in the AD group that was restored when melatonin was injected in the 2nd week, but not in the 4th week, after pT231-tau injection in the AD-Like animal model. B Percentage of LTP induction and maintenance in different experimental groups animal groups. Each group consisted of 6 samples, with 3 technical replicates per sample. * p < 0.05 compared to the Control group
Fig. 10
Fig. 10
Illustration of the molecular pathways involved in glutamate homeostasis and signaling through metabotropic glutamate receptors (mGluRs). The upper panel (A) depicts the synaptic interaction between presynaptic and postsynaptic neurons, highlighting the roles of glutaminase, glutamine synthetase, VGLUT, and EAAT1/2 in glutamate cycling and mGluR-mediated signaling. Group I mGluRs (mGluR1 and mGluR5) activate Gq proteins, leading to the release of intracellular Ca2+ and activation of protein kinase C (PKC). Group II mGluRs (mGluR2 and mGluR3) couple to Gi/o proteins, which inhibit adenylate cyclase, reducing cAMP levels and protein kinase A (PKA) activity, thus protecting neurons from excitotoxicity. Group III mGluRs (mGluR4, mGluR6, mGluR7, and mGluR8) also couple to Gi/o proteins, further inhibiting glutamate release. The lower panel (B) outlines the intracellular signaling cascades triggered by the activation of these mGluRs, detailing the involvement of key molecules such as PLCβ, PKC, PKA, and GSK3β, which are critical for synaptic plasticity and memory functions. Early melatonin intervention modulates these pathways, reducing glutamate toxicity and ameliorating cognitive deficits in AD models. This picture was created by Bio Render

Similar articles

Cited by

References

    1. Colom-Cadena M, Davies C, Sirisi S, Lee J-E, Simzer EM, Tzioras M, et al. Synaptic oligomeric tau in Alzheimer’s disease — A potential culprit in the spread of tau pathology through the brain. Neuron. 2023; https://linkinghub.elsevier.com/retrieve/pii/S0896627323003057 - PubMed
    1. Young-Pearse TL, Lee H, Hsieh Y-C, Chou V, Selkoe DJ. Moving beyond amyloid and tau to capture the biological heterogeneity of Alzheimer’s disease. Trends Neurosci. 2023;46:426–44. - PMC - PubMed
    1. Simons M, Levin J, Dichgans M. Tipping points in neurodegeneration. Neuron. 2023. - PubMed
    1. Cox MF, Hascup ER, Bartke A, Hascup KN. Friend or Foe? Defining the Role of Glutamate in Aging and Alzheimer’s Disease. Front Aging. 2022. 10.3389/fragi.2022.929474/full. - PMC - PubMed
    1. Wang R, Reddy PH. Role of Glutamate and NMDA Receptors in Alzheimer’s Disease. J Alzheimer’s Dis. 2017;57:1041–8. 10.3233/JAD-160763. - PMC - PubMed

MeSH terms

LinkOut - more resources