Identifying behavior regulatory leverage over mental disorders transcriptomic network hubs toward lifestyle-dependent psychiatric drugs repurposing
- PMID: 40102990
- PMCID: PMC11921594
- DOI: 10.1186/s40246-025-00733-w
Identifying behavior regulatory leverage over mental disorders transcriptomic network hubs toward lifestyle-dependent psychiatric drugs repurposing
Abstract
Background: There is a vast prevalence of mental disorders, but patient responses to psychiatric medication fluctuate. As food choices and daily habits play a fundamental role in this fluctuation, integrating machine learning with network medicine can provide valuable insights into disease systems and the regulatory leverage of lifestyle in mental health.
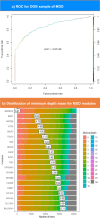
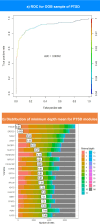
Methods: This study analyzed coexpression network modules of MDD and PTSD blood transcriptomic profile using modularity optimization method, the first runner-up of Disease Module Identification DREAM challenge. The top disease genes of both MDD and PTSD modules were detected using random forest model. Afterward, the regulatory signature of two predominant habitual phenotypes, diet-induced obesity and smoking, were identified. These transcription/translation regulating factors (TRFs) signals were transduced toward the two disorders' disease genes. A bipartite network of drugs that target the TRFS together with PTSD or MDD hubs was constructed.
Results: The research revealed one MDD hub, the CENPJ, which is known to influence intellectual ability. This observation paves the way for additional investigations into the potential of CENPJ as a novel target for MDD therapeutic agents development. Additionally, most of the predicted PTSD hubs were associated with multiple carcinomas, of which the most notable was SHCBP1. SHCBP1 is a known risk factor for glioma, suggesting the importance of continuous monitoring of patients with PTSD to mitigate potential cancer comorbidities. The signaling network illustrated that two PTSD and three MDD biomarkers were co-regulated by habitual phenotype TRFs. 6-Prenylnaringenin and Aflibercept were identified as potential candidates for targeting the MDD and PTSD hubs: ATP6V0A1 and PIGF. However, habitual phenotype TRFs have no leverage over ATP6V0A1 and PIGF.
Conclusion: Combining machine learning and network biology succeeded in revealing biomarkers for two notoriously spreading disorders, MDD and PTSD. This approach offers a non-invasive diagnostic pipeline and identifies potential drug targets that could be repurposed under further investigation. These findings contribute to our understanding of the complex interplay between mental disorders, daily habits, and psychiatric interventions, thereby facilitating more targeted and personalized treatment strategies.
Keywords: Depression; Drug repurposing; Machine learning; Mental disorders; Network biology; Obesity; PTSD; Signal transduction; Smoking; Unhealthy food.
© 2025. The Author(s).
Conflict of interest statement
Declarations. Ethics approval and consent to participate: This is an observational study. The Institutional Animal Care & Use Committee (IACUC) Cairo University has confirmed that no ethical approval is required. Consent for publication: Not applicable. Competing interests: The authors declare that they have no competing interest.
Figures


Similar articles
-
Exploring gene regulatory interaction networks and predicting therapeutic molecules among major depressive disorder and bipolar disorder: A bioinformatics approach.J Affect Disord. 2025 Apr 15;375:64-74. doi: 10.1016/j.jad.2025.01.078. Epub 2025 Jan 17. J Affect Disord. 2025. PMID: 39828023
-
Integration of peripheral transcriptomics, genomics, and interactomics following trauma identifies causal genes for symptoms of post-traumatic stress and major depression.Mol Psychiatry. 2021 Jul;26(7):3077-3092. doi: 10.1038/s41380-021-01084-3. Epub 2021 May 7. Mol Psychiatry. 2021. PMID: 33963278
-
Transcriptome analysis reveals novel genes and immune networks dysregulated in veterans with PTSD.Brain Behav Immun. 2018 Nov;74:133-142. doi: 10.1016/j.bbi.2018.08.014. Epub 2018 Sep 4. Brain Behav Immun. 2018. PMID: 30189241
-
Beyond modules and hubs: the potential of gene coexpression networks for investigating molecular mechanisms of complex brain disorders.Genes Brain Behav. 2014 Jan;13(1):13-24. doi: 10.1111/gbb.12106. Epub 2013 Dec 10. Genes Brain Behav. 2014. PMID: 24320616 Free PMC article. Review.
-
Exploring the potential mechanism of Kaixinsan powder for the same pathogenesis of PTSD and anxiety based on network pharmacology and molecular docking: A review.Medicine (Baltimore). 2023 Nov 17;102(46):e35869. doi: 10.1097/MD.0000000000035869. Medicine (Baltimore). 2023. PMID: 37986356 Free PMC article. Review.
References
-
- Mental disorders. [cited 2024 Feb 7]; Available from: https://www.who.int/news-room/fact-sheets/detail/mental-disorders
-
- Mental health of older adults. [Internet]. [cited 2024 Feb 7]. Available from: https://www.who.int/news-room/fact-sheets/detail/mental-health-of-older-...
-
- Depressive disorder (depression). [Internet]. [cited 2024 Feb 7]. Available from: https://www.who.int/news-room/fact-sheets/detail/depression
-
- Mental Health and COVID-19: Early evidence of the pandemic’s impact: Scientific brief. [cited 2024 Feb 7]; Available from: https://www.who.int/publications/i/item/WHO-2019-nCoV-Sci_Brief-Mental_h...
MeSH terms
LinkOut - more resources
Full Text Sources
Medical
Research Materials

