. 2025 May 27;43(6):sxaf010.
doi: 10.1093/stmcls/sxaf010.

SARS-CoV2 infection triggers inflammatory conditions and astrogliosis-related gene expression in long-term human cortical organoids

Affiliations

SARS-CoV2 infection triggers inflammatory conditions and astrogliosis-related gene expression in long-term human cortical organoids

Mathilde Colinet et al. Stem Cells. .

Abstract

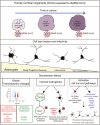
SARS-CoV2, severe acute respiratory syndrome coronavirus 2, is frequently associated with neurological manifestations. Despite the presence of mild to severe CNS-related symptoms in a cohort of patients, there is no consensus whether the virus can infect directly brain tissue or if the symptoms in patients are a consequence of peripheral infectivity of the virus. Here, we use long-term human stem cell-derived cortical organoids to assess SARS-CoV2 infectivity of brain cells and unravel the cell-type tropism and its downstream pathological effects. Our results show consistent and reproducible low levels of SARS-CoV2 infection of astrocytes, deep projection neurons, upper callosal neurons, and inhibitory neurons in 6 months of human cortical organoids. Interestingly, astrocytes showed the highest infection rate among all infected cell populations which led to changes in their morphology and upregulation of SERPINA3, CD44, and S100A10 astrogliosis markers. Further, transcriptomic analysis revealed overall changes in expression of genes related to cell metabolism, astrogliosis and, inflammation and further, upregulation of cell survival pathways. Thus, local and minor infectivity of SARS-CoV2 in the brain may induce widespread adverse effects and lead to the resilience of dysregulated neurons and astrocytes within an inflammatory environment.

Keywords: SARS-CoV2 brain infectivity; astrogliosis; human cortical organoids; inflammatory and cell survival mechanisms.


Conflict of interest statement

The authors declare no competing interests.

Figures
Graphical Abstract
Graphical Abstract
Figure 1.
Figure 1.
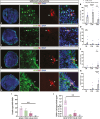
SARS-CoV2 infects human cortical organoids at different stages in vitro. (A) Schematic illustration of the procedure followed for derivation of human cortical organoids of different stages in vitro (2M, 3.5M, and 5-6M), hCO infection by SARS-CoV2 viral particles, and subsequent analysis. Created with BioRender.com. (B-G) Tile-Scan (B,D,F) and single (C,E,G) confocal images of cryosections immunostained for the SARS-CoV2 antigen nucleocapside (NC) in 72 hours SARS-CoV2 post-infection hCOs at all time points (2M, 3.5M, 5-6M). (H-I) Tile-Scan (H) and single (I) light-sheet microscope images of clarified (CUBIC) 72 hours SARS-CoV2 post-infected hCOs and immunostained for NC at 6M. Counterstaining was performed using DAPI. (J) Quantification of the percentage of NC+ cells among the total number of DAPI+ cells, in control (CTRL), 24 hours and 72 hours SARS-CoV2 post-infection hCOs at 2M, 3.5M, and 5-6M in vitro. Data are represented as mean percentages ± SEM (3-4 differentiations: CTRL n = 15-18; 24 hours n = 6-12; 72 hours n = 15-17). Two-way ANOVA with Tukey’s multiple comparison test *P < .05; **P < .01; ****P < .0001. (K) Quantification of the percentage of NC+ cells 72 hours post-infection in whole clarified (CUBIC) 72 hours SARS-CoV2 6M hCOs. Data are represented as mean percentages ± SEM (CTRL n = 4; 72 hours n = 5). Mann-Whitney test *P < .05. (L) Tile-Scan and single immunofluorescence confocal images of the SARS-CoV2 antigen nucleocapside (NC) in CTRL and following MOI 1 SARS-CoV2 infection in 3.5M hCOs. (M) Quantification of the percentage of NC+ cells in CTRL, MOI 0.5, and MOI 1 infected hCOs at 3.5M. Data are represented as mean percentages ± SEM (CTRL n = 7; MOI 0.5 n = 6; MOI 1 n = 3). Kruskal-Wallis with Dunn’s multiple comparison test *P < .05; **P < .01. (N) Expression levels (mean log) of SARS-CoV2 receptors and co-receptors (in green), and of SARS-CoV2 viral entry-related proteases (in orange) in 6M hCOs (n = 4) from bulk RNAseq. Data are represented as mean ± SEM. Scale bars: 100 µm (B,D,F,L); 50 µm (C,E,G); 300 µm (H) and 40 µm (I).
Figure 2.
Figure 2.
SARS-CoV2 infects mostly astrocytes at late stages in hCOs. (A,C,E,G) Tile-Scan (left panel) and single confocal images of cryosections immunostained for the SARS-CoV2 antigen nucleocapside (NC) and the deep layer cortical neuronal marker CTIP2 (A); the upper layer cortical neuronal marker CUX1 (C); the interneuron marker calbindin (E), or the astrocyte marker GFAP (G) in 6M 72h post-infection hCOs, and high magnification insets. Counterstaining was performed using DAPI. (B,D,F,H) Quantification of the percentage of double-positive CTIP2 + NC + (B); CUX1 + NC + (D); CALB + NC + (F); GFAP + NC + (H), among the total NC + population in 2M, 3.5M, and 5-6M 72h post-infected SARS-CoV2 hCOs compared to control (CTRL). Data are represented as mean percentages ± SEM (2-3 differentiations: CTRL n = 8-20; 72 hours n = 11-20). Two-way ANOVA with Tukey’s multiple comparison test *P < .05; **P < .01; ****P < .0001. (I) Percentage of specific cell types double positive for NC among the total NC+ population in 5-6M 72 hours post-infected SARS-CoV2 hCOs. Data are represented as mean percentages ± SEM (3-4 differentiations: 72 hours n = 14-16). Two-way ANOVA with Tukey’s multiple comparison test **P < .01. (J) Percentage of NC + infected cell type among the total number of the cell type-specific population in 5-6M 72 hours post-infected SARS-CoV2 hCOs. Data are represented as mean percentages ± SEM (3-4 differentiations: 72 hours n = 15-20. Two-way ANOVA with Tukey’s multiple comparison test *P < .05; **P < .01. Scale bars: 100 µm (A,C,E,G). White arrows show cells double positive for NC and the specific cell-type marker tested (A,C,E,G).
Figure 3.
Figure 3.
SARS-CoV2 infectivity does not induce cell death in hCOs. (A-F) Tile-Scan and single confocal images of cryosections immunostained for the apoptotic marker caspase 3 (CASP3) + cells and either the SARS-CoV2 antigen NC; the cortical layer V marker CTIP2; or the astrocyte marker VIM in 5-6M CTRL and 72 hours post-infected hCOs and high magnification pics (insets). Counterstaining was done with DAPI. (G-I) Quantification of the percentage of CASP3 + cells among the total number of cells DAPI + in CTRL and 24 hours post-infected hCOs (G), in CTRL and 72 hours post-infected hCOs (H), or in CTRL, MOI 0.5 and MOI 1 (I) infected hCOs. Data are represented as mean percentages ± SEM (1-3 differentiations: 2M n = 12-18; 3.5M n = 3-16; 5-6M n = 6-15). Two-way ANOVA with Sidak’s multiple comparison test (G-H) and one way ANOVA with Tukey’s multiple comparison test (I). (J) Quantification of the percentage of double positive cells CASP3 + NC+ among the NC + population. Data are represented as mean percentages ± SEM (3 differentiations: 2M n = 17-18; 3.5M n = 13-16; 5-6M n = 15). Two-way ANOVA with Tukey’s multiple comparison test, ns: non-significant. (K-L) Quantification of the percentage of double positive cells CASP3 + CTIP2 + among CASP3 (K), and CASP3 + VIM + among CASP3 + (L) at all stages. Data are represented as mean percentages ± SEM (1 differentiation: 2M n = 6; 3.5M n = 5; 5-6M n = 5). (G-K) Two-way ANOVA with Sidak’s multiple comparison test, ns = non-significant. (M-O) Quantification of the cell density (number of DAPI cells per mm²) in CTRL and 24 hours (M), CTRL and 72 hours (N), or in CTRL, MOI 0.5 and MOI 1 infected hCOs (O). (M-N) Data are represented as mean percentages ± SEM (3 differentiations: 2M n = 12-17; 3.5M n = 6-17; 5-6M n = 12-17). Two-way ANOVA with Sidak’s multiple comparison test. ns: non-significant. (O) Data are represented as mean percentages ± SEM (1 differentiation: CTRL n = 7; MOI 0.5 n = 6; MOI 1 n = 3). One-way ANOVA test with Tukey’s multiple comparison test ns: non-significant. Scale bars: 100µm (A-F).
Figure 4.
Figure 4.
SARS-CoV2 virus infects different brain regional identity BOs in vitro. (A-F) Tile-Scan (A,C,E) and single (B,D,F) confocal images of cryosections immunostained for the SARS-CoV2 antigen nucleocapside (NC) in 72h MGE BOs (A-B), THL BOs (C-D), and CRB BOs (E-F) at 2M. Counterstaining was performed using DAPI. (G) Quantification of the percentage of NC + cells among the total number of cells DAPI+ in CTX hCOs, MGE BOs, CRB Bos, and THL BOs. Data are represented as mean percentages ± SEM (CTX n = 17; MGE n = 4; CRB n = 6; THL n = 6). Kruskal-Wallis test with Dunn’s multiple comparison test. *P < .05; **P < .01. (H) Quantification of the relative percentage of CASP3+ cells among the total number of cells DAPI+ in SARS-CoV2 infected CTX hCOs, MGE BOs, CRB Bos, and THL BOs compared to CTRL CTX hCOs, MGE BOs, CRB Bos, and THL BOs expressed as 1. Data are represented as normalized mean percentage ± SEM (CTX n = 17; MGE n = 4; CRB n = 6; THL n = 6). Kruskal-Wallis test with Dunn’s multiple comparison test. Data were normalized by the mean value of control hCOs samples, ns: non-significant. Scale bars: 100µm (A-F).
Figure 5.
Figure 5.
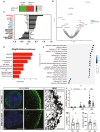
SARS-CoV2 infection leads to astrocyte morphological changes and overall pro-inflammatory transcriptomic changes in hCOs. (A) Heatmap representation of SARS-CoV2 normalized counts in CTRL or 72 hours SARS-CoV2 post-infected 5-6M hCOs. (B) Volcano plot representation of the changes in genes expression (DEG) in 5-6M 72h SARS-CoV2 post-infection hCOs compared to CTRL hCOs, representing the Log2foldChange (log2FC) and the Padj value (−log10FDR). Genes with a Padj value below 0.05 and with a negative Log2foldChange are represented in blue (downregulated genes), and genes with a Padj value below.05 with a positive Log2foldChange are represented in red (upregulated). Genes that have a Padj value above.05 are represented in grey (non-significantly changed). (C) Bar graph representation of the log fold change (lfc) of the differentially expressed genes in 72 hours post-infected hCOs compared to CTRL hCOs. In red: Astrocyte-mediated inflammatory genes; in green: lipid metabolism-related genes; in blue: cell survival-related genes. (D) Representation of the top pathways from MSigDB Hallmark pathways database based on the significance of enrichment of upregulated and downregulated DEGs. (E) Bubble plot of the Gene Set Enrichment Analysis (GSEA) representing the enriched pathways with a Padj value < .0001. Pathways that have a normalized enrichment score (NES) positive > 0 are upregulated whereas pathways with a NES negative < 0 are downregulated. Pathways were ordered by the NES score in a decreasing manner. Size represented the number of genes from the RNAseq presented in the pathway. All data were generated from bulk RNAseq analysis of 2 independent differentiations (CTRL n = 4; 72 hours n = 4). *P < .05; **P < .01; ***P < .001; ****P < .0001. (F-K) Tile-Scan (F-I) and single (J-K) confocal images of cryosections immunostained for the astrocyte marker GFAP (F-K) in 5-6M CTRL and 72 hours post-infected hCOs. Counterstaining was performed using DAPI. (L) Percentage of organoid area covered by GFAP+ cells in CTRL and 72 hours hCOs of 2M, 3.5M, and 5-6M. Data are represented as mean percentages ± SEM (2-4 differentiations: 2M n = 6-12; 3.5M n = 6-11; 5-6M n = 12-22). Two-way ANOVA with Sidak’s multiple comparison test **P < .01. (M) Quantification of the percentage of GFAP+ cells among the total number of cells DAPI+ in CTRL and 72 hours post-infected 5-6M hCOs. Data are represented as mean percentages ± SEM (4 differentiations: CTRL n = 23; 72 hours n = 20). Mann-Whitney two-tailed test * P < .05. (N) Quantification of astrocyte area in CTRL and 72 hours post-infected 5-6M hCOs. Data are represented as mean percentages ± SEM, (4 differentiations: CTRL n = 22 organoids; 72 hours n = 22 organoids). Mann-Whitney two-tailed test * p < .05. Scale bars 500 µm (F-G); 100 µm (H-I); 25 µm (J-K). Red arrows show examples of representative astrocytes (E,F).
Figure 6.
Figure 6.
Increased expression of astrogliosis-related markers and pro-survival genes in infected hCOs. (A-B,D-E,G-H,J-K) Tile-Scan and single confocal images of cryosections immunostained for the astrogliosis marker SERPINA3 (A-B), the pro-survival gene SOD2 (D-E, G-H), the astrocyte marker GFAP (G-H), and the DNA double-strand break marker gamma H2AX (J-K) in 5-6M CTRL and 72 hours post-infected hCOs. Counterstaining was performed using DAPI. White arrows show cells double positive for SOD2 and GFAP (H). (C,F,I,L) Quantifications of the percentage of SERPINA3+ (C), SOD2+ (F), SOD2+GFAP + (I) and gamma H2AX+ (L) cells over the total number of DAPI+ in control and 72 hours post-infected 5-6M hCOs. Data are represented as mean percentages ± SEM (4 differentiations: CTRL n = 20; 72 hours n = 20). (C,F) Mann-Whitney test **P < .01; ***P < .001 (I) Mann-Whitney test **P < .01. (L) Two-tailed t-test *P < .05. (M) Western blot detection of SERPINA3 and β-actin levels from protein extracts of CTRL and 72 hours infected hCOs. MW for SERPINA3 is approximately. 52 and 60 kDa. Quantification of the levels of SERPINA3 in CTRL and 72 hours post-infected hCOs normalized with β-actin levels. Data are represented as mean value ± SEM (2 differentiations, 3 replicates (n = 8 organoids/sample). T-test *P < .05. Data were normalized by the mean value of control hCOs samples. Scale bars: 500 µm (A-K) and 50 µm (higher magnification views on the right).
Figure 7.
Figure 7.
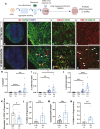
Long-stage post-infected hCOs show changes in GFAP hCO coverage and upregulation of CD44 and S100A10 astrogliosis markers. (A) Schematic illustration of the procedure followed for hCO infection by SARS-CoV2 and analysis after long-stage post-infection (2 weeks). Created with BioRender.com. (B-G) Tile-Scan (B-C) and single (D-G) confocal images of cryosections immunostained for the SARS-CoV2 antigen nucleocapside (NC; B-C) and GFAP (B-E), CD44 (D-E), VIM (F-G) and S100A10 (F-G) in LS SARS-CoV2 post-infected hCOs of 6M. Counterstaining was performed using DAPI. (H-J) Quantification of the percentage of NC + cells (H), the percentage of NC + CTIP2+ (I) or NC + GFAP+ (J), among the total number of DAPI+ in control 72 hours (CTRL 72 hours), control LS (CTRL LS), 72 hours SARS-CoV2 post-infected (72 hours) and LS 2weeks post-infected (2W LS) hCOs at 6M in vitro. Data are represented as mean percentages ± SEM (2-4 differentiations: CTRL 72 hours n = 15; CTRL LS n = 11; 72 hours n = 15; 2W LS n = 9). Kruskal-Wallis with Dunn’s multiple comparison test *P < .05; **P < .01; ****P < .0001. (K-L, N) Quantification of GFAP + area (K), the CD44 + area (L), and the S100A10 + area (N) in CTRL LS and 2W LS 6M hCOs. Data are represented as mean percentages ± SEM. (2 differentiations: CTRL LS n = 11; 2W LS n = 9). T-test (K-L), Mann-Whitney two-tailed test (N) *P < .05; **P < .01. (M) Quantification of CD44 + GFAP + cells in CTRL LS and 2W LS 6M hCOs. Data are represented as mean percentages ± SEM. (2 differentiations: CTRL LS n = 11; 2W LS n = 9). Mann-Whitney two-tailed test ***P < .001. Data were normalized by the mean value of control hCOs samples. Scale bars: 100 µm.

References

    1. Zhu N, Zhang D, Wang W, et al.; China Novel Coronavirus Investigating and Research Team. A novel coronavirus from patients with pneumonia in China, 2019. N Engl J Med. 2020;382:727-733. https://doi.org/10.1056/NEJMoa2001017 - DOI - PMC - PubMed
    1. Kuba K, Imai Y, Rao S, et al.A crucial role of angiotensin converting enzyme 2 (ACE2) in SARS coronavirus-induced lung injury. Nat Med. 2005;11:875-879. https://doi.org/10.1038/nm1267 - DOI - PMC - PubMed
    1. Ding Y, He L, Zhang Q, et al.Organ distribution of severe acute respiratory syndrome (SARS) associated coronavirus (SARS-CoV) in SARS patients: implications for pathogenesis and virus transmission pathways. J Pathol. 2004;203:622-630. https://doi.org/10.1002/path.1560 - DOI - PMC - PubMed
    1. Puelles VG, Lütgehetmann M, Lindenmeyer MT, et al.Multiorgan and renal tropism of SARS-CoV-2. N Engl J Med. 2020;383:590-592. https://doi.org/10.1056/NEJMc2011400 - DOI - PMC - PubMed
    1. Mao L, Jin H, Wang M, et al.Neurologic manifestations of hospitalized patients with Coronavirus Disease 2019 in Wuhan, China. JAMA Neurol. 2020;77:683-690. https://doi.org/10.1001/jamaneurol.2020.1127 - DOI - PMC - PubMed

MeSH terms