. 2025 May 30;66(5):766-780.
doi: 10.1093/pcp/pcaf029.

The phytochrome B signaling regulates salt-mediated seedling growth in the dark

Affiliations

The phytochrome B signaling regulates salt-mediated seedling growth in the dark

Peipei Qi et al. Plant Cell Physiol. .

Abstract

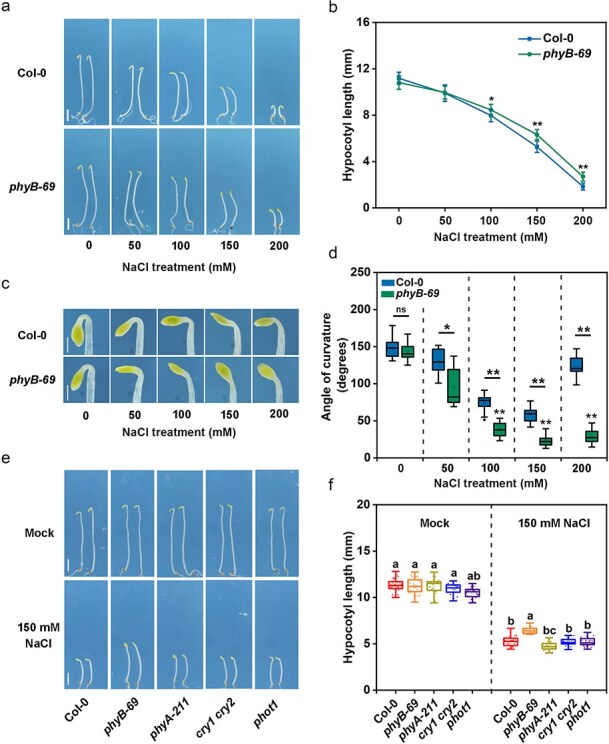
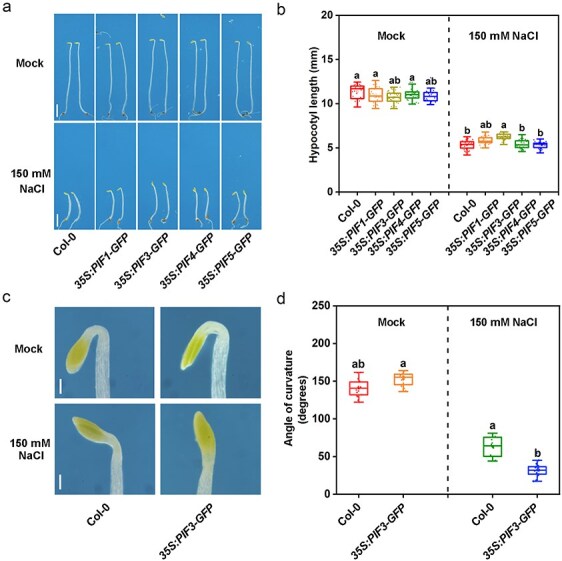
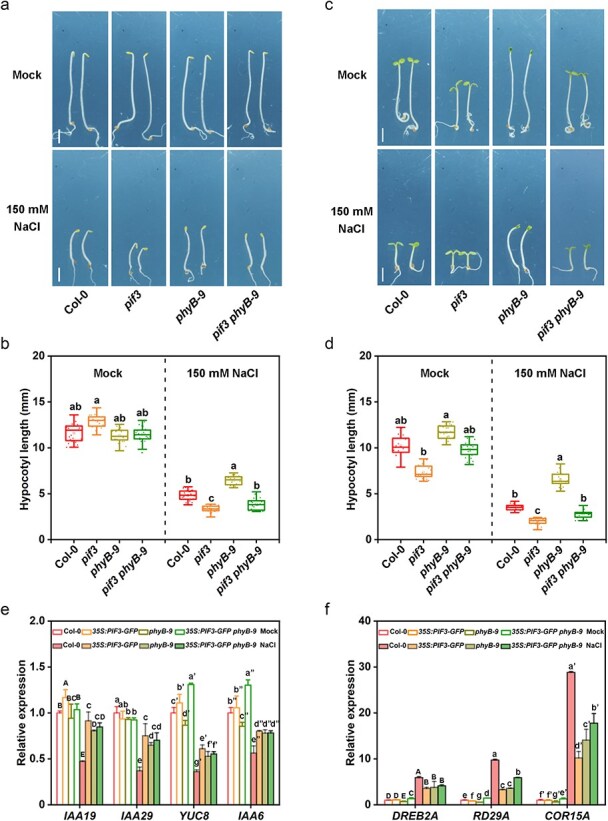
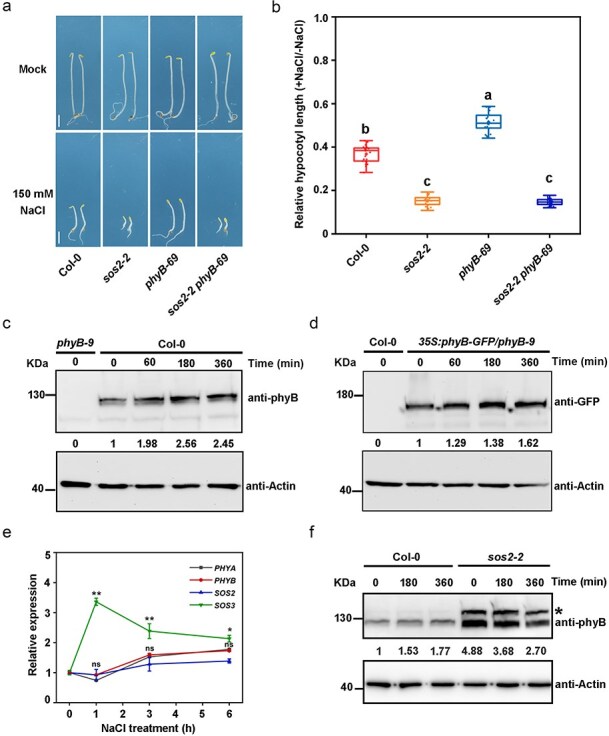
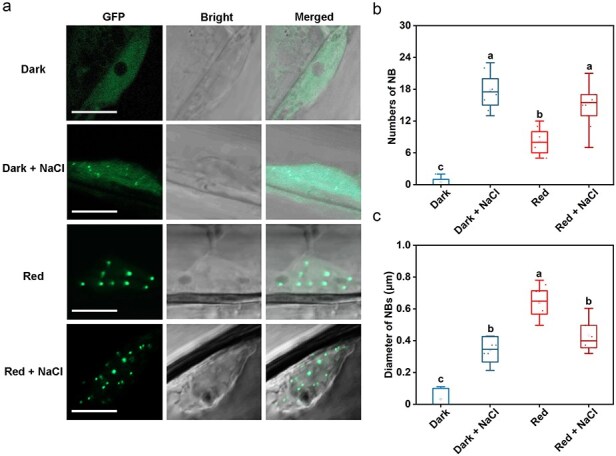
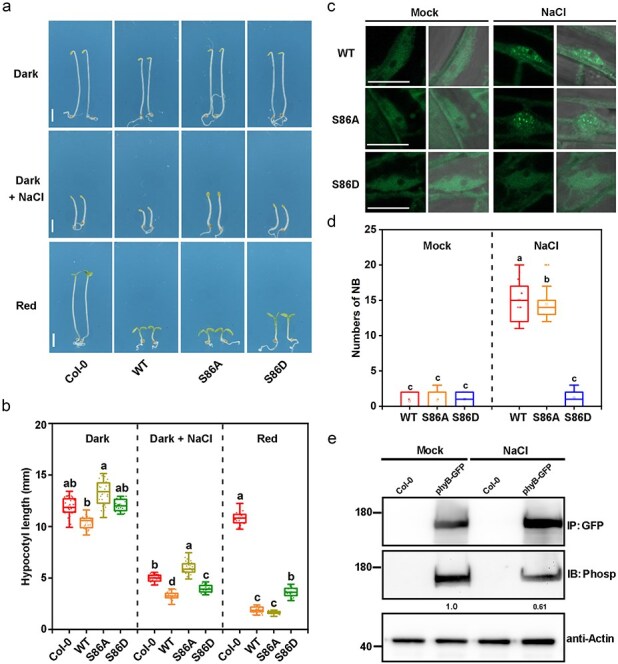
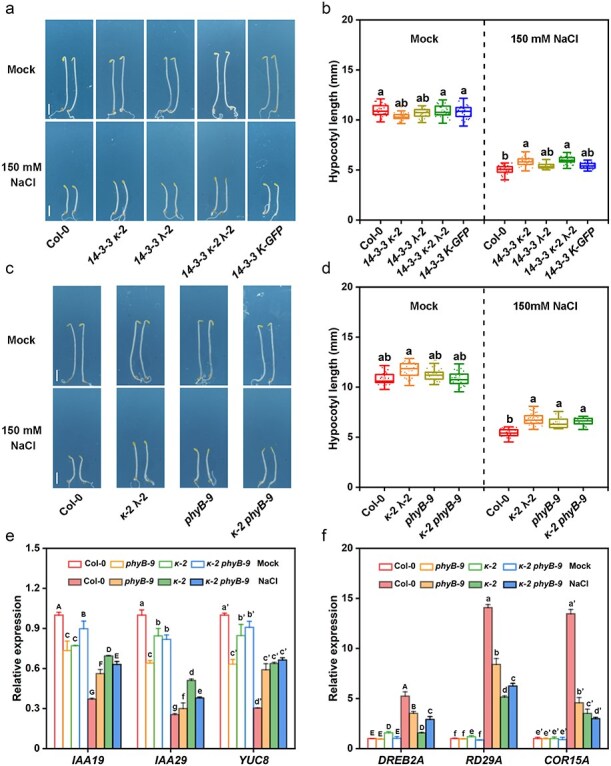
Light is an essential environmental factor that facilitates the robust upward growth of post-germinative seedlings emerging from buried seeds that is partly mediated by the photoreceptors. Salinity stress hampers plant growth and development and reduces yield. However, the involvement and regulatory role of photoreceptors and light signaling factors to salt stress are largely unknown. Here, we report that mutants of the phytochrome B (phyB) photoreceptor showed reduced sensitivity to salt-inhibited hypocotyl elongation in darkness, and that PHYTOCHROME-INTERACTING FACTOR 3 (PIF3) acts downstream of phyB in regulating this process in Arabidopsis thaliana. We also show that SALT OVERLY SENSITIVE 2 (SOS2) regulates phyB protein accumulation under salt stress in darkness. Surprisingly, salt treatment induces phyB nuclear body formation in darkness. Moreover, we found that the phosphorylation at residue Ser-86 of phyB is essential for its function, and the scaffold protein 14-3-3κ is involved in the regulation of phyB under salt stress in darkness. Taken together, our study reveals a regulatory role of the phyB-PIF3 module in mediating post-germination growth in darkness in response to salt stress.

Keywords: 14-3-3; SOS2; etiolated seedling; phyB; salt stress.


Conflict of interest statement

The authors have no conflicts of interest to declare.

Figures

Figure 1.
Figure 1.
Salt-mediated inhibition of hypocotyl elongation is less pronounced in the phyB mutant. (a) Seedling phenotypes of the Col-0 WT and the phyB-69 mutant grown in 1/2 MS medium with varying concentrations of salt in the dark for 4 days. Bars, 2 mm. (b) Hypocotyl length of the seedlings shown in (a). (c) Representative apical hook phenotypes of seedlings as shown in (a). Bars, 500 µm. (d) Apical hook curvature of the seedlings as shown in (c). (e) Seedling phenotypes of the Col-0 WT and different photoreceptor mutants grown in 1/2 MS medium with 150 mM NaCl in the dark for 4 days. (f) Hypocotyl length of the seedlings as shown in (e). Data are shown as means ± SD of more than 20 seedlings. Asterisks indicate significant differences between genotypes by a two-sided Student’s t-test (*P < 0.05, **P < 0.01, ns: no significance,) in (b and d). Letters indicate significant differences as determined by a two-sided Fisher’s LSD test (P < 0.05) in (f).
Figure 2.
Figure 2.
Overexpressing PIF3 reduces salt-mediated inhibition of hypocotyl elongation. (a) Seedling phenotypes of the Col-0 WT and the 35S:PIF1-GFP, 35S:PIF3-GFP, 35S:PIF4-GFP, and 35S:PIF5-GFP transgenic lines grown in 1/2 MS medium with 150 mM NaCl in the dark for 4 days. Bars, 2 mm. (b) Hypocotyl length of the seedlings as shown in (a). (c) Representative apical hook phenotypes of Col-0 and 35S:PIF3-GFP under 150 mM NaCl treatment in the dark for 4 days. Bars, 200 µm. (d) Apical hook curvature of the seedlings shown in (c). Data are shown as means ± SD of more than 20 seedlings. Letters indicate significant differences as determined by a two-sided Fisher’s LSD test (P < 0.05) in (b and d).
Figure 3.
Figure 3.
PIF3 acts downstream of phyB. (a) Seedling phenotypes of Col-0, pif3, phyB-9, and pif3 phyB-9 under 150 mM NaCl treatment in the dark for 4 days. Bars, 2 mm. (b) Hypocotyl length of the seedlings shown in (a). (c) Seedling phenotypes with 150 mM NaCl treatment under low-intensity red light (10 μmol m–2 s–1) for 4 days. Bars, 2 mm. (d) Hypocotyl length of the seedlings as shown in (c). Letters indicate significant differences by a two-sided Fisher’s LSD test (P < 0.05). (e and f) Relative transcript levels of four genes associated with cell elongation (e) and three genes related to salt stress (f). Letters indicate significant differences by Tukey’s HSD test (P < 0.05). Seedlings were grown in the dark for 4 days and then treated with or without 150 mM NaCl for 6 h. Data are shown as means ± SD, n = 3.
Figure 4.
Figure 4.
NaCl regulates phyB accumulation in a SOS2-dependent manner. (a) Seedling phenotypes of Col-0, sos2-2, phyB-69, and sos2-2 phyB-69 with 150 mM NaCl treatment in the dark for 4 days. Bars, 2 mm. (b) Relative hypocotyl length of the seedlings as shown in (A). Letters indicate significant differences by a two-sided Fisher’s LSD test (P < 0.05). (c and d) phyB protein levels in Col-0 (c) and in the 35S:phyB-GFP/phyB-9 line (d) with 150 mM NaCl treatment in the dark. (e) Relative transcript levels of PHYA, PHYB, SOS2, and SOS3. Data are shown as means ± SD, n = 3. Asterisks indicate significant differences by a two-sided Student’s t-test (**P < 0.01, *P < 0.05, ns: no significance). (f) phyB protein levels in Col-0 and sos2-2 with 150 mM NaCl treatment in the dark. A star indicates nonspecific bands. Immunoblotting was performed using anti-phyB antibody, anti-Actin served as a loading control. The values indicate the ratio of gray values of the protein bands corresponding to phyB and Actin (c, d, and f). Seedlings were grown in the dark for 4 days and then treated with or without 150 mM NaCl for the indicated time (c–f).
Figure 5.
Figure 5.
NaCl promotes phyB NB formation in the dark. (a) GFP fluorescence of phyB-GFP. The 35S:phyB-GFP/phyB-9 seedlings were grown in darkness for 4 days and subsequently treated with 150 mM NaCl in darkness or/and exposed to red light (30 μmol m–2 s–1) for 3 h. Representative pictures are shown. Bars, 10 µm. (b) Number of phyB-GFP NBs per nucleus. Approximately 15 nuclei were counted. (c) Diameter of phyB-GFP NBs. Approximately 25 nuclei were counted. Letters indicate significant differences as determined by a two-sided Fisher’s LSD test (P < 0.05).
Figure 6.
Figure 6.
Phosphorylation modification of phyB in response to salt stress. (a) Seedling phenotypes of Col-0, WT (35S:phyB-GFP/phyB-9), S86A (35S:phyBS86A-YFP/phyB-9), and S86D (35S:phyBS86D-YFP/phyB-9) with 150 mM NaCl treatment in the dark or under low-intensity red light (10 μmol m–2 s–1) for 4 days. Bars, 2 mm. (b) Hypocotyl length of the seedlings shown in (a). Letters indicate significant differences by a two-sided Fisher’s LSD test (P < 0.05). (c) GFP/YFP fluorescence was detected after salt treatment. Seedlings were grown in darkness for 4 days and subsequently treated with 150 mM NaCl for 3 h. Representative pictures are shown. Bars, 20 µm. (d) Number of phyB NBs per nucleus. Approximately 15 nuclei were counted. (e) Analysis of phyB phosphorylation. Col-0 or transgenic plants expressing the phyB-GFP fusion protein were grown in darkness for 4 days and then treated with H2O (Mock) or NaCl (150 mM) for 3 h. Total proteins were extracted and separated by 8% SDS-PAGE. Phosphorylation of phyB was examined using anti-phosphoserine antibody. The lanes contain equal amounts of total protein as shown by the comparable levels of Actin.
Figure 7.
Figure 7.
phyB and 14-3-3 regulate hypocotyl elongation under salt stress likely in the same pathway. (a) Seedling phenotypes of Col-0, 14-3-3 mutants (κ-2, λ-2, and κ-2 λ-2), and a line overexpressing 14-3-3 (14-3-3κ-GFP) with 150 mM NaCl treatment in the dark for 4 days. Bars, 2 mm. (b) Hypocotyl length of the seedlings shown in (a). (c) Seedling phenotypes of Col-0, 14-3-3 double (κ-2 λ-2), phyB-9, and 14-3-3 phyB double (κ-2 phyB-9) mutants with 150 mM NaCl treatment in the dark for 4 days. Bars, 2 mm. (d) Hypocotyl length of the seedlings shown in (c). Letters indicate significant differences by a two-sided Fisher’s LSD test (P < 0.05) in (b and d). (e and f) Relative transcript levels of three genes associated with cell elongation (e) and three genes related to salt stress (f). Letters indicate significant differences by Tukey’s HSD test (P < 0.05). Seedlings were grown in the dark for 4 days and then treated with or without 150 mM NaCl for 6 h. Data are shown as means ± SD, n = 3.

Similar articles

References

    1. Adams E., Diaz C., Hong J.P. and Shin R. (2014) 14-3-3 proteins participate in light signaling through association with PHYTOCHROME INTERACTING FACTORs. Int. J. Mol. Sci. 15: 22801–22814. - PMC - PubMed
    1. Ali A, Petrov V, Yun D and Gechev T (2023) Revisiting plant salt tolerance: novel components of the SOS pathway. Trends Plant Sci. 28: 1060–1069. - PubMed
    1. Alonso J.M., Stepanova A.N., Leisse T.J., Kim C.J., Chen H., Shinn P., et al. (2003) Genome-wide insertional mutagenesis of Arabidopsis thaliana. Science 301: 653–657. - PubMed
    1. Al-Sady B., Ni W., Kircher S., Schafer E. and Quail P.H. (2006) Photoactivated phytochrome induces rapid PIF3 phosphorylation prior to proteasome-mediated degradation. Mol. Cell 23: 439–446. - PubMed
    1. Camoni L., Visconti S., Aducci P. and Marra M. (2018) 14-3-3 proteins in plant hormone signaling: doing several things at once. Front. Plant Sci. 9: 297. - PMC - PubMed

MeSH terms

LinkOut - more resources