

Perfusion-Based Production of rAAV via an Intensified Transient Transfection Process
- PMID: 40103325
- PMCID: PMC12067042
- DOI: 10.1002/bit.28967
Perfusion-Based Production of rAAV via an Intensified Transient Transfection Process
Abstract
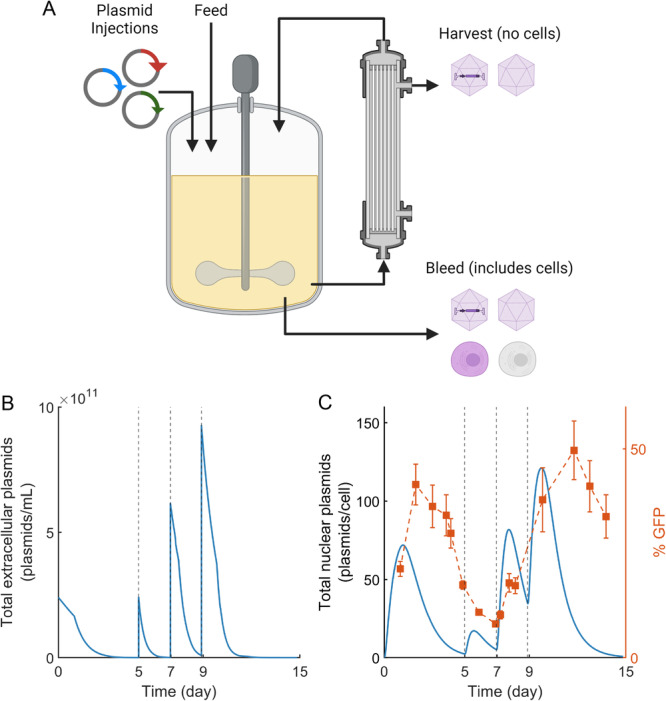
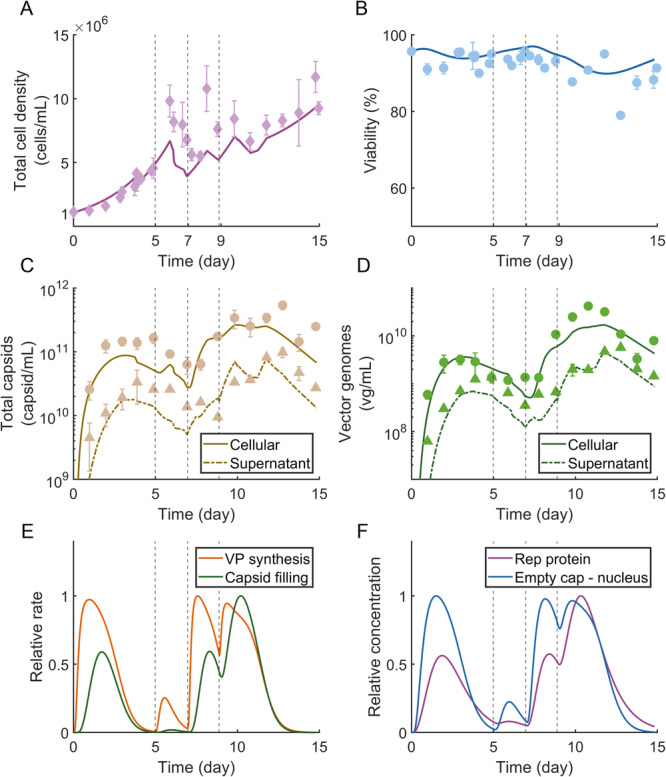
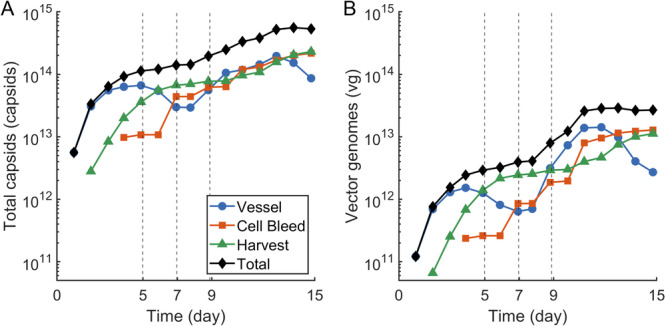
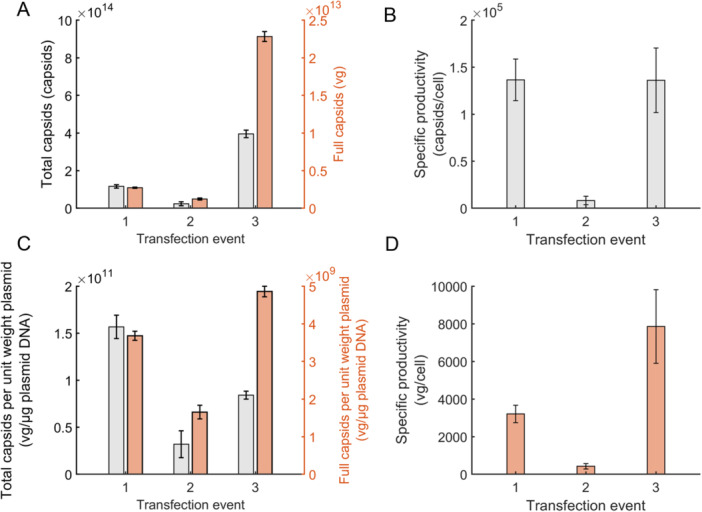
Increasing demand for recombinant adeno-associated virus (rAAV)-based gene therapies necessitates increased manufacturing production. Transient transfection of mammalian cells remains the most commonly used method to produce clinical-grade rAAVs due to its ease of implementation. However, transient transfection processes are often characterized by suboptimal yields and low fractions of full-to-total capsids, both of which contribute to the high cost of goods of many rAAV-based gene therapies. Our previously developed mechanistic model for rAAV2/5 production indicated that the inadequate capsid filling is due to a temporal misalignment between viral DNA replication and capsid synthesis within the cells and the repression of later phase capsid formation by Rep proteins. We experimentally validated this prediction and showed that performing multiple, time-separated doses of plasmid increases the production of rAAV. In this study, we use the insights generated by our mechanistic model to develop an intensified process for rAAV production that combines perfusion with high cell density re-transfection. We demonstrate that performing multiple, time-separated doses at high cell density boosts both cell-specific and volumetric productivity and improves plasmid utilization when compared to a single bolus at standard operating conditions. Our results establish a new paradigm for continuously manufacturing rAAV via transient transfection that improves productivity and reduces manufacturing costs.
Keywords: adeno‐associated virus; continuous manufacturing; gene therapy; mechanistic modeling; transfection.
© 2025 The Author(s). Biotechnology and Bioengineering published by Wiley Periodicals LLC.
Figures
Similar articles
-
Development of an HEK293 Suspension Cell Culture Medium, Transient Transfection Optimization Workflow, and Analytics for Batch rAAV Manufacturing.Biotechnol Bioeng. 2025 Jul;122(7):1640-1655. doi: 10.1002/bit.28980. Epub 2025 Apr 8. Biotechnol Bioeng. 2025. PMID: 40197832 Free PMC article.
-
Multidose transient transfection of human embryonic kidney 293 cells modulates recombinant adeno-associated virus2/5 Rep protein expression and influences the enrichment fraction of filled capsids.Biotechnol Bioeng. 2024 Dec;121(12):3694-3714. doi: 10.1002/bit.28828. Epub 2024 Aug 23. Biotechnol Bioeng. 2024. PMID: 39176568
-
Improved productivity of recombinant adeno-associated virus (rAAV) via triple transfection of HEK293 cells using perfusion cultivation.Bioprocess Biosyst Eng. 2025 Jul;48(7):1159-1169. doi: 10.1007/s00449-025-03167-9. Epub 2025 Apr 26. Bioprocess Biosyst Eng. 2025. PMID: 40285883
-
Cellular pathways of recombinant adeno-associated virus production for gene therapy.Biotechnol Adv. 2021 Jul-Aug;49:107764. doi: 10.1016/j.biotechadv.2021.107764. Epub 2021 May 3. Biotechnol Adv. 2021. PMID: 33957276 Review.
-
Chromatography in Downstream Processing of Recombinant Adeno-Associated Viruses: A Review of Current and Future Practises.Biotechnol Bioeng. 2025 May;122(5):1067-1086. doi: 10.1002/bit.28932. Epub 2025 Feb 4. Biotechnol Bioeng. 2025. PMID: 39905691 Free PMC article. Review.
Cited by
-
Development of an HEK293 Suspension Cell Culture Medium, Transient Transfection Optimization Workflow, and Analytics for Batch rAAV Manufacturing.Biotechnol Bioeng. 2025 Jul;122(7):1640-1655. doi: 10.1002/bit.28980. Epub 2025 Apr 8. Biotechnol Bioeng. 2025. PMID: 40197832 Free PMC article.
References
-
- Beck, J. V. , and Arnold K. J.. 1977. Parameter Estimation in Engineering and Science. Wiley.
-
- Cameau, E. , Pedregal A., and Glover C.. 2019. “Cost Modelling Comparison of Adherent Multi‐Trays With Suspension and Fixed‐Bed Bioreactors for the Manufacturing of Gene Therapy Products.” Cell and Gene TherapyInsights 5: 1663–1674.
-
- Canova, C. T. , Inguva P. K., and Braatz R. D.. 2023. “Mechanistic Modeling of Viral Particle Production.” Biotechnology and Bioengineering 120: 629–641. - PubMed
-
- Cervera, L. , González‐Domínguez I., Segura M. M., and Gòdia F.. 2017. “Intracellular Characterization of Gag VLP Production by Transient Transfection of HEK 293 Cells.” Biotechnology and Bioengineering 114: 2507–2517. - PubMed
MeSH terms
Grants and funding
LinkOut - more resources
Full Text Sources
