

Comparative analysis of amino acid auxotrophies and peptidase profiles in non-dysbiotic and dysbiotic small intestinal microbiomes
- PMID: 40103612
- PMCID: PMC11914904
- DOI: 10.1016/j.csbj.2025.02.004
Comparative analysis of amino acid auxotrophies and peptidase profiles in non-dysbiotic and dysbiotic small intestinal microbiomes
Abstract
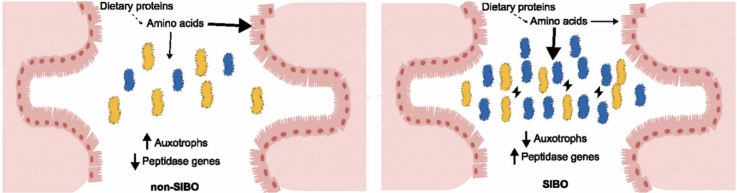
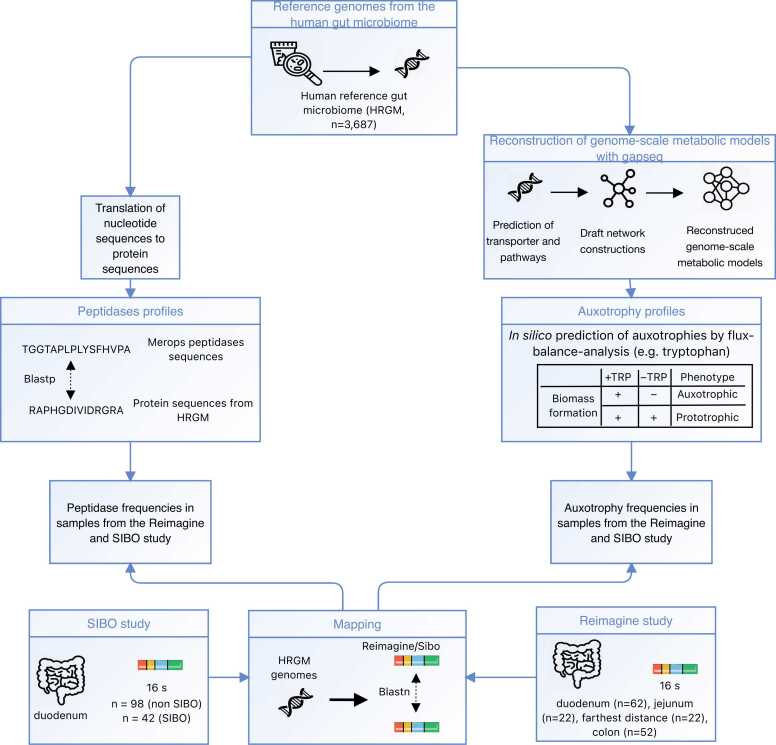
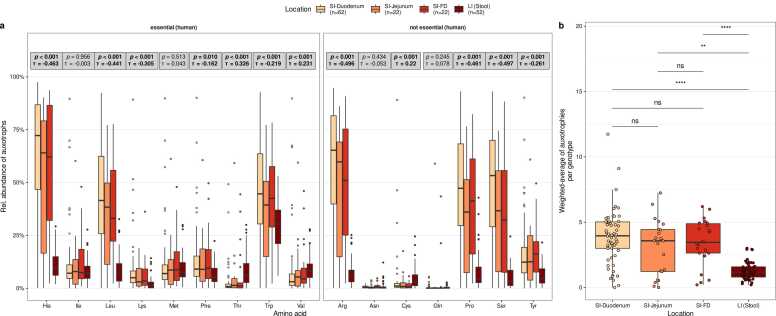
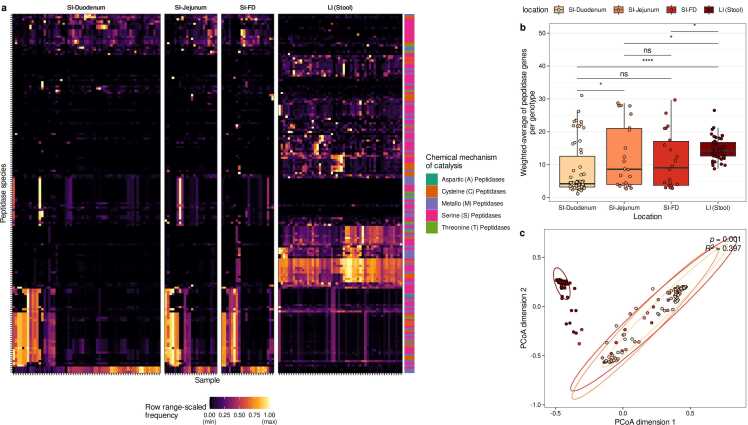
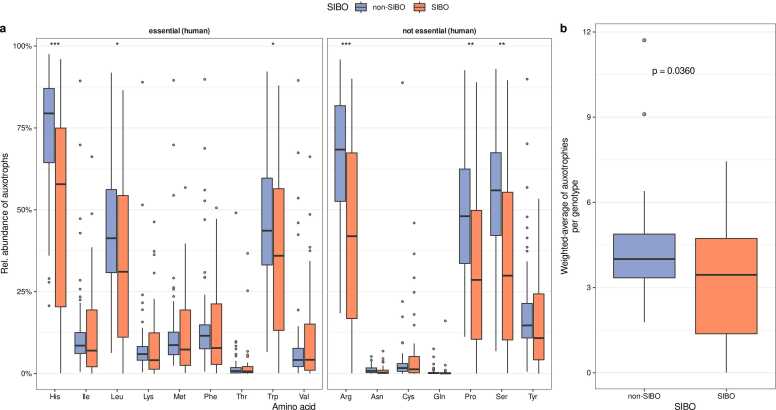
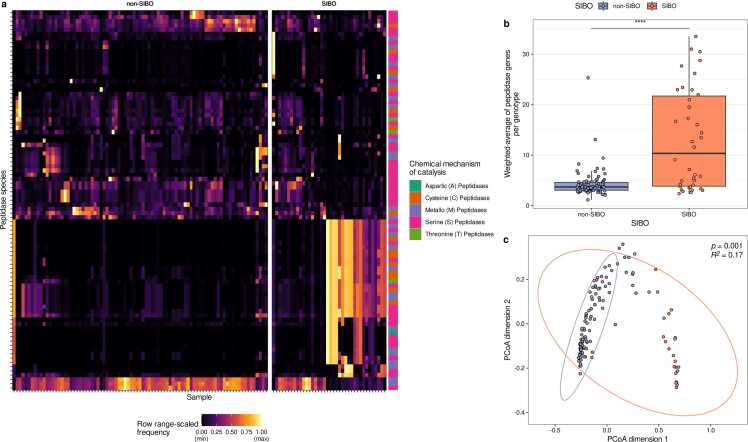
Small Intestinal Bacterial Overgrowth (SIBO) is linked to various diseases and has been associated with altered serum amino acid levels. However, the direct role of the gut microbiome in these changes remains unconfirmed. This study employs genome-scale metabolic modeling to predict amino acid auxotrophy and peptidase gene profiles in the small intestinal microbiomes of SIBO and non-SIBO subjects. Auxotrophy and peptidase gene profiles were further examined in the large intestinal microbiome under non-dysbiotic conditions to assess their similarity to the microbial SIBO profile. Our analysis revealed that the abundance of auxotrophic bacteria is higher in the microbiota of the small intestine than in the large intestine in non-dysbiotic controls. In patients with SIBO, the abundance of auxotrophies in the small intestine decreased compared to non-SIBO subjects. Peptidase gene profiles in non-dysbiotic individuals were distinct between small and large intestinal microbiomes, with fewer extracellular peptidase genes in small intestine microbiomes. In SIBO, extracellular peptidase genes increased compared to non-SIBO subjects. Further, there were more significant associations between the abundance of auxotrophies and peptidase genes in microbiomes of the small intestine compared to the large intestine. In conclusion, the auxotrophy and peptidase gene profiles of the small and large intestinal microbiomes were distinct. In SIBO, the small intestinal microbiome shifts towards a metabolic state resembling that of the large intestine, particularly in its increased abundance of extracellular peptidase genes. This highlights the potential of genome-scale metabolic modeling in identifying metabolic disruptions associated with SIBO, which could inform the development of targeted interventions.
Keywords: Amino acids; Auxotrophies; Peptidases; SIBO; Small intestinal microbiome.
© 2025 The Authors.
Conflict of interest statement
The authors declare that they have no known competing financial interests or personal relationships that could have appeared to influence the work reported in this paper.
Figures


Similar articles
-
The impact of small intestinal bacterial overgrowth on the efficacy of fecal microbiota transplantation in patients with chronic constipation.mBio. 2024 Oct 16;15(10):e0202324. doi: 10.1128/mbio.02023-24. Epub 2024 Aug 28. mBio. 2024. PMID: 39194187 Free PMC article.
-
Altered gut microbiota in patients with small intestinal bacterial overgrowth.J Gastroenterol Hepatol. 2023 Jan;38(1):61-69. doi: 10.1111/jgh.16013. Epub 2022 Oct 19. J Gastroenterol Hepatol. 2023. PMID: 36180941
-
An Oral Botanical Supplement Improves Small Intestinal Bacterial Overgrowth (SIBO) and Facial Redness: Results of an Open-Label Clinical Study.Nutrients. 2024 Sep 18;16(18):3149. doi: 10.3390/nu16183149. Nutrients. 2024. PMID: 39339748 Free PMC article. Clinical Trial.
-
Small Intestinal Bacterial and Fungal Overgrowth: Health Implications and Management Perspectives.Nutrients. 2025 Apr 17;17(8):1365. doi: 10.3390/nu17081365. Nutrients. 2025. PMID: 40284229 Free PMC article. Review.
-
Small intestinal bacterial overgrowth and metabolic dysfunction-associated steatotic liver disease.Front Nutr. 2024 Dec 17;11:1502151. doi: 10.3389/fnut.2024.1502151. eCollection 2024. Front Nutr. 2024. PMID: 39742106 Free PMC article.
References
-
- Fan Y., Pedersen O. Gut microbiota in human metabolic health and disease. Nat Rev Microbiol. 2021;19:55–71. - PubMed
-
- Le Chatelier E., et al. Richness of human gut microbiome correlates with metabolic markers. Nature. 2013;500:541–546. - PubMed
-
- Shanahan E.R., Holtmann G., Morrison M. Life in the small intestine: the forgotten microbiome? Microbiol Aust. 2017;38:116.
LinkOut - more resources
Full Text Sources