. 2025 Mar 4:13:1520723.
doi: 10.3389/fcell.2025.1520723. eCollection 2025.

The BBS/CCT chaperonin complex ensures the localization of the adhesion G protein-coupled receptor ADGRV1 to the base of primary cilia

Affiliations

The BBS/CCT chaperonin complex ensures the localization of the adhesion G protein-coupled receptor ADGRV1 to the base of primary cilia

Joshua Linnert et al. Front Cell Dev Biol. .

Abstract

Primary cilia are antenna-like sensory organelles present on almost all eukaryotic cells. Their sensory capacity relies on receptors, in particular G-protein-coupled receptors (GPCRs) which localize to the ciliary membrane. Here we show that ADGRV1, a member of the GPCR subfamily of adhesion GPCRs, is part of a large protein network, interacting with numerous proteins of a comprehensive ciliary proteome. ADGRV1 is localized to the base of prototypic primary cilia in cultured cells and the modified primary cilia of retinal photoreceptors, where it interacts with TRiC/CCT chaperonins and the Bardet Biedl syndrome (BBS) chaperonin-like proteins. Knockdown of ADGRV1, CCT2 and 3, and BBS6 result in common ciliogenesis phenotypes, namely reduced ciliated cells combined with shorter primary cilia. In addition, the localization of ADGRV1 to primary cilia depends on the activity of a co-complex of TRiC/CCT chaperonins and the BBS chaperonin-like proteins. In the absence of components of the TRiC/CCT-BBS chaperonin co-complex, ADGRV1 is depleted from the base of the primary cilium and degraded via the proteasome. Defects in the TRiC/CCT-BBS chaperonin may lead to an overload of proteasomal degradation processes and imbalanced proteostasis. Dysfunction or absence of ADGRV1 from primary cilia may underly the pathophysiology of human Usher syndrome type 2 and epilepsy caused by mutations in ADGRV1.

Keywords: Chaperonin-like BBS proteins; adhesion GPCR; chaperonin containing Tcp-1 (CCT); epilepsy; primary cilia; proteasomal degradation; t-complex protein ring complex (TRiC); usher syndrome.


Conflict of interest statement

The authors declare that the research was conducted in the absence of any commercial or financial relationships that could be construed as a potential conflict of interest. The author(s) declared that they were an editorial board member of Frontiers, at the time of submission. This had no impact on the peer review process and the final decision.

Figures

FIGURE 1
FIGURE 1
Conserved localization of ADGRV1 in primary cilia of various cell types. (A) Scheme of the prototypic primary cilium. The primary cilium is comprised of the ciliary membrane surrounding the microtubule-based axoneme, which is connected through the transition zone (TZ) to the basal body (BB, = mother centriole) and the adjacent daughter centriole (DC) surrounded by the pericentriolar material (dotted line). Green colour indicates localization of ADGRV1. (B) Triple immunofluorescence of the axoneme marker ARL13B (red), the pericentriolar matrix marker pericentrin (PCTN2, magenta) and ADGRV1 (green) counter stained with the nuclear DNA marker DAPI in the primary cilium of hTERT-RPE1 cells. Staining pattern revealed the localization of ADGRV1 in the transition zone and the basal body complex (BB plus DC) surrounded by the pericentriolar material. (C) Localization of ADGRV1 in the primary cilium of human primary dermal fibroblasts and (D) in primary astrocytes derived from the hippocampus of a mouse brain. Double immunofluorescence of ARL1B (red) and ADGRV1 (green) counter stained with the DAPI revealed the localization of ADGRV1 at the ciliary base in both primary cell types. (E) Double immunofluorescence of the ciliary marker GT335 (red) and ADGRV1 (green) in longitudinal cryosection through the ciliary region (CR) of the photoreceptor cell layer of a mouse retina counter stained with DAPI. Staining pattern revealed the localization of ADGRV1 in CR where the connecting cilium (CC = transition zone of prototypic primary cilium) are localized at the joint between the inner segment (IS) and light sensitive outer segment (OS) of photoreceptor cells as indicated in (F) scheme of the ciliary region of a rod photoreceptor cell. Green colour indicates localization of ADGRV1; yellow: co-localization of ADGRV1 and GT335. Scale bars: a, left lower mag image = 10 µm and a, higher mag images, b, d, e = 5 µm.
FIGURE 2
FIGURE 2
Interactions of ADGRV1 with proteins of primary cilium revealed by affinity proteomics. (A) Schematic representation of full length ADGRV1b, ADGRV1 bait constructs used in the tandem affinity purifications (Knapp et al., 2022), and truncated ADGRV1 proteins expressed in Adgrv1/del7TM and Adgrv1/DrumB-mouse models due to a deletion of the 7TM domain or a premature termination codon (McMillan and White, 2004; Potter et al., 2016). (B) Venn diagram of ADGRV1 prey assigned to the primary cilia proteome defined by the CiliaCarta and the Syscilia consortium (Van Dam et al., 2019; Vasquez et al., 2021). (C) The interaction of the prey, identified in b, visualised in a STRING network.
FIGURE 3
FIGURE 3
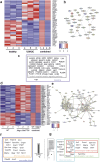
Differentially expressed ciliary genes in USH2C patient-derived fibroblasts and Adgrv1 deficient mouse retinae (A) Heatmap of differentially expressed ciliary genes (DECGs) in patient-derived fibroblasts harbouring the p. R2959* nonsense mutation in the USH2C gene (USH2C) compared to fibroblasts derived from a healthy individual (healthy). (B) String network analysis of the interaction of the proteins corresponding to the DECGs identified in (A) (C) Venn diagram of identified DECGs for the terms G protein-coupled receptor signaling pathway and signaling by a GO term analysis in category biological process. (D) Heatmap of DECGs in retinae of the Adgrv1/del7TM mouse model. (E) String network analysis of the interaction of the proteins corresponding to the DECGs identified in (D) (F, G) Venn diagrams of identified DECGs for the terms 9+0 non-motile cilium and non-motile cilium (F) and photoreceptor outer segment, photoreceptor cell cilium and visual perception (G) by a GO term analyses in category cellular component.
FIGURE 4
FIGURE 4
Phenotypic analysis of primary cilia of fibroblasts derived from a USH2C patient (A–E) Immunofluorescence double staining of the axonemal marker ARL13B (green) and the ciliary base marker centrin 3 (CENT3, red) counterstained with nuclear DNA marker DAPI (blue) in patient-derived USH2C p. R2959* fibroblasts and healthy control cells. (B, D, E) Quantitative analysis of the number of ciliated cells, the mean cilia length and the distribution of cilia length in patient-derived fibroblasts and healthy control cells. Quantification revealed no significant changes in the number of ciliated cells, but significantly shorter cilia in the patient-derived fibroblasts compared to the healthy controls. N = number of biological replicates, n = number of analysed cells. Statistical significance was determined by the two-tailed Student’s t-test (B, D) and the Kolmogorov-Smirnov test (E): *p < 0.05, **p < 0.01, ***p < 0.005. Scale bar in a = 20 μm, c = 5 µm.
FIGURE 5
FIGURE 5
Phenotypic analysis of primary cilia of primary astrocytes isolated from brains of Adgrv1-deficent mouse models (A, C) Immunofluorescence double staining of the axonemal marker ARL13B (green) and the ciliary base marker centrin 3 (CETN3, red) counterstained with nuclear DNA marker DAPI (blue) in primary astrocytes derived from Adgrv1/del7TM mice and wt controls. In (A) a overview of the ciliated cells is demonstrated and in (C) a magnification of the primary cilia is shown. (B, D, E) Quantitative analysis of the number of ciliated cells (B), the mean cilia length (D) and the distribution of cilia length (E) of primary astrocytes revealed a significant decrease of ciliated cells in Adgrv1/del7TM astrocytes, no significantly altered mean cilia length, but a significant reduction of the cilia length quantifying the overall cilia length distribution. (F, H) Immunofluorescence double staining of the axonamal marker ARL13B (green) and the ciliary base marker centrin 3 (CETN3, red) counterstained with nuclear DNA marker DAPI (blue) in primary astrocytes derived from Adgrv1/DrumB mice and wt controls. Overview of ciliated cells (F), and magnification of primary cilia (H). Quantitative analysis of the number of ciliated cells (G), the mean cilia length (I) and the distribution of cilia length (J) of primary astrocytes revealed no significant decrease of ciliated cells in Adgrv1/DrumB astrocytes, but a significant reduction in the mean cilia length and the cilia length distribution. N = number of biological replicates, n = number of analysed cells. Statistical significance was determined by the two-tailed Student’s t-test (B, D, G, I) and the Kolmogorov-Smirnov test (E, J): *p < 0.05, **p < 0.01, ***p < 0.005. Scale bars: a, e, i = 5 µm.
FIGURE 6
FIGURE 6
Primary cilium length in Adgrv1/del7TM retinae is reduced compared to wt controls. (A, B) Double immunofluorescence staining for centrin 3 (CETN3, green) and glutamylated tubulin (GT335) counterstained with DAPI in longitudinal cryosections through retinae of wt (A) and Adgrv1/del7TM mice (B). (C) Quantification of mean cilia length revealed a reduction in Adgrv1/del7TM retinae compared to wt controls confirmed by (D) the quantification of the distribution of the connecting cilia lengths. N = number of biological replicates, n = number of measured connecting cilia. Statistical significance was determined by the two-tailed Student’s t-test (C) and the Kolmogorov-Smirnov test (D): *p < 0.05, **p < 0.01, ***p < 0.005. Scale bars: a, b = 15 μm and 2 µm.
FIGURE 7
FIGURE 7
Immunofluoresence analysis of ADGRV1 in TriC/CCT-BBS chaperonin depleted cells and mouse retinae (A, C) Double immunofluorescence staining for Arl13B (red) and ADGRV1 (green) of primary cilia in hTERT-RPE1 cells after siRNA-mediated knock down of (A) BBS6 and (B) CCT2 and CCT3 compared to non-targeting controls (NTC). (B, D) Quantification confirms reduced localization of ADGRV1 at the ciliary base upon BBS6 KD. (D) Quantification confirms reduced localization of ADGRV1 at the ciliary base upon CCT2 and CCT3 KD. (E) Double immunofluorescence staining for Adgrv1 (green) and connecting cilia marker Centrin2 (red) in longitudinal cryosections though the ciliary region (CR, in scheme left) of mouse photoreceptor cells revealed reduced Adgrv1 immunofluorescence in Bbs6 −/− and Bbs10 −/− mice when compared to wt littermate controls. Scheme shows CC: connecting cilium, OS: outer segment, IS: inner segment of a rod photoreceptor cell. Statistical significance was determined by the two-tailed Student’s t-test: *p < 0.05, **p < 0.01, ***p < 0.005. Scale bars: a,c = 5 μm; e = 1 µm.
FIGURE 8
FIGURE 8
ADGRV1 mRNA and ADGRV1 protein expression are changed in the opposite direction in cells and tissues deficient for BBS6 (A) Quantitative real-time PCR (qRT-PCR) analysis of ADGRV1 mRNA expression in serum-starved hTERT-RPE1 cells after siRNA-mediated BBS6 knockdown compared to non-targeting control (NTC). (B) qRT-PCR analysis of CCT3 mRNA expression in serum-starved hTERT-RPE1 cells after siRNA-mediated BBS6 knockdown compared to non-targeting control (NTC). Quantifications revealed an increase of ADGRV1 but not of CCT3 mRNA expression in BBS6 depleted cells. (C, D) qRT-PCR analysis of Adgrv1 mRNA expression in retinae of postnatal P12 and P29 Bbs6 −/− mice demonstrate significantly higher expression of Adgrv1 mRNA. (E, F) Western blot analysis of ADGRV1 and CCT3 protein expression in serum-starved hTERT-RPE1 cells after siRNA-mediated BBS6 knockdown. Quantifications of band densities revealed a decrease of ADGRV1 (x 0.55) but not of CCT3 expression (x 0.95) in BBS6 depleted cells when compared to non-targeting controls (NTC). GAPDH/Gapdh and GAPDH protein were used as housekeeping control. Statistical significance was determined by the two-tailed Student’s t-test: *p < 0.05, **p < 0.01, ***p < 0.005.
FIGURE 9
FIGURE 9
Increased proteasomal degradation of ADGRV1 upon BBS6 loss in hTERT-RPE1 cells. (A, B) Western blot analysis of ADGRV1 and CCT3 protein expression in serum-starved hTERT-RPE1 cells after siRNA-mediated BBS6 knockdown treated with the proteasomal inhibitor MG132 solved in DMSO. The significant decrease of ADGRV1 protein expression in BBS depleted cells is restored by treatment with MG132. (C, D) Indirect immunofluorescence triple labelling of ADGRV1 (green) counterstained with axoneme marker ARL13B (red) and basal body marker pericentrin (PCNT2) (magenta) in NTC control and siRNA-mediated BBS6 knockdown serum-starved hTERT-RPE1 cells treated with MG132 and DMSO. The ADGRV1 immunofluorescence in the transition zone of primary cilia (white arrowhead) is restored in cells treated with MG132. (D) Quantification of anti-ADGRV1 immunofluorescence intensity in the transition zone confirms recovery of ADGRV1 at the ciliary base and transition zone of BBS6 KD cells upon MG132 treatment. Statistical significance was determined by the two-tailed Student’s t-test: *p < 0.05, **p < 0.01, ***p < 0.005. Scale = 5 µm.

Similar articles

References

    1. Ahmed Z. M., Riazuddin S., Bernstein S. L., Ahmed Z., Khan S., Griffith A. J., et al. (2001). Mutations of the protocadherin gene PCDH15 cause usher syndrome type 1F. Am. J. Hum. Genet. 69, 25–34. 10.1086/321277 - DOI - PMC - PubMed
    1. Álvarez-Satta M., Castro-Sánchez S., Valverde D. (2017). Bardet-Biedl syndrome as a chaperonopathy: dissecting the major role of chaperonin-like BBS proteins (BBS6-BBS10-BBS12). Front. Mol. Biosci. 4, 55. 10.3389/fmolb.2017.00055 - DOI - PMC - PubMed
    1. Asante D., Stevenson N. L., Stephens D. J. (2014). Subunit composition of the human cytoplasmic dynein-2 complex. J. Cell Sci. 127, 4774–4787. 10.1242/jcs.159038 - DOI - PMC - PubMed
    1. Avasthi P., Marshall W. F. (2012). Stages of ciliogenesis and regulation of ciliary length. Differentiation 83, S30–S42. 10.1016/j.diff.2011.11.015 - DOI - PMC - PubMed
    1. Bandah-Rozenfeld D., Mizrahi-Meissonnier L., Farhy C., Obolensky A., Chowers I., Pe’Er J., et al. (2010). Homozygosity mapping reveals null mutations in FAM161A as a cause of autosomal-recessive retinitis pigmentosa. Am. J. Hum. Genet. 87, 382–391. 10.1016/j.ajhg.2010.07.022 - DOI - PMC - PubMed

LinkOut - more resources