. 2025 Mar 18;9(3):e70031.
doi: 10.1002/pld3.70031. eCollection 2025 Mar.

Genome and Tissue-Specific Transcriptome of the Tropical Milkweed (Asclepias curassavica)

Affiliations

Genome and Tissue-Specific Transcriptome of the Tropical Milkweed (Asclepias curassavica)

Honglin Feng et al. Plant Direct. .

Abstract

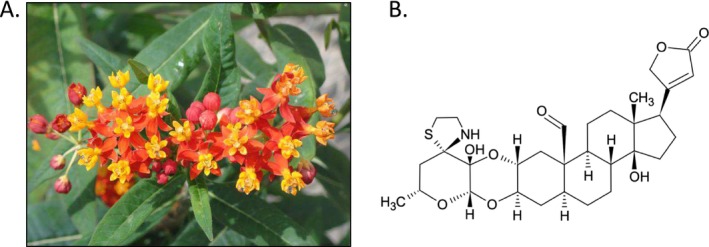
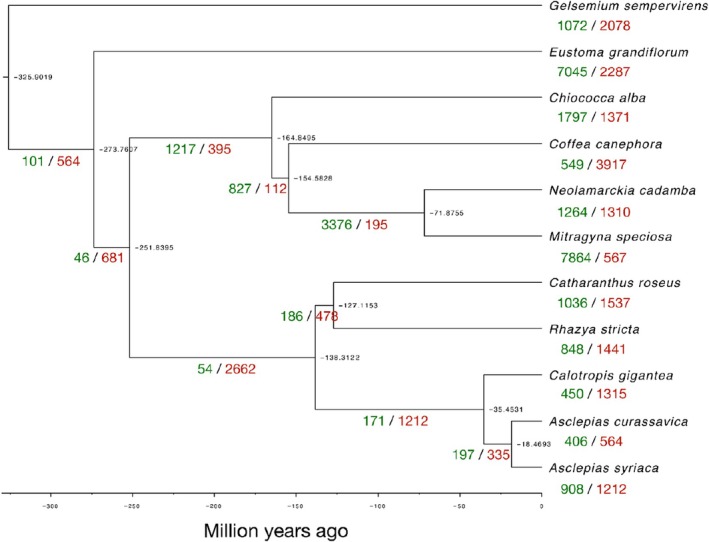
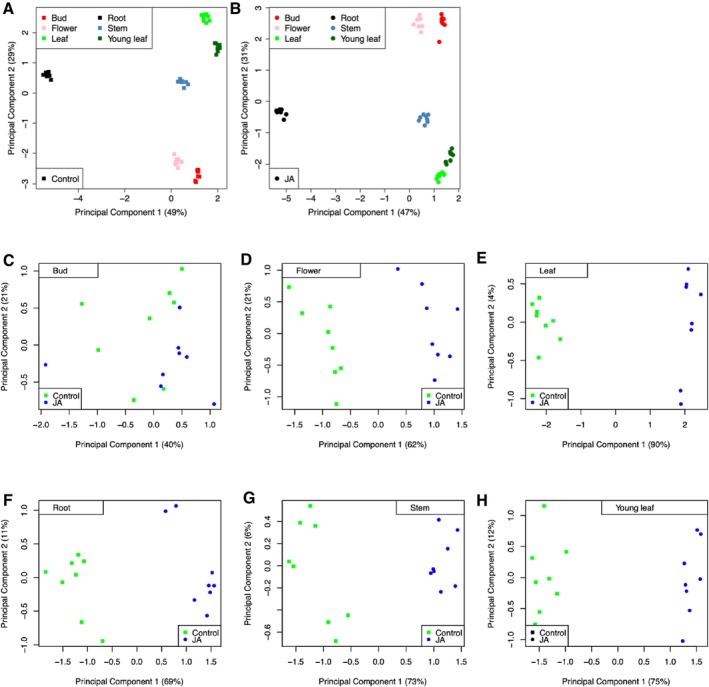
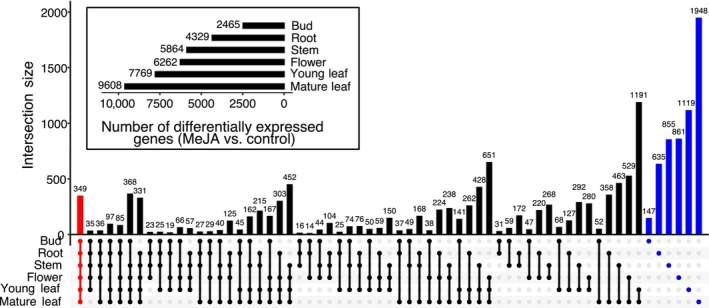
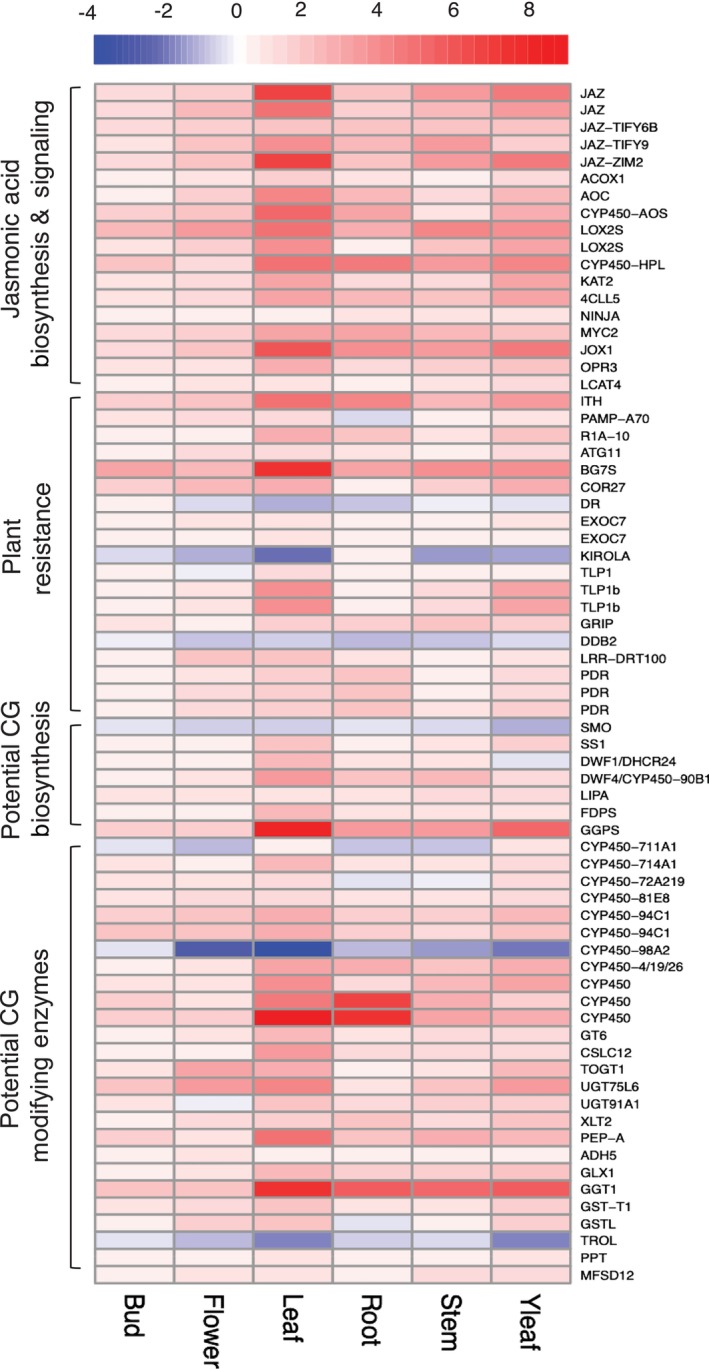
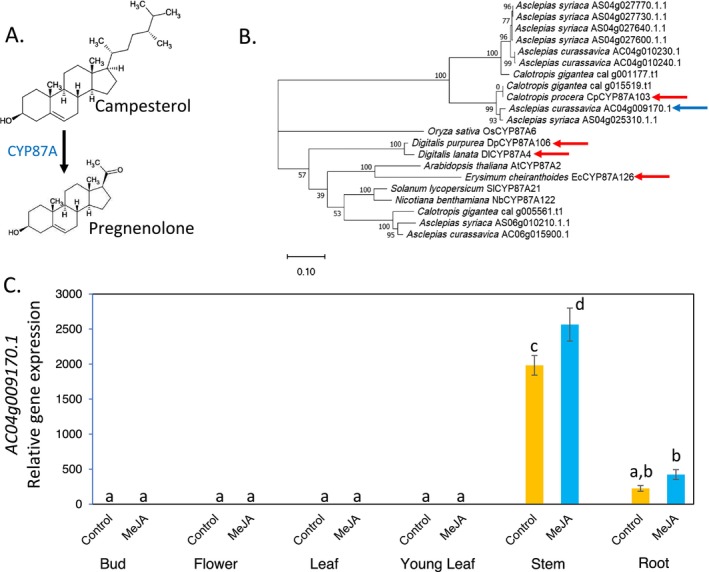
Tropical milkweed (Asclepias curassavica) serves as a host plant for monarch butterflies (Danaus plexippus) and other insect herbivores that can tolerate the abundant cardiac glycosides that are characteristic of this species. Cardiac glycosides, along with additional specialized metabolites, also contribute to the ethnobotanical uses of A. curassavica. To facilitate further research on milkweed metabolism, we assembled the 197-Mbp genome of a fifth-generation inbred line of A. curassavica into 619 contigs, with an N50 of 10 Mbp. Scaffolding resulted in 98% of the assembly being anchored to 11 chromosomes, which are mostly colinear with the previously assembled common milkweed (A. syriaca) genome. Assembly completeness evaluations showed that 98% of the BUSCO gene set is present in the A. curassavica genome assembly. The transcriptomes of six tissue types (young leaves, mature leaves, stems, flowers, buds, and roots), with and without defense elicitation by methyl jasmonate treatment, showed both tissue-specific gene expression and induced expression of genes that may be involved in cardiac glycoside biosynthesis. Expression of a CYP87A gene, the predicted first gene in the cardiac glycoside biosynthesis pathway, was observed only in the stems and roots and was induced by methyl jasmonate. Together, this genome sequence and transcriptome analysis provide important resources for further investigation of the ecological and medicinal uses of A. curassavica.


Conflict of interest statement

The authors declare no conflicts of interest.

Figures

FIGURE 1
FIGURE 1
Asclepias curassavica , tropical milkweed. (A) Flowers of the greenhouse‐grown A. curassavica lineage that was used for the current study. (B) Structure of voruscharin, the most abundant cardiac glycoside in A. curassavica .
FIGURE 2
FIGURE 2
Pie charts showing percentages of genome features in the Asclepias syriaca and Asclepias curassavica pseudomolecules. The size of each pie is scaled to the genome size of the species.
FIGURE 3
FIGURE 3
Synteny plot showing regions of collinearity between the Asclepias curassavica and Asclepias syriaca pseudomolecules. Sequence matches were calculated with nucmer and plotted using Circos. Numbers next to the chromosome arcs indicate Mbp lengths.
FIGURE 4
FIGURE 4
Upset plot showing the intersection of gene families among Asclepias curassavica and sequenced near relatives. The numbers of gene families are indicated for each species and species intersection.
FIGURE 5
FIGURE 5
Species phylogeny showing gene family expansions and contractions. Expansions are shown in green, and contractions are shown in red. Estimated divergence times (millions of years before the present) are in black at the nodes of the tree.
FIGURE 6
FIGURE 6
Principal component analyses (PCA) of RNAseq data. (A) PCA of control samples treated with 0.1% ethanol. (B) PCA of methyl jasmonate‐treated samples. (C–H) comparison of control samples (green dots) and methyl jasmonate‐treated samples (blue dots) of (C) buds, (D) flowers, (E) mature leaves, (F) roots, (G) stems, and (H) young leaves. Gene expression data are in Datasets S1 and S2.
FIGURE 7
FIGURE 7
Number of differentially expressed genes across tissue types after methyl jasmonic acid (MeJA) treatment. The horizontal bar plot in the inset box shows the number of differentially expressed genes (MeJA‐treated vs. control) in each of the six tested tissue types. The intersection plot shows the number of differentially expressed genes across different tissue type combinations. The red bar represents the number of core differentially expressed genes across all tissue types, blue bars represent the number of differentially expressed genes that are specific to each tissue type, and black bars represent other tissue intersections indicated by the dot connections under the bar plot. This plot was generated using UpSetRv1.4.0. Gene expression data are in Datasets S1 and S2.
FIGURE 8
FIGURE 8
Heatmap of log2fold changes of commonly differentially expressed genes across different tissues. Log2fold changes were calculated with methyl jasmonate‐treated samples, comparing to control samples within each tissue type. Red represents upregulation, whereas blue represents downregulation. Tissue (in columns) and gene (in rows) clusters were calculated using default method in pheatmapto facilitate pattern identification. CG, cardiac glycoside. Gene identifications are listed in Table S3.
FIGURE 9
FIGURE 9
Asclepias curassavica CYP87A gene identification. (A) First reaction of the cardiac glycoside biosynthesis pathway from campesterol, as described for Digitalisspp., Erysimum cheiranthoides , and Calotropis procera . (B) Phylogenetic tree of predicted CYP87A proteins from cardiac glycoside‐producing species, A. curassavica , Asclepias syriaca , C. procera , C. gigantea , and E. cheiranthoides , as well as the well‐studied model plant species Nicotiana benthamiana, Solanum lycopersicum , Arabidopsis thaliana , and Oryza sativa. Enzymes with confirmed functions in cardiac glycoside biosynthesis are marked with red arrows. The predicted A. curassavica enzyme catalyzing this reaction is marked with a blue arrow. The maximum likelihood, midpoint‐rooted tree was produced with IQ‐Tree and visualized with MEGA11. Bootstrap values are based on 1000 replicates. The scale bar indicates substitutions per site. A protein sequence alignment corresponding to this tree is presented in Figure S5. (C) Expression of an A. curassavica CYP87A gene (AC04g009170.1, marked with a blue arrow in Panel B) in different tissue types, with and without methyl jasmonate (MeJA) treatment to elicit defense‐related gene expression. Mean ± SE of N = 8; different letters indicate p < 0.05, ANOVA followed by Tukey's HSD test.

Similar articles

Cited by

References

    1. Agrawal, A. A. 2017. Monarchs and Milkweed: A Migrating Butterfly, a Poisonous Plant, and Their Remarkable Story of Coevolution. Princeton, NJ: Princeton University Press.
    1. Agrawal, A. A. , Böröczky K., Haribal M., et al. 2021. “Cardenolides, Toxicity, and the Costs of Sequestration in the Coevolutionary Interaction Between Monarchs and Milkweeds.” Proceedings of the National Academy of Sciences of the United States of America 118: e2024463118. - PMC - PubMed
    1. Agrawal, A. A. , and Hastings A. P.. 2023. “Tissue‐Specific Plant Toxins and Adaptation in a Specialist Root Herbivore.” Proceedings of the National Academy of Sciences of the United States of America 120: e2302251120. - PMC - PubMed
    1. Alani, M. L. , Younkin G. C., Mirzaei M., Kumar P., and Jander G.. 2021. “Acropetal and Basipetal Cardenolide Transport in Erysimum cheiranthoides (Wormseed Wallflower).” Phytochemistry 192: 112965. - PMC - PubMed
    1. Alexa, A. , and Rahnenfuhrer J.. 2023. “topGO: Enrichment Analysis for Gene Ontology.”

LinkOut - more resources