

Comprehensive Analysis of Treatment Approaches in Chest Wall Ewing Sarcoma: The Impact of Tumor Volume on Oncologic Outcomes
- PMID: 40103664
- PMCID: PMC11919283
- DOI: 10.1016/j.adro.2025.101729
Comprehensive Analysis of Treatment Approaches in Chest Wall Ewing Sarcoma: The Impact of Tumor Volume on Oncologic Outcomes
Abstract
Purpose: Local treatment with surgery (S) and radiation therapy (RT) for chest wall Ewing sarcoma (cwES) is often challenging given the extent of the tumor and the aggressiveness of local treatments needed for cure. We report tumor and treatment characteristics, oncologic outcomes, and toxicities of patients with cwES at 2 centers of a single institution.
Methods and materials: Consecutive patients with cwES treated from 1997 to 2022 were retrospectively reviewed. All patients were treated with standard 5-drug chemotherapy (vincristine, doxorubicin, cyclophosphamide, alternating with ifosfamide and etoposide) before initiation of local therapy. Local treatment was S, RT, or both. The decision on modality and timing was determined by a multidisciplinary sarcoma group or by consensus between sarcoma experts regarding patient preferences.
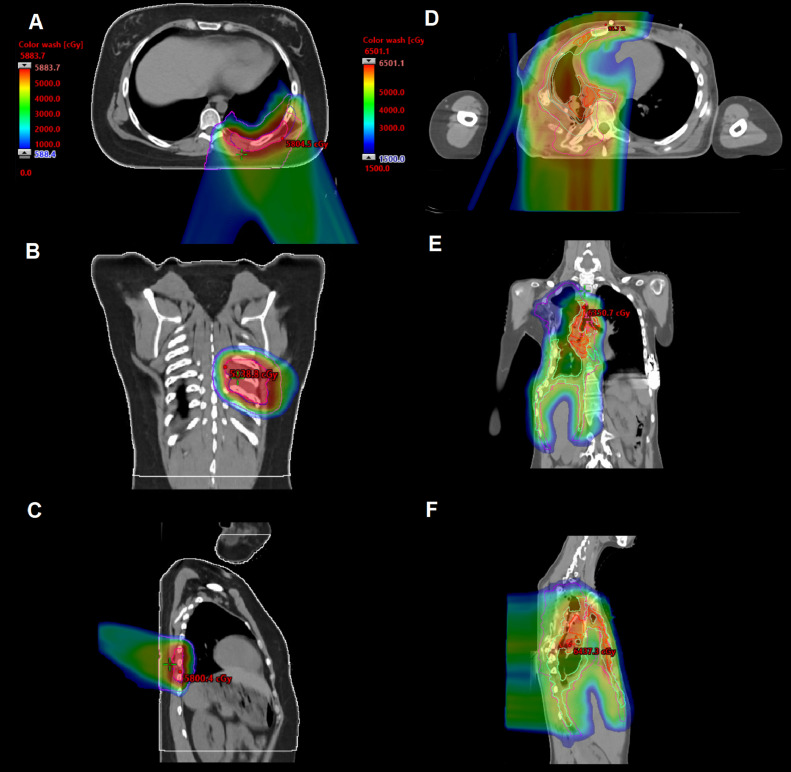
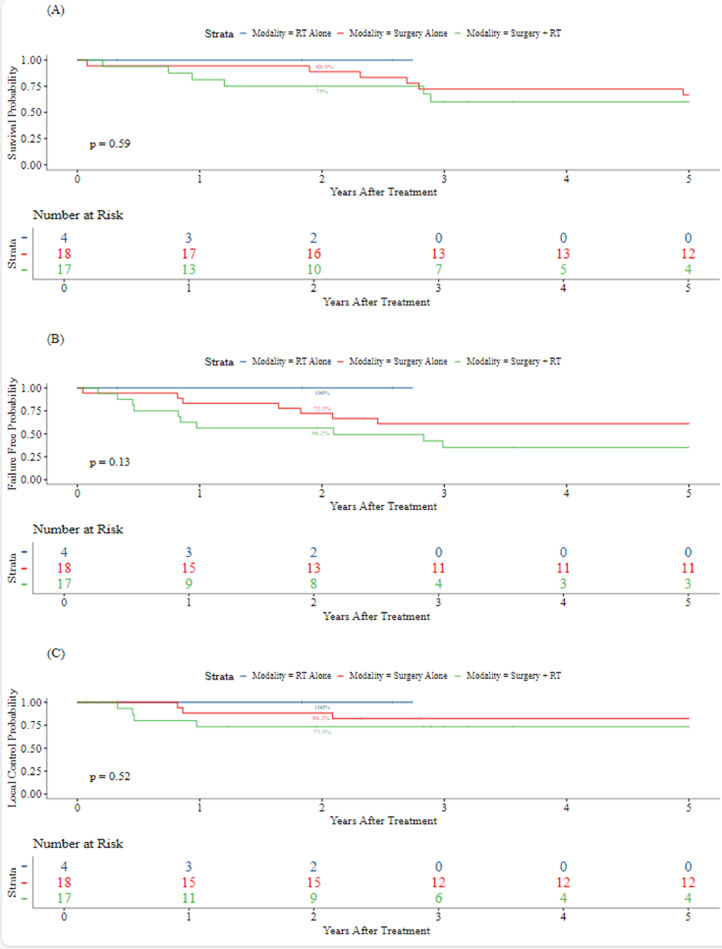
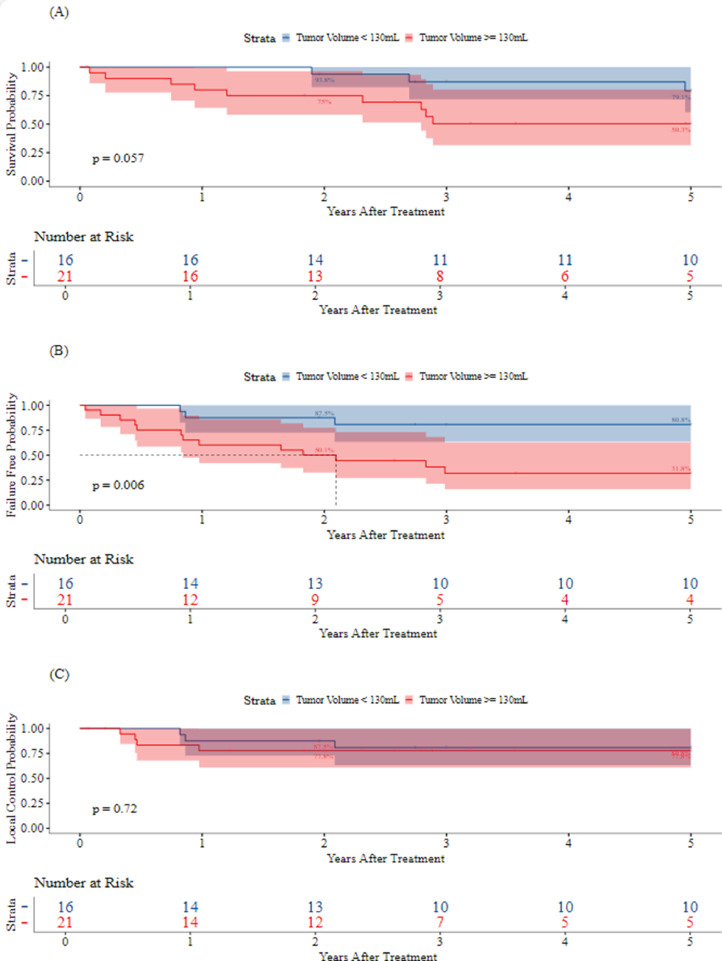
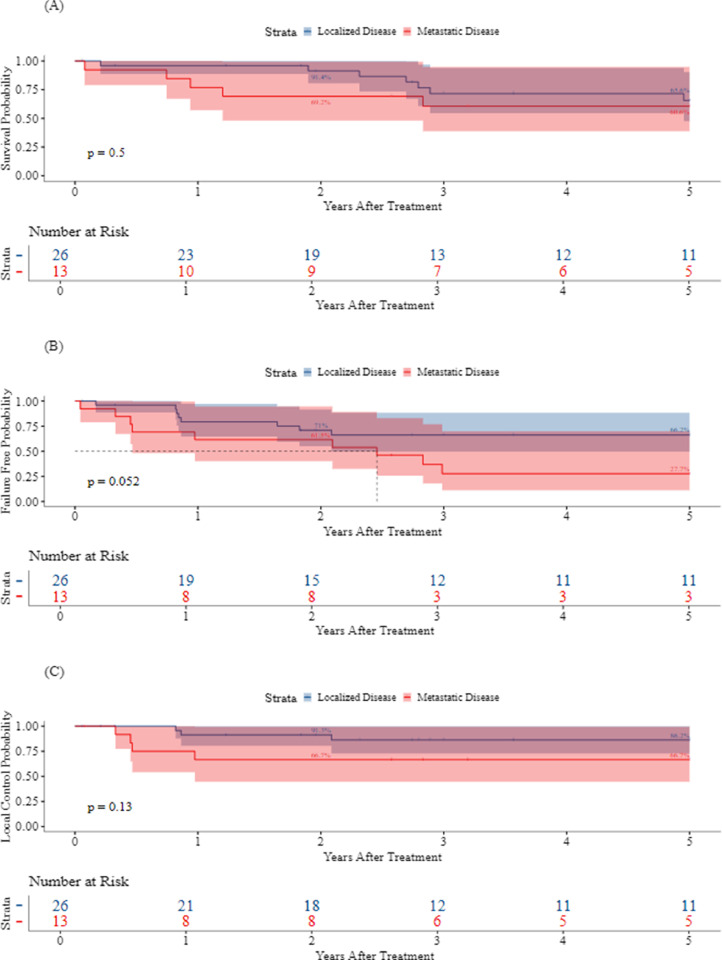
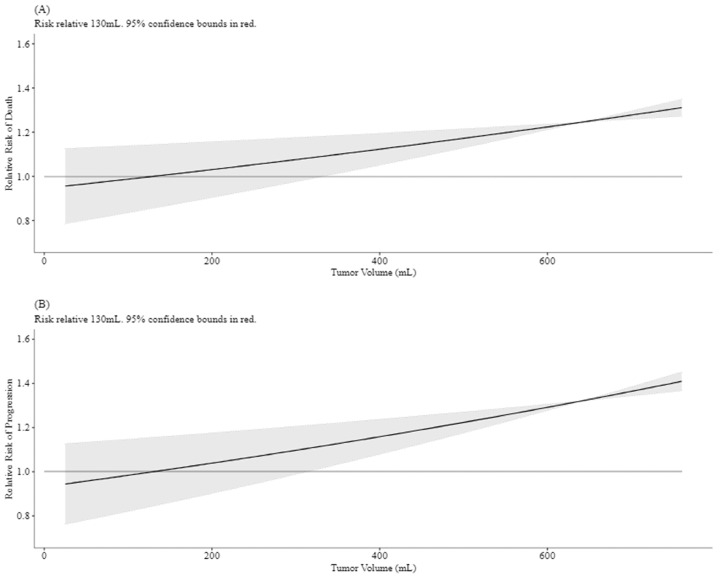
Results: The cohort consisted of 39 patients. The median age at diagnosis was 19.2 years (range, 3.5-53.6 years). Median tumor volume (TV) was 235.5 mL (range, 5.3-6761.9 mL). The local control (LC) modality was S in 18 patients (46%), RT in 4 (10%), and S + RT in 17 (44%). Four (10%) patients treated with S + RT had R1 margins. The median follow-up was 3.2 years (range, 0.1-21.6 years). Grade 3 radiation-associated toxicity relative to the RT modality was 16.7% and 7.1% for photons (n = 6) and protons (n = 14), respectively. The 2-year LC by modality was 100% for RT (95% CI, 100%-100%), 88.2% (95% CI, 74.2%-100%) for S, and 73.3% (95% CI, 54.0%-99.5%) for S + RT. The 5-year LC, failure-free survival, and overall survival for all patients were 79.7% (95% CI, 67.3%-94.4%), 52.3% (95% CI, 38.1%-71.9%), and 64.2% (95% CI, 49.6%-83.1%), respectively. In univariate and multivariate analysis, TV ≥ 130 mL was associated with a significantly worse 5-year failure-free survival (31.8% TV ≥ 130 mL vs 80.8% TV < 130 mL; hazard ratio, 4.94, p = .013 and adjusted hazard ratio, 5.43; 95% CI, 1.28-22.98; p = .022). The multivariate model was adjusted for age, metastatic disease at diagnosis, and S.
Conclusions: Outcomes for cwES tumors are highly dependent on tumor size, even with the use of combined modality local therapy. With early follow-up, smaller tumors may be well controlled with either S or RT.
© 2025 The Author(s).
Conflict of interest statement
The authors declare that they have no known competing financial interests or personal relationships that could have appeared to influence the work reported in this paper.
Figures
Similar articles
-
Local control in pelvic Ewing sarcoma: analysis from INT-0091--a report from the Children's Oncology Group.J Clin Oncol. 2006 Aug 20;24(24):3838-43. doi: 10.1200/JCO.2006.05.9188. J Clin Oncol. 2006. PMID: 16921035 Clinical Trial.
-
Chest wall Ewing sarcoma family of tumors: long-term outcomes.Int J Radiat Oncol Biol Phys. 2011 Sep 1;81(1):158-66. doi: 10.1016/j.ijrobp.2010.04.066. Epub 2010 Aug 21. Int J Radiat Oncol Biol Phys. 2011. PMID: 20732765
-
Radiation Therapy Dose Escalation in Unresectable Ewing Sarcoma: Final Results of a Phase 3 Randomized Controlled Trial.Int J Radiat Oncol Biol Phys. 2022 Aug 1;113(5):996-1002. doi: 10.1016/j.ijrobp.2022.04.024. Epub 2022 May 11. Int J Radiat Oncol Biol Phys. 2022. PMID: 35568246 Clinical Trial.
-
Long-term follow up of high-dose chemotherapy with autologous stem cell rescue in adults with Ewing tumor.Am J Clin Oncol. 2005 Jun;28(3):301-9. doi: 10.1097/01.coc.0000156921.28880.e1. Am J Clin Oncol. 2005. PMID: 15923805 Review.
-
Clinical characteristics of primary cutaneous and subcutaneous Ewing sarcoma.Jpn J Clin Oncol. 2023 Jun 29;53(7):604-610. doi: 10.1093/jjco/hyad031. Jpn J Clin Oncol. 2023. PMID: 37093679 Review.
References
-
- Indelicato DJ, Keole SR, Lagmay JP, et al. Chest wall ewing sarcoma family of tumors: long-term outcomes. Int J Radiat Oncol Biol Phys. 2011;81:158–166. - PubMed
-
- Indelicato DJ, Vega RBM, Viviers E, et al. Modern therapy for chest wall Ewing sarcoma: an update of the University of Florida experience. Int J Radiat Oncol Biol Phys. 2022;113:345–354. - PubMed
-
- Shamberger RC, Grier HE. Ewing's sarcoma/primitive neuroectodermal tumor of the chest wall. Semin Pediatr Surg. 2001;10:153–160. - PubMed
-
- Thomas PR, Foulkes MA, Gilula LA, et al. Primary Ewing's sarcoma of the ribs: A report from the intergroup Ewing's sarcoma study. Cancer. 1983;51:1021–1027. - PubMed
-
- R Core Team . R Foundation for Statistical Computing; Vienna: 2010. R: A language and environment for statistical computing.
LinkOut - more resources
Full Text Sources
