. 2025 Mar 10;16(15):6443-6449.
doi: 10.1039/d5sc00749f. eCollection 2025 Apr 9.

Contrasting effects of mismatch locations on Z-DNA formation under bending force

Affiliations

Contrasting effects of mismatch locations on Z-DNA formation under bending force

SoJung Park et al. Chem Sci. .

Abstract

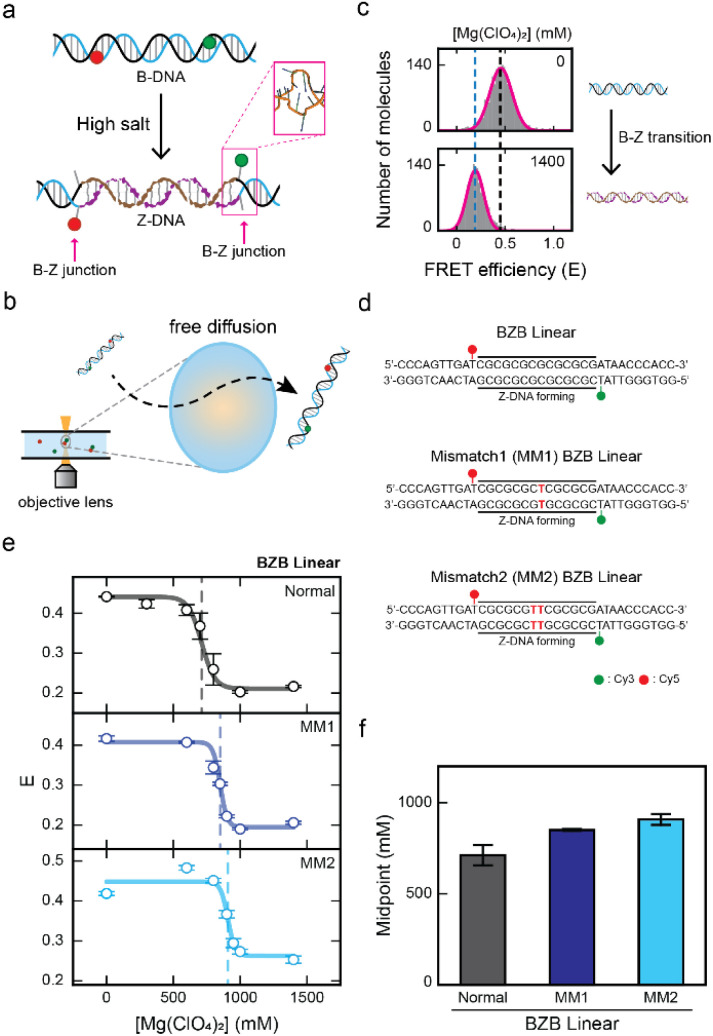
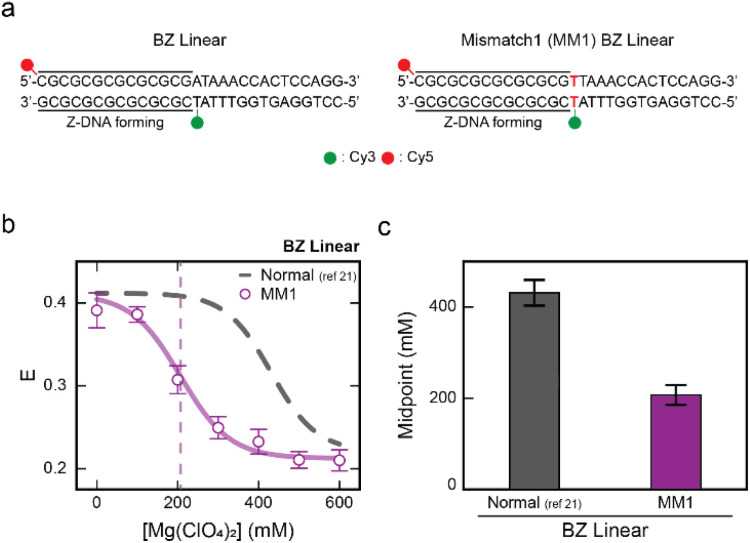
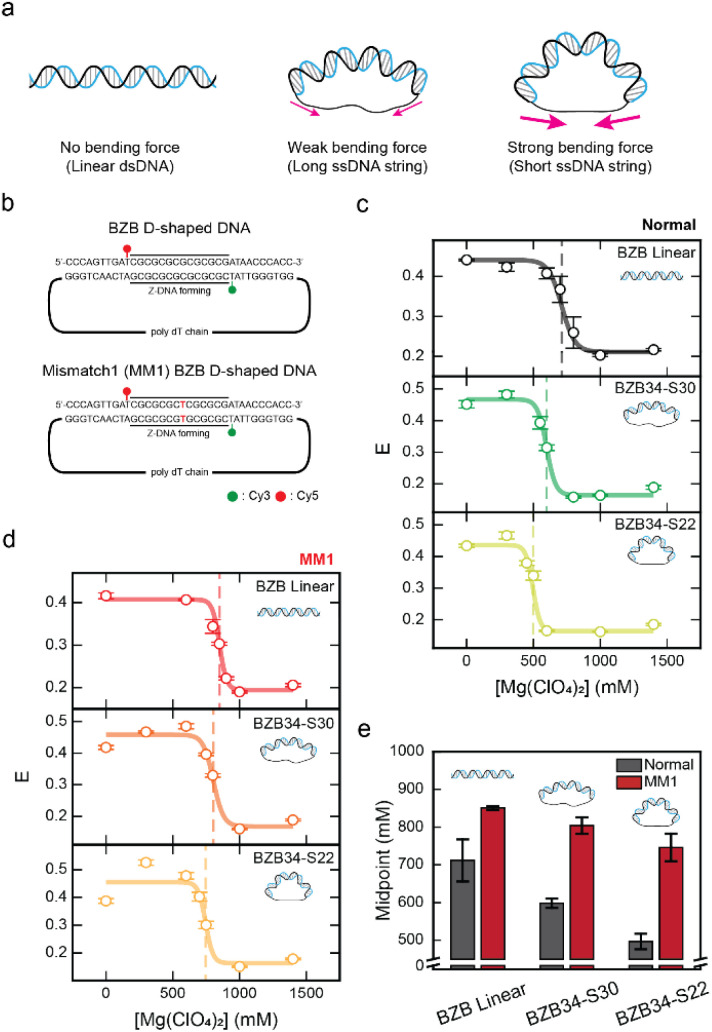
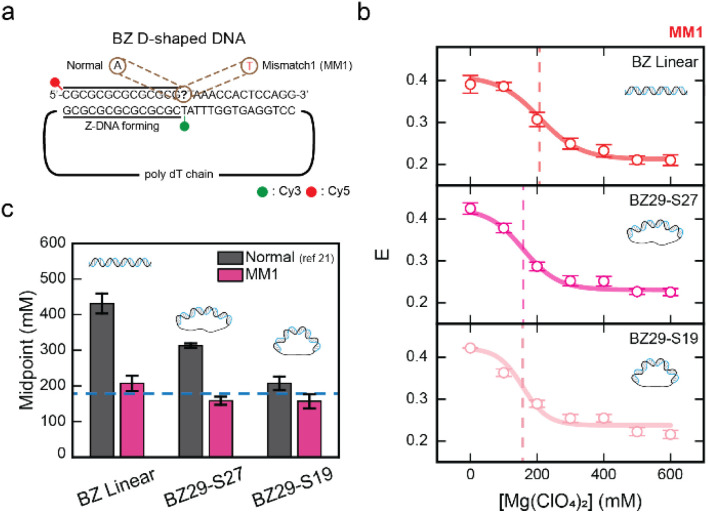
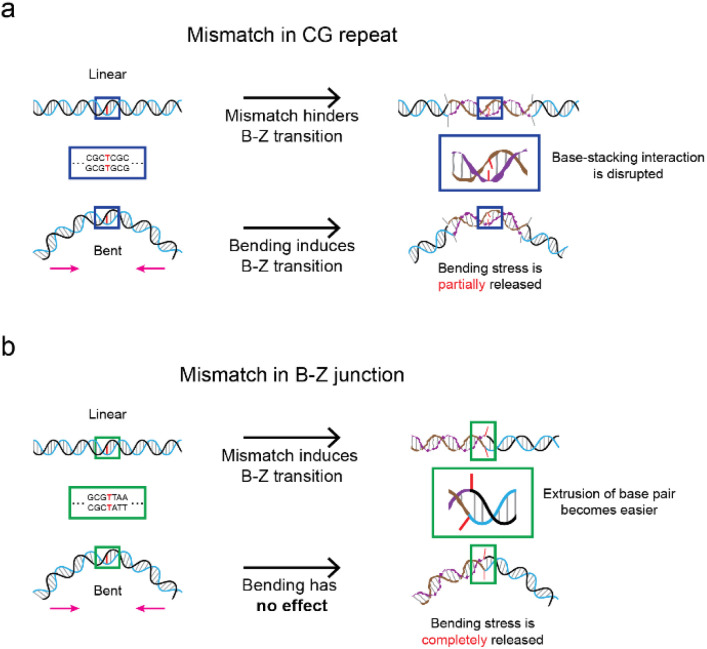
Z-DNA is a non-canonical, left-handed helical structure that plays crucial roles in various cellular processes. DNA mismatches, which involve the incorporation of incorrect Watson-Crick base pairs, are present in all living organisms and contribute to the mechanism of Z-DNA formation. However, the impact of mismatches on Z-DNA formation remains poorly understood. Moreover, the combined effect of DNA mismatches and bending, a common biological phenomenon observed in vivo, has not yet been explored due to technological limitations. Here, using single-molecule FRET, we show that a mismatch inside the Z-DNA region, i.e., the CG repeat region, hinders Z-DNA formation. In stark contrast, however, a mismatch in the B-Z junction facilitates Z-DNA formation. When the bending force is applied on double stranded DNA, a mismatch in the B-Z junction releases the bending stress more effectively than one in the CG repeat region. These findings provide mechanical insights into the role of DNA mismatches and bending forces in regulating Z-DNA formation, whether promoting or inhibiting it in biological environments.


Conflict of interest statement

There are no conflicts to declare.

Figures

Fig. 1
Fig. 1. Observing the effect of a mismatch in the CG repeat region for Z-DNA formation by single-molecule FRET measurement. (a) Illustration of the B–Z transition in the linear dsDNA that consists of a Z-DNA forming region that is flanked by two random sequences at both ends. Z-DNA formation is accompanied by two B–Z junctions with an extruded base pair (pink rectangle, PDB code 2ACJ). (b) Brief schematic illustration of the ALEX measurement, which detects the FRET efficiency of freely diffusing single molecules that pass through the confocal excitation volume. (c) The FRET histograms of the linear dsDNA undergoing the B–Z transition. The low-FRET peak represents Z-DNA and the high-FRET peak represents B-DNA of the BZB linear sample. (d) DNA sequences used for the experiments. The BZB linear sample consists of the CG repeat, a Z-DNA forming region, with two random sequences at both ends. Mismatched base pairs are substituted within the CG repeat region and indicated in red color. Cy3 and Cy5 were used as a FRET pair. (e) The average FRET efficiency (E) of each linear dsDNA sample (BZB linear, MM1 BZB linear, and MM2 BZB linear) plotted against the concentration of Mg(ClO4)2. The dotted lines denote the midpoint of each sample. Error bars were obtained from three independent measurements. (f) B–Z transition midpoints for each sample were obtained from (e). As the number of the mismatches in the CG repeat increases, the B–Z transition midpoint increases. Error bars were obtained from three independent measurements.
Fig. 2
Fig. 2. Mismatch at the B–Z junction facilitates Z-DNA formation. (a) DNA sequences used for the experiments. The BZ linear sample consists of the CG repeat, a Z-DNA forming region, and one random sequence. Z-DNA formation is accompanied by one B–Z junction. A mismatched base pair is substituted in the B–Z junction and indicated in red color (right panel). Cy3 and Cy5 were used as a FRET pair. (b) The E of each linear dsDNA sample (BZ linear and MM1 BZ linear) plotted against the concentration of Mg(ClO4)2. Data for E of the BZ linear sample was obtained from the previous work for comparison. The dotted line denotes the midpoint of the MM1 BZ linear sample. Error bars were obtained from three independent measurements. (c) B–Z transition midpoints of the BZ linear sample and MM1 BZ linear sample. The midpoints for each sample were obtained from (b). Mismatch at the B–Z junction significantly decreases the B–Z transition midpoint. Error bars were obtained from three independent measurements.
Fig. 3
Fig. 3. The effect of DNA bending on the B–Z transition with a mismatch in the Z-DNA forming region. (a) Illustration of linear dsDNA and D-shaped DNA nanostructures. The linear dsDNA has no bending force. In the D-shaped DNA nanostructures, the long ssDNA string length exerts a weaker bending force on the dsDNA portion, whereas the short ssDNA string length exerts a stronger bending force. (b) Schematic of the D-shaped DNA sequences used for the experiments. The dsDNA portion has the same sequence as the linear dsDNA samples shown in Fig. 1d. The bending force on the dsDNA portion was controlled by using different lengths of the ssDNA string that consists only of thymine. (c) The E of the normal linear dsDNA sample (BZB linear) and each normal D-shaped DNA sample (BZB34-S30 and BZB34-S22) plotted against the concentration of Mg(ClO4)2. The dotted lines denote the midpoint of each sample. Error bars were obtained from three independent measurements. (d) The E of the MM1 linear dsDNA sample (MM1 BZB linear) and MM1 D-shaped DNA samples (MM1 BZB34-S30 and MM1 BZB34-S22) plotted against the concentration of Mg(ClO4)2. The dotted lines denote the midpoint of each sample. Error bars were obtained from three independent measurements. (e) Comparison of the B–Z transition midpoint of the BZB linear and BZB D-shaped DNAs of normal and MM1 samples. B–Z transition midpoints for each sample were obtained from (c) and (d). As the bending force increases, the difference between the B–Z transition midpoint of the normal and MM1 samples becomes larger. Error bars were obtained from three independent measurements.
Fig. 4
Fig. 4. The effect of DNA bending on the B–Z transition with a mismatch at the B–Z junction. (a) Schematic of the D-shaped DNA sequences used for the experiments. The dsDNA portion has the same sequence as the linear dsDNA samples shown in Fig. 2a. The bending force on the dsDNA portion was controlled by using different lengths of the ssDNA string that consists only of thymine. (b) The E of the MM1 linear dsDNA sample (MM1 BZ linear) and MM1 D-shaped DNA samples (MM1 BZ29-S27 and MM1 BZB29-S19) plotted against the concentration of Mg(ClO4)2. The dotted lines denote the midpoint of each sample. Error bars were obtained from three independent measurements. (c) Comparison of the B–Z transition midpoint of the BZ linear and BZ D-shaped DNAs of normal and MM1 samples. The B–Z transition midpoints for the normal samples were obtained from the previous work for comparison. For MM1 samples, a weak bending force slightly decreases the B–Z transition midpoint, but increasing the bending force has a negligible effect on the B–Z transition. Error bars were obtained from three independent measurements.
Fig. 5
Fig. 5. Illustration of the proposed B–Z transition mechanism when the mismatch is in different locations. (a) Proposed B–Z transition mechanism when the mismatch is in the CG repeat region. For a linear DNA, the mismatch in the CG repeat region disrupts the base-stacking interactions, which hinders the formation of Z-DNA. Bending induces the formation of Z-DNA, but its effect becomes less significant by the mismatch in the CG repeat region due to partial release of bending stress. (b) Proposed B–Z transition mechanism when the mismatch is in the B–Z junction. For a linear DNA, the mismatch in the B–Z junction lowers the energy cost of a base-pair extrusion, inducing Z-DNA formation. Under the bending force, the mismatch in the B–Z junction has negligible effect on inducing Z-DNA formation as the extrusion of the base pair becomes easier.

Similar articles

References

    1. Choi J. Majima T. Chem. Soc. Rev. 2011;40:5893–5909. doi: 10.1039/C1CS15153C. - DOI - PubMed
    1. Pohl F. M. Jovin T. M. J. Mol. Biol. 1972;67:375–396. doi: 10.1016/0022-2836(72)90457-3. - DOI - PubMed
    1. Wang A. H. J. Quigley G. J. Kolpak F. J. Crawford J. L. van Boom J. H. van der Marel G. Rich A. Nature. 1979;282:680–686. doi: 10.1038/282680a0. - DOI - PubMed
    1. Rich A. Gene. 1993;135:99–109. doi: 10.1016/0378-1119(93)90054-7. - DOI - PubMed
    1. Rich A. Zhang S. Nat. Rev. Genet. 2003;4:566–572. doi: 10.1038/nrg1115. - DOI - PubMed

LinkOut - more resources