. 2025 Mar 4:16:1515430.
doi: 10.3389/fimmu.2025.1515430. eCollection 2025.

Chromatin changes associated with neutrophil extracellular trap formation in whole blood reflect complex immune signaling

Affiliations

Chromatin changes associated with neutrophil extracellular trap formation in whole blood reflect complex immune signaling

Justin Cayford et al. Front Immunol. .

Abstract

Background: Neutrophils are key players in innate immunity, forming neutrophil extracellular traps (NETs) to defend against infections. However, excess NET formation is implicated in inflammatory conditions such as sepsis and immunothrombosis. Studying NET formation in isolated neutrophils provides important mechanistic insights but does not reflect the complexity of immune interactions in whole blood, limiting our understanding of neutrophil responses.

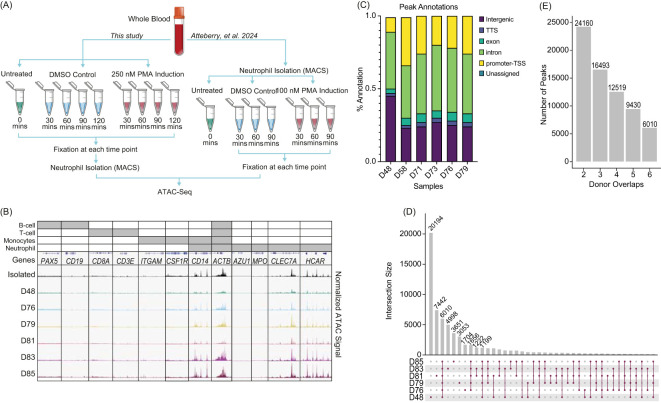
Methods: This study investigates chromatin accessibility changes using Assay for Transposase-Accessible Chromatin with sequencing (ATAC-Seq) during phorbol 12-myristate 13-acetate (PMA) induced NET formation in whole blood. We compared chromatin accessibility patterns in neutrophils following PMA treatment in isolation and whole blood to assess the impact of other immune cells and signaling environment.

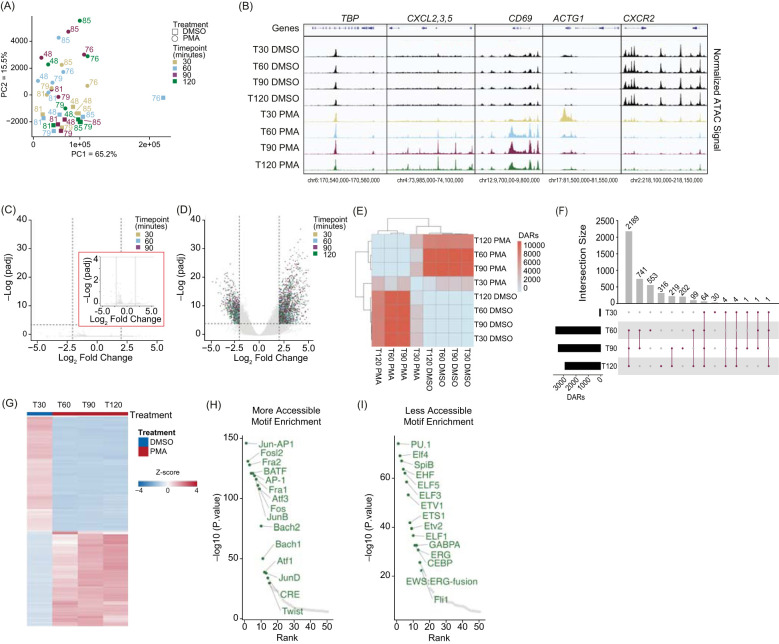
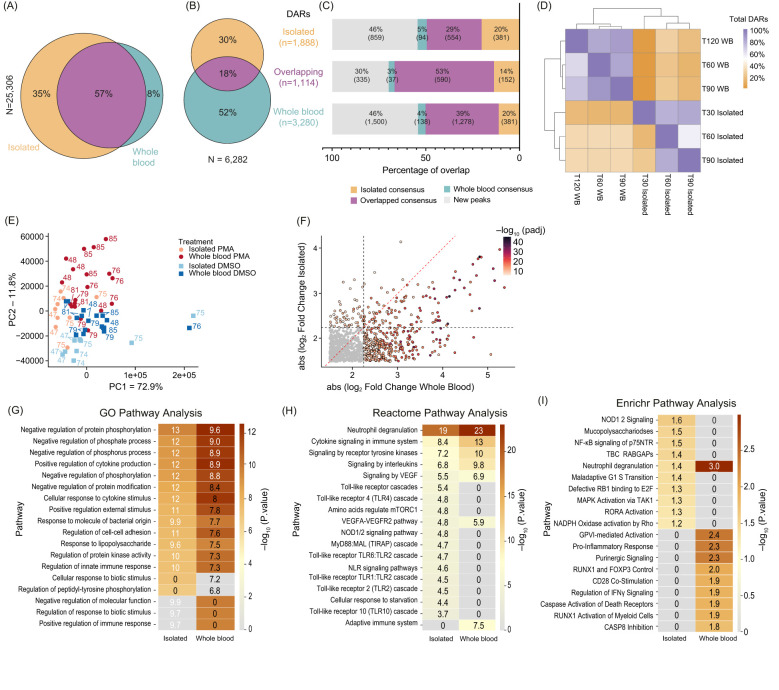
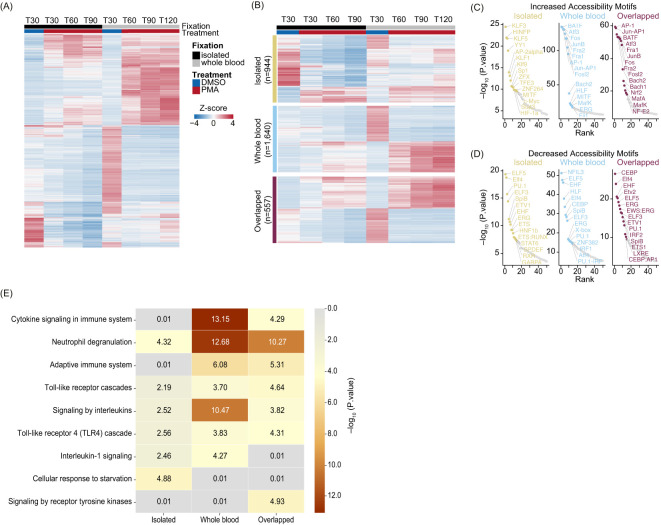
Results: Whole blood PMA stimulation elicited consistent chromatin accessibility changes across donors, demonstrating organized chromatin decondensation during NET formation. The chromatin response was characterized by increased accessibility in genomic regions enriched for immune-specific pathways, highlighting the role of immune cell interactions in NET formation. Differentially accessible regions (DARs) present following PMA induction in whole blood and isolated neutrophils showed greater association with NET-related and inflammatory transcription factors, while DARs specific to isolated neutrophils showed fewer relevant motifs. Pathway analysis indicated that whole blood responses involved more robust activation of immune-specific pathways, such as interleukin and cytokine signaling, compared to isolated neutrophils.

Conclusions: Our findings underscore the importance of studying NET formation within a whole blood environment to capture the complexity of neutrophil responses and immune cell interactions. This understanding is crucial for identifying effective therapeutic targets in NET-associated inflammatory diseases.

Keywords: ATAC-seq; NET formation; NETosis; PMA; chromatin; innate immune system; sepsis.


Conflict of interest statement

All authors are employees or contractors for VolitionRx. BA, JC, AS-T, AR, BB, and TK hold stock in VolitionRx. JC, BA, BB and TK are inventors on patent applications associated with the work described.

Figures

Figure 1
Figure 1
Neutrophils fixed in whole blood prior to isolation shows consistency across donors: (A) Experimental schematic. Left - Whole blood was collected, formaldehyde fixed and then isolated using the MACSexpress Whole Blood Neutrophil Isolation Kit for humans (Miltenyi Biotec #130-104-434). The whole blood was either untreated (n=6), stimulated with 250 nM phorbol 12-myristate 13-acetate (PMA) or dimethyl sulfoxide (DMSO) for the given time, fixed, isolated, followed by ATAC-Seq. Right – Data from isolated neutrophils was previously described and is shown here for clarity (23). (B) Merged replicate tracks visualized using the IGV Genome Browser with untreated healthy donors (n=6). Neutrophils isolated prior to fixation (top) (23) and whole blood fixed prior to isolation (D48, D78, D79, D81, D83, D85) are shown below. Top bars (grey) indicate loci specific to different immune cells: Housekeeping (all) – ACTB; B-cell (PAX5 and CD19), T-cell (CD8A and CD3E), monocytes (ITGAM, CSF1R, and CD14), and neutrophils (accessible regions – CD14, CLEC7A, and HCAR; inaccessible regions – AZU1 and MPO). (C) The location of peaks (MACS2 peaks (q < 0.01)) across genome structures was generated using nf-core/atacseq. Peaks annotations are plotted as a percentage of all peaks found within a sample (Transcription start site (TSS), Transcript termination sites (TTS)). (D) UpSetR plot for untreated whole blood fixed samples shows the peak intersections across donors. (E) The number of peaks that are shared across a given number of n=6 donors.
Figure 2
Figure 2
PMA stimulation drives a stable chromatin response in whole blood fixed neutrophils: (A) Principal Component Analysis (PCA) based on unbiased clustering of dimethyl sulfoxide (DMSO) versus phorbol 480 12-myristate 13-acetate (PMA) using the merged replicate data. Timepoints are indicated by color (T30 – gold, T60 – blue, T90 – purple, T120 - green). Treatment is indicated by squares (DMSO) or circles (PMA). PC1 (x-axis) represents 65.2% of the total variance and PC2 (y-axis) represents 15.5% of variance. Donor numbers are indicated by the number adjacent to the datapoint. (B) Merged donor tracks visualized using IGV genome browser. T30, T60, T90, and T120 DMSO (black), T30 PMA (gold), T60 PMA (blue), T90 PMA (purple), T120 PMA (green) at various loci. Housekeeping gene TBP, increased accessibility at the CXCL2, 3, 5 locus (T60-T120), bimodal response shown at ACTG1, and decreased accessibility at CXCR2. (C) Volcano plot comparing T30 DMSO with T60, T90, and T120 DMSO. DESeq2 was used for a pairwise comparison and then plotted. The -log10(p.adj) value is graphed on the y-axis and Log2(fold change) is indicated on the x-axis. Inset graph (red outline) is zoomed in at the y-axis from 0-4 (-log(padj)). Dashed lines indicated significance thresholds (log2(Fold change) > 2.5 or < -2.5 and -log10(p.adj) > 4). There were no significant values (-log10(p.adj) > 4). (D) Similar to (B) but comparing T30 DMSO vs. T30, T60, T90, and T120 PMA. Significant values (-log10(p.adj) > 4) were separated by timepoint. T30 – yellow, T60 – blue, T90 – purple, T120 – green. (E) Heatmap showing the total number of differential accessible regions (DARs) between all pairwise comparisons (each timepoint for each treatment condition) (DESeq2 p.adj > 0.01 and log2(fold change) less than -1.5 or greater than 1.5). (F) UpSetR plot of the differentially accessible regions (DARs) at each timepoint versus T30 DMSO (T30, 60, 90, 120 PMA). (G) Z-score normalized count heatmap of the top 1,000 DARs sorted on DESeq2 p.adj value for T30 DMSO versus PMA at T60, T90, and T120. Treatment is indicated by DMSO (blue) and PMA (red). Columns are organized by treatment and time. Rows are hierarchically clustered. (H) HOMER motifs within DARs that gain accessibility in T60-T1120 PMA compared to T30 DMSO are plotted by by-log10(p.value) on the y-axis and the HOMER rank on the x-axis. The top 50 known motifs were graphed, and the top 15 known motifs based on p.value are annotated in green. (I) Similar to (H), but DARs that have more accessibility in T30 DMSO compared to T60-T120 PMA are shown.
Figure 3
Figure 3
Comparison of chromatin accessibility changes between isolated and whole blood fixed neutrophils: (A) Venn Diagram showing overlaps between consensus peaks of untreated neutrophils (Isolated – orange; Whole blood – teal; Overlapping - purple) (minimum 50% of donors, n=6). Total peaks were 25,306, with percentages for unique and overlapping peaks indicated. (B) Venn Diagram of the DARs (DESeq2 q < 0.01) from Isolated (orange), Whole blood (teal), and Overlapping (purple). The total number of DARs is 6,282. (C) Stack bar plot showing the DARs separated into Isolated only (top, n=1,888), Overlapping (middle, n=1, 114), or Whole blood only (bottom, n=3,280). Bedtools intersect was used to determine the presence of DARs within the consensus peaks from (A). Categories include Isolated Consensus (orange), Overlapping Consensus (purple), Whole Blood Consensus (teal), and New Peaks (gray). Percentages and total DARs are listed within each bar. (D) Heatmap showing the overlap of DARs at each timepoint and condition. This indicates whether the DAR was also found at other timepoints between Isolated and whole blood (WB). The diagonal represents 100% of DARs called at each row, and subsequent values within the row represent the percentage of those DARs found. (E) Principal Component Analysis (PCA) clustering of Dimethyl sulfoxide (DMSO) versus phorbol 12-myristate 13-acetate (PMA) using merged replicate data. Datasets are indicated by color (Isolated PMA – light red, Isolated DMSO – light blue, Whole blood PMA – dark red, and Whole blood DMSO – dark blue). Treatment is indicated by squares (DMSO) or circles (PMA). PC1 (x-axis) represents 72.9% total variance and PC2 (y-axis) represents 11.8%. Donors are indicated adjacent to the datapoint. (F) Plotting the absolute value of DESeq2 log2(foldchange) values of all Overlapping DARs (n=1,114) between Isolated (y-axis) and Whole blood (x-axis). DARs were colored based on the lowest DESeq2 p.adj value between Isolated and Whole blood. Red dashed line indicates y=x and grey dashed lines indicate the Log2(FoldChange) threshold used for significant DARs (2.25). (G) GO pathway analysis of all DARs in Isolated and Whole blood. Each group includes Overlapping DARs. (H) Similar to (G) but Reactome pathway analysis was used. (I) Similar to (G) but Enrichr pathway analysis was used.
Figure 4
Figure 4
Whole blood PMA induction leads to a more complex immune response compared to the isolated system: (A) Heatmap of Z-score normalized count for the top DARs (sorted by p.adj) from Isolated, Whole blood, and Overlapped (n=6,282). T30 DMSO versus PMA at T30 (Isolated - black), T60, T90, and T120 (Whole blood - grey). Treatment is indicated by DMSO (blue) and PMA (red). Columns are organized by treatment and time. Rows were hierarchically clustered and represent different peaks. (B) Heatmap of Z-score normalized count of the top half DARs in each of the categories sorted on DESeq2 p.adj: Isolated (yellow – top; n=944), Whole blood (blue – middle; n=1,640), and Overlapped (purple – bottom; n=557). Treatment is indicated by DMSO (blue), and PMA (red) and fixation is indicated by Isolated (black) and Whole blood (grey). Columns are organized by treatment and time. Rows were hierarchically clustered. (C) HOMER motifs graphed by -log10(p.value) on the y-axis and HOMER rank on the x-axis for DARs which gained accessibility in Isolated (left – yellow), Whole blood (middle – blue), and Overlapped (right – purple). The top 50 known motifs were graphed, and the top 15 known motifs based on p.value are annotated. (D) Similar to (C) but with downregulated DARs that lose accessibility. (E) Reactome Pathway heatmap showing the -Log10(P.value) for each pathway: Isolated (left), Whole blood (middle), and Overlapped (right) DARs.

Similar articles

References

    1. Selders GS, Fetz AE, Radic MZ, Bowlin GL. An overview of the role of neutrophils in innate immunity, inflammation and host-biomaterial integration. Regener Biomater. (2017) 4:55–68. doi: 10.1093/rb/rbw041 - DOI - PMC - PubMed
    1. Papayannopoulos V. Neutrophil extracellular traps in immunity and disease. Nat Rev Immunol. (2018) 18:134–47. doi: 10.1038/nri.2017.105 - DOI - PubMed
    1. Mayadas TN, Cullere X, Lowell CA. The multifaceted functions of neutrophils. Annu Rev Pathol. (2014) 9:181–218. doi: 10.1146/annurev-pathol-020712-164023 - DOI - PMC - PubMed
    1. Rosales C. Neutrophil: A cell with many roles in inflammation or several cell types? Front Physiol. (2018) 9:113. doi: 10.3389/fphys.2018.00113 - DOI - PMC - PubMed
    1. Manda A, Pruchniak MP, Araźna M, Demkow UA. Neutrophil extracellular traps in physiology and pathology. Cent Eur J Immunol. (2014) 39:116–21. doi: 10.5114/ceji.2014.42136 - DOI - PMC - PubMed

LinkOut - more resources