

Radiomic Feature Extraction from OCT Angiography of Idiopathic Epiretinal Membranes and Correlation with Visual Acuity: A Pilot Study
- PMID: 40103834
- PMCID: PMC11919415
- DOI: 10.1016/j.xops.2025.100716
Radiomic Feature Extraction from OCT Angiography of Idiopathic Epiretinal Membranes and Correlation with Visual Acuity: A Pilot Study
Abstract
Purpose: To explore the correlation between radiomics features extracted from OCT angiography (OCTA) of epiretinal membranes (ERMs) and baseline best-corrected visual acuity (BCVA).
Design: Retrospective observational monocentric study.
Participants: Eighty-three eyes affected by idiopathic ERMs, categorized into low (≤70 letters) and high (70 letters) BCVA groups.
Methods: The central 3 × 3 mm2 crop of structural and vascular en-face OCTA scans of superficial and deep retina slab, and choriocapillaris of each eye was selected. PyRadiomics was used to extract 86 features belonging to 2 different families: intensity-based statistical features describing the gray-level distribution, and textural features capturing the spatial arrangement of pixels. By employing a greedy strategy, 4 radiomic features were selected to build the final logistic regression model. The ability of the model to discriminate between low and high baseline BCVA was quantified in terms of area under the receiver operating characteristics curve (AUC).
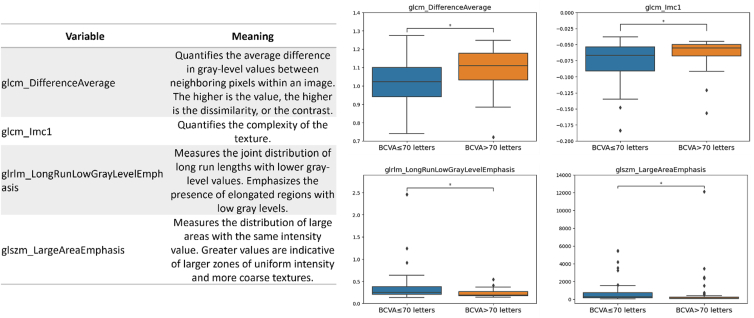
Main outcome measures: The 4 selected informative radiomic features were as follows: the difference average (glcm_DifferenceAverage), quantifying the average difference in gray-level between neighboring pixels; the informational measure of correlation (glcm_Imc1), giving information about the spatial correlation of pixel intensities inside the image; the long run low gray-level emphasis (glrlm_LongRunLowGrayLevelEmphasis), highlighting long segments of low gray-level values within the image; and the large area emphasis (glszm_LargeAreaEmphasis), which quantifies the tendency for larger zones of uniform intensity to occur.
Results: No features exhibited a statistically significant difference between low and high BCVA values for the superficial and deep retinal slabs. Conversely, in the choriocapillaris layer, the glcm_DifferenceAverage and glcm_Imc1 features were significantly higher in the high BCVA group (P = 0.047), whereas higher values for the glrlm_LongRunLowGrayLevelEmphasis and glszm_LargeAreaEmphasis were associated with the low BCVA group (P = 0.047). Overall, these radiomic features predicted BCVA with an AUC (95% confidence interval) of 0.74 (0.63-0.85) and sensitivity/specificity of 0.67/0.75. During the cross-validation, the metrics remained stable.
Conclusions: Radiomics features of the choriocapillaris in idiopathic ERMs showed a correlation with BCVA, with lower structural complexity and higher homogeneity, together with the presence of homogeneous areas with low-intensity pixel values, reflecting flow voids due to reduced microvascular perfusion, and were correlated with lower visual acuity.
Financial disclosures: The author(s) have no proprietary or commercial interest in any materials discussed in this article.
Keywords: Choriocapillaris; Epiretinal membrane; OCT angiography (OCTA); Radiomics.
© 2025 by the American Academy of Ophthalmologyé.
Figures


References
LinkOut - more resources
Full Text Sources
Research Materials
