

Construction and validation of nomogram model for chronic postsurgical pain in patients after total knee arthroplasty: A retrospective study
- PMID: 40103861
- PMCID: PMC11911769
- DOI: 10.12669/pjms.41.3.11525
Construction and validation of nomogram model for chronic postsurgical pain in patients after total knee arthroplasty: A retrospective study
Abstract
Objective: Chronic postsurgical pain (CPSP) after total knee arthroplasty (TKA) is the most common postoperative complication in orthopedics. This study aims to explore the risk factors for CPSP after TKA and construct a nomogram model.
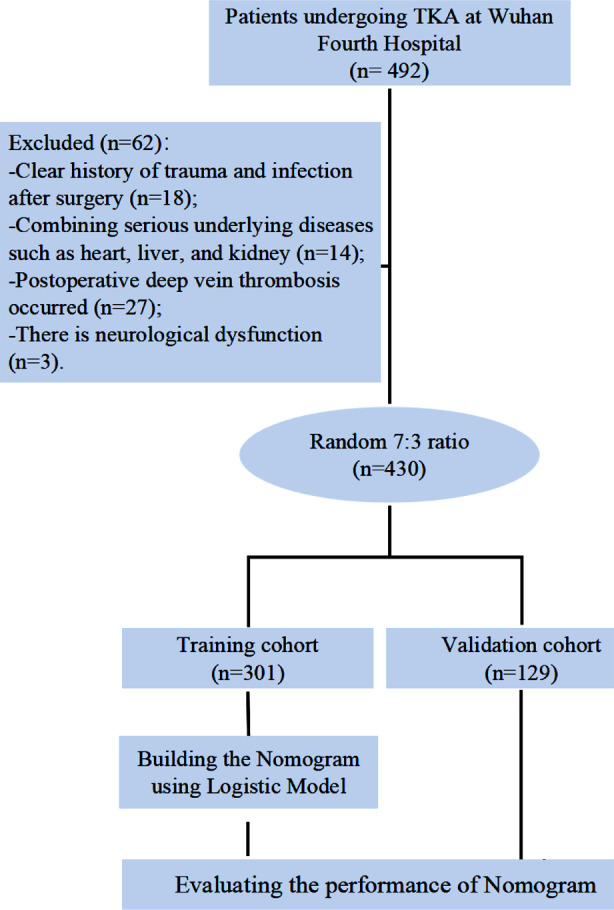
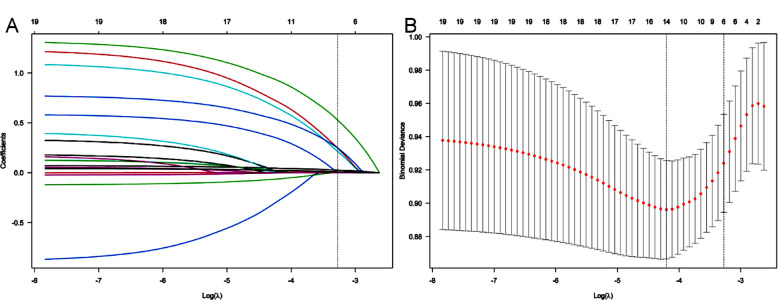
Methods: This retrospective study included clinical records of 430 patients who received TKA treatment at Wuhan Fourth Hospital between January 2020 to January 2024. Patients were randomly divided into a training cohort (n=301) and a validation cohort (n=129) in a 7:3 ratios. The Least Absolute Shrinkage and Selection Operator (LASSO) algorithm and logistic regression analysis were used to identify the independent risk factors, and a predictive nomogram model was established based on the identified risk factors. The concordance index (C-index), calibration curve, receiver operating characteristic (ROC) curve and decision curve analysis were used to assess the predictive accuracy and clinical application value of the nomogram model.
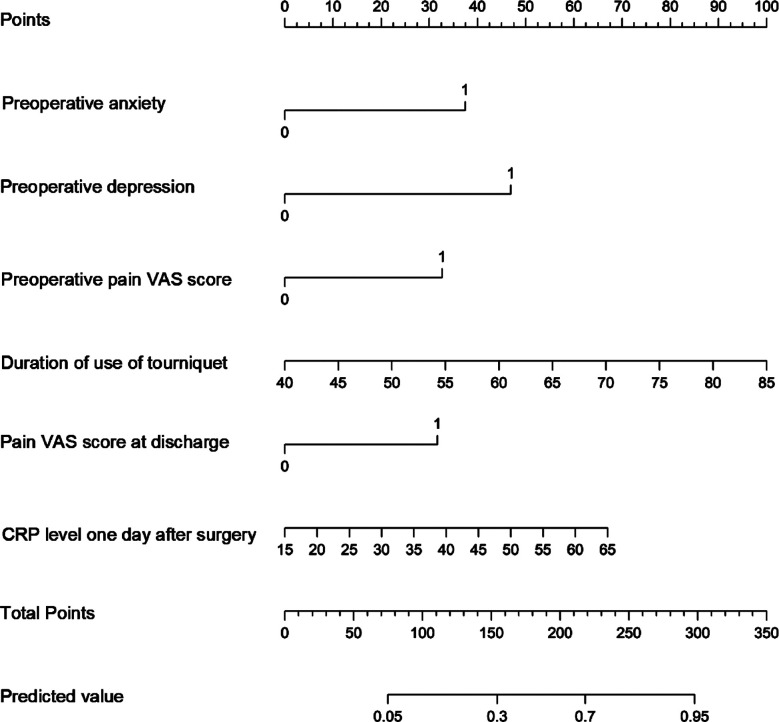
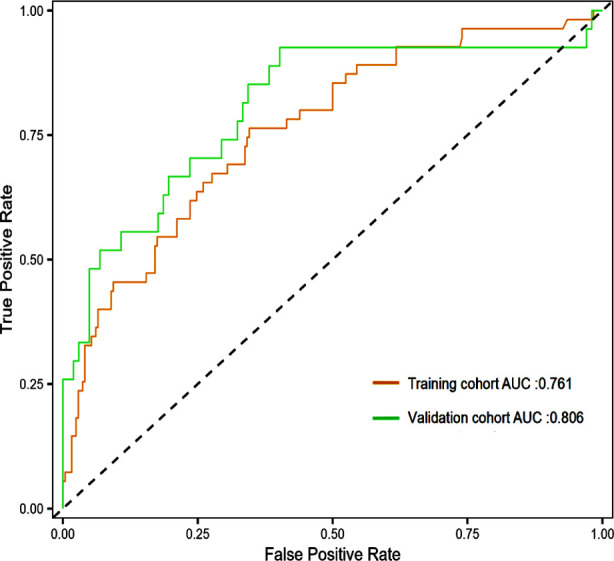
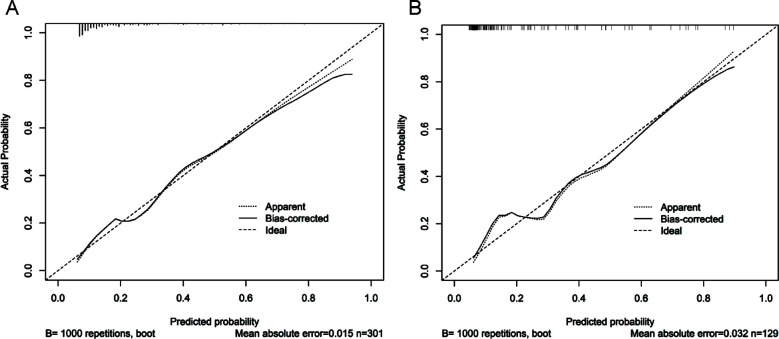
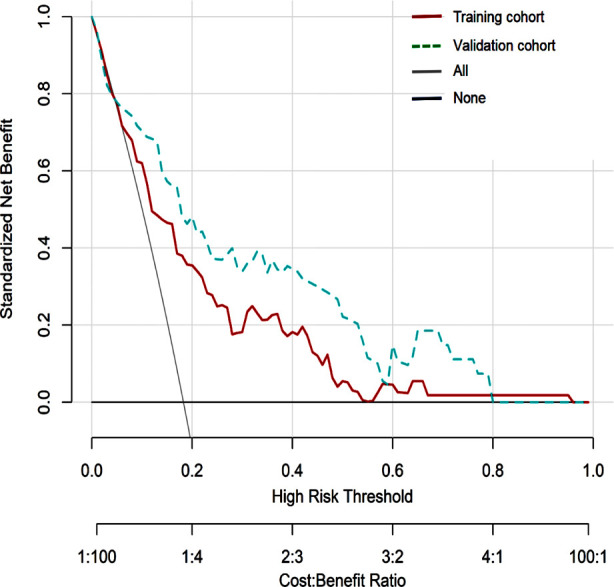
Results: Six risk factors for predicting CPSP were identified, including preoperative anxiety, preoperative depression, preoperative pain, duration of tourniquet use, pain upon discharge, and postoperative C-reactive protein levels. The nomogram model demonstrated sufficient predictive accuracy, with the area under the curve (AUC) values of 0.761 (95% CI: 0.689-0.833) and 0.806 (95% CI: 0.700-0.911) in the training cohort and validation cohort, respectively. The C-index of the training cohort and validation cohort were 0.733 and 0.761, respectively. The calibration curve shows good consistency between the predicted risk of the model and the actual risk of CPSP. Decision curve analysis (DCA) demonstrated the clinical applicability of the model.
Conclusions: The nomogram model established in this study for predicting CPSP after TKA has good predictive value and may be used in clinical practice to identify patients at high risk of developing CPSP after TKA.
Keywords: Chronic postsurgical pain; Nomogram model; Orthopedics; Risk factors; Total knee arthroplasty.
Copyright: © Pakistan Journal of Medical Sciences.
Figures
Similar articles
-
Prediction of 90-Day Local Complications in Patients After Total Knee Arthroplasty: A Nomogram With External Validation.Orthop J Sports Med. 2022 Feb 23;10(2):23259671211073331. doi: 10.1177/23259671211073331. eCollection 2022 Feb. Orthop J Sports Med. 2022. PMID: 35224115 Free PMC article.
-
Factors contributing to 1-year dissatisfaction after total knee arthroplasty: a nomogram prediction model.J Orthop Surg Res. 2022 Jul 28;17(1):367. doi: 10.1186/s13018-022-03205-2. J Orthop Surg Res. 2022. PMID: 35902950 Free PMC article. Clinical Trial.
-
Establishment and validation of a nomogram predicting the risk of deep vein thrombosis before total knee arthroplasty.Thromb J. 2024 Feb 16;22(1):21. doi: 10.1186/s12959-024-00588-6. Thromb J. 2024. PMID: 38365683 Free PMC article.
-
Development and Validation of a Predictive Model for Chronic Postsurgical Pain After Arthroscopic Rotator Cuff Repair: A Prospective Cohort Study.J Pain Res. 2023 Sep 27;16:3273-3288. doi: 10.2147/JPR.S423110. eCollection 2023. J Pain Res. 2023. PMID: 37790188 Free PMC article.
-
Development and Validation of a Nomogram for Evaluating the Incident Risk of Pain Catastrophizing Among Patients Who Have Severe Knee Osteoarthritis Awaiting Primary Total Knee Arthroplasty.J Arthroplasty. 2025 Mar;40(3):602-610. doi: 10.1016/j.arth.2024.09.011. Epub 2024 Sep 14. J Arthroplasty. 2025. PMID: 39284395
References
-
- Price AJ, Alvand A, Troelsen A, Katz JN, Hooper G, Gray A, et al. Knee replacement. Lancet. 2018;392(10158):1672–1682. doi:10.1016/S0140-6736(18)32344-4. - PubMed
-
- Ongel EE, Oksuz M, Cakmak Y, Coskun N, Bakan N. Chronic Pain and Health Related Quality of Life Assessment One Year After Total Knee Arthroplasty. J Coll Physicians Surg Pak. 2023;33(2):176–180. doi:10.29271/jcpsp.2023.02.176. - PubMed
-
- Willinger ML, Heimroth J, Sodhi N, Garbarino LJ, Gold PA, Rasquinha V, et al. Management of Refractory Pain After Total Joint Replacement. Curr Pain Headache Rep. 2021;25(6):42. doi:10.1007/s11916-021-00956-1. - PubMed
LinkOut - more resources
Full Text Sources
Research Materials