

Comparing machine learning classifier models in discriminating cognitively unimpaired older adults from three clinical cohorts in the Alzheimer's disease spectrum: demonstration analyses in the COMPASS-ND study
- PMID: 40103927
- PMCID: PMC11913811
- DOI: 10.3389/fnagi.2025.1542514
Comparing machine learning classifier models in discriminating cognitively unimpaired older adults from three clinical cohorts in the Alzheimer's disease spectrum: demonstration analyses in the COMPASS-ND study
Abstract
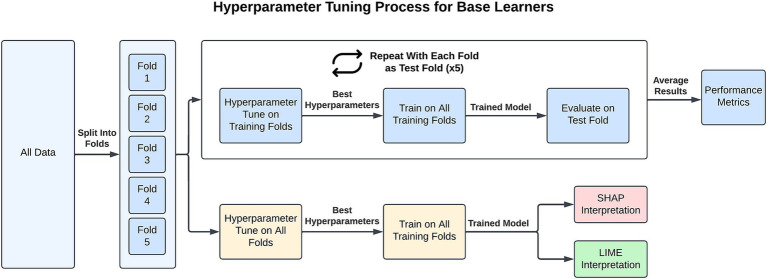
Background: Research in aging, impairment, and Alzheimer's disease (AD) often requires powerful computational models for discriminating between clinical cohorts and identifying early biomarkers and key risk or protective factors. Machine Learning (ML) approaches represent a diverse set of data-driven tools for performing such tasks in big or complex datasets. We present systematic demonstration analyses to compare seven frequently used ML classifier models and two eXplainable Artificial Intelligence (XAI) techniques on multiple performance metrics for a common neurodegenerative disease dataset. The aim is to identify and characterize the best performing ML and XAI algorithms for the present data.
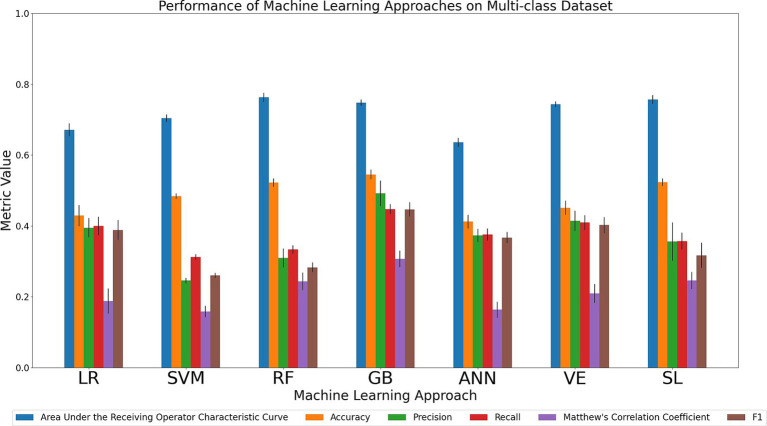
Method: We accessed a Canadian Consortium on Neurodegeneration in Aging dataset featuring four well-characterized cohorts: Cognitively Unimpaired (CU), Subjective Cognitive Impairment (SCI), Mild Cognitive Impairment (MCI), and AD (N = 255). All participants contributed 102 multi-modal biomarkers and risk factors. Seven ML algorithms were compared along six performance metrics in discriminating between cohorts. Two XAI algorithms were compared using five performance and five similarity metrics.
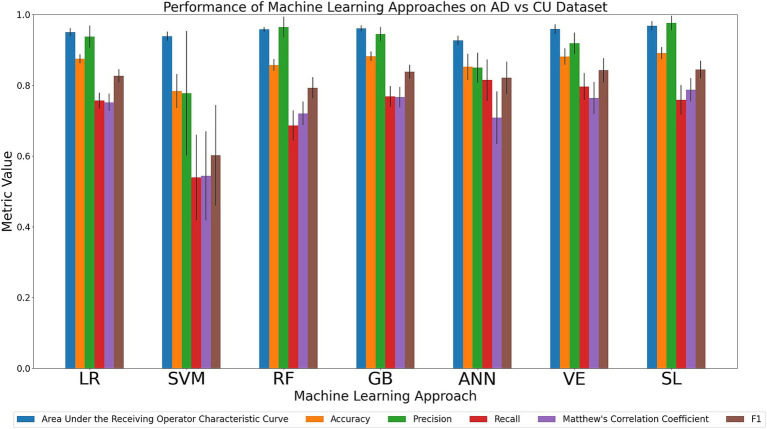
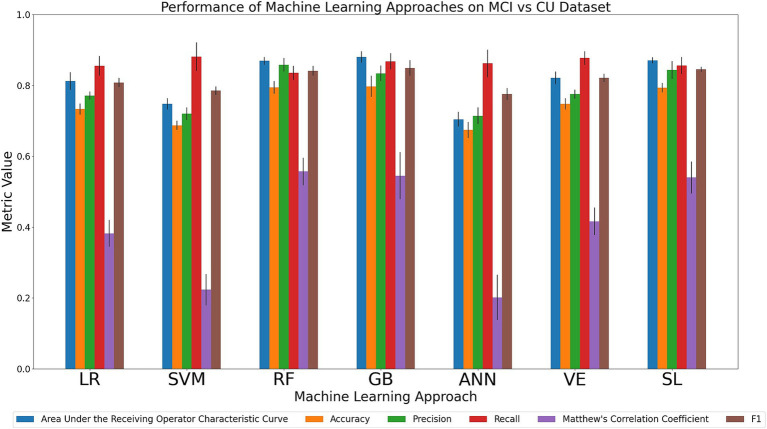
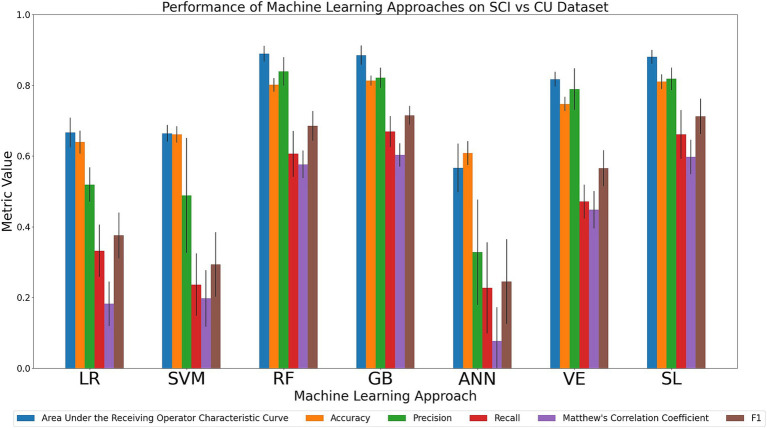
Results: Although all ML models performed relatively well in the extreme-cohort comparison (CU/AD), the Super Learner (SL), Random Forest (RF) and Gradient-Boosted trees (GB) algorithms excelled in the challenging near-cohort comparisons (CU/SCI). For the XAI interpretation comparison, SHapley Additive exPlanations (SHAP) generally outperformed Local Interpretable Model agnostic Explanation (LIME) in key performance properties.
Conclusion: The ML results indicate that two tree-based methods (RF and GB) are reliable and effective as initial models for classification tasks involving discrete clinical aging and neurodegeneration data. In the XAI phase, SHAP performed better than LIME due to lower computational time (when applied to RF and GB) and incorporation of feature interactions, leading to more reliable results.
Keywords: Alzheimer’s disease; Artificial Intelligence; Canadian consortium on neurodegeneration in aging; eXplainable Artificial Intelligence; machine learning; mild cognitive impairment.
Copyright © 2025 Fah, Bohn, Greiner and Dixon.
Conflict of interest statement
The authors declare that the research was conducted in the absence of any commercial or financial relationships that could be construed as a potential conflict of interest. The author(s) declared that they were an editorial board member of Frontiers, at the time of submission. This had no impact on the peer review process and the final decision.
Figures
Similar articles
-
Machine learning analyses identify multi-modal frailty factors that selectively discriminate four cohorts in the Alzheimer's disease spectrum: a COMPASS-ND study.BMC Geriatr. 2023 Dec 11;23(1):837. doi: 10.1186/s12877-023-04546-1. BMC Geriatr. 2023. PMID: 38082372 Free PMC article.
-
Cognitive Speed in Neurodegenerative Disease: Comparing Mean Rate and Inconsistency Within and Across the Alzheimer's and Lewy Body Spectra in the COMPASS-ND Study.J Alzheimers Dis. 2024;100(2):579-601. doi: 10.3233/JAD-240210. J Alzheimers Dis. 2024. PMID: 38875040
-
XGBoost-SHAP-based interpretable diagnostic framework for alzheimer's disease.BMC Med Inform Decis Mak. 2023 Jul 25;23(1):137. doi: 10.1186/s12911-023-02238-9. BMC Med Inform Decis Mak. 2023. PMID: 37491248 Free PMC article.
-
Interpreting artificial intelligence models: a systematic review on the application of LIME and SHAP in Alzheimer's disease detection.Brain Inform. 2024 Apr 5;11(1):10. doi: 10.1186/s40708-024-00222-1. Brain Inform. 2024. PMID: 38578524 Free PMC article. Review.
-
Utilization of model-agnostic explainable artificial intelligence frameworks in oncology: a narrative review.Transl Cancer Res. 2022 Oct;11(10):3853-3868. doi: 10.21037/tcr-22-1626. Transl Cancer Res. 2022. PMID: 36388027 Free PMC article. Review.
References
-
- Aas K., Jullum M., Løland A. (2021). Explaining individual predictions when features are dependent: more accurate approximations to Shapley values. Artif. Intell. 298:103502. doi: 10.1016/j.artint.2021.103502 - DOI
LinkOut - more resources
Full Text Sources
Research Materials