. 2025 Mar 4:17:1498400.
doi: 10.3389/fnagi.2025.1498400. eCollection 2025.

Extreme signal amplitude events in neuromagnetic oscillations reveal brain aging processing across adulthood

Affiliations

Extreme signal amplitude events in neuromagnetic oscillations reveal brain aging processing across adulthood

Vasily A Vakorin et al. Front Aging Neurosci. .

Abstract

Introduction: Neurophysiological activity, as noninvasively captured by electro- and magnetoencephalography (EEG and MEG), demonstrates complex temporal fluctuations approximated by typical variations around the mean values and rare events with large amplitude. The statistical properties of these extreme and rare events in neurodynamics may reflect the limits or capacity of the brain as a complex system in information processing. However, the exact role of these extreme neurodynamic events in ageing, and their spectral and spatial patterns remain elusive. Our study hypothesized that ageing would be associated with frequency specific alterations in the brain's tendency to synchronize large ensembles of neurons and to produce extreme events.

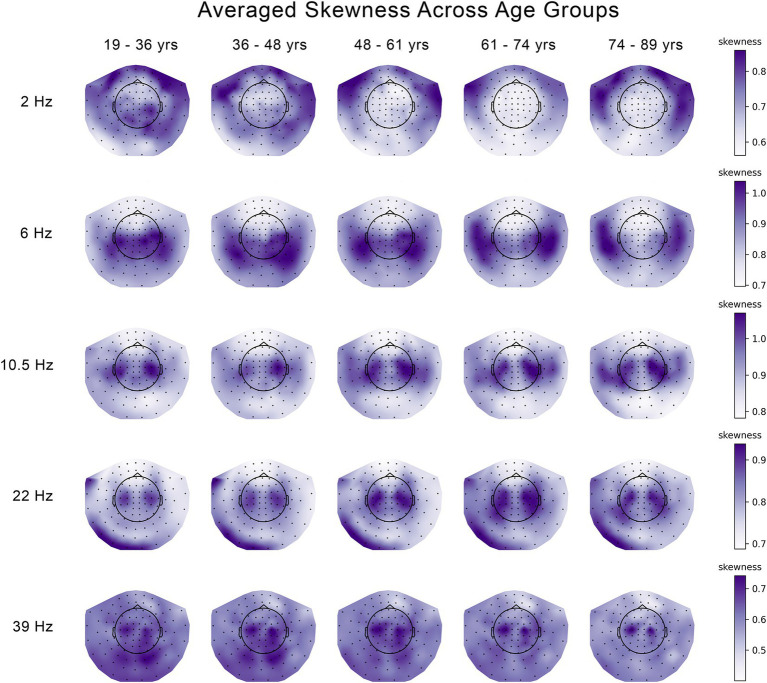
Methods: To identify spatio-spectral patterns of these age-related changes in extreme neurodynamics, we examined resting-state MEG recordings from a large cohort of adults (n = 645), aged 18 to 89. We characterized extreme neurodynamics by computing sample skewness and kurtosis, and used Partial Least Squares to test for differences across age groups.

Results: Our findings revealed that each canonical frequency, from theta to lower gamma, displayed unique spatial patterns of either age-related increases, decreases, or both in the brain's tendency to produce extreme neuromagnetic events.

Discussion: Our study introduces a novel neuroimaging framework for understanding ageing through the extreme and rare events of the neurophysiological activity, offering more sensitivity than typical comparative approaches.

Keywords: ageing; brain rhythms; extreme values; heavy tail distributions; magnetoencephalography; neuronal avalanches; skewed distributions; temporal variability.


Conflict of interest statement

The authors declare that the research was conducted in the absence of any commercial or financial relationships that could be construed as a potential conflict of interest.

Figures

Figure 1
Figure 1
Changes in the kurtosis of the temporal variability of MEG signal across five age groups at 5 frequencies. The median kurtosis across eleven 30 s segments of temporal variability were averaged across subjects and plotted seperately for each age group and each frequency.
Figure 2
Figure 2
Changes in the skewness of the temporal variability of MEG signal across five age groups at 5 frequencies. The median skewness across eleven 30 s segments of temporal variability were averaged across subjects and plotted seperately for each age group and each frequency.
Figure 3
Figure 3
Age-related increases in the skewness and kurtosis of the temporal variability of MEG signal across five age groups at 10.5 Hz. (A) A data-driven overall contrast across the age groups for the skewness. (B) Corresponding distribution of z-scores, each associated with a MEG channel, showing the robustness of contribution of individual MEG channels to the overall contrast. (C) Same z-scores as in (B), shown a spatial distribution of z-scores across MEG channels. (D) Overall contrast across five age groups for the skewness. (E) Corresponding distribution of z-scores for the skewness; and (F) same z-scores as in (E), shown as a topographic map. The contrasts in panels (A,D) represent monotonic age-related changes in the skewness and kurtosis across the five age groups. The corresponding p-values reflecting the significance of overall group differences are provided in the titles of panels (A,D). All the z-scores are positive, which implies that the skewness and kurtosis increase with age. The highest z-scores, which are shown in dark red, indicate the most robust effect.
Figure 4
Figure 4
Age-related increases in the skewness and kurtosis of the temporal variability of MEG signal across five age groups at 2 Hz. (A) Overall group contrast for kurtosis; (B) corresponding distribution of z-scores; (C) same z-scores shown as the topographic maps; (D) overall contrast for skewness; (E) corresponding distribution of z-scores; (F) corresponding spatial distribution of z-scores. The contrasts in (A,D) represent age-related changes in skewness and kurtosis as an inverted U-function. All the z-scores are positive, which implies that the skewness and kurtosis increase across the age groups 19–36 to 61–74 years old (y.o.), and decrease for the age group 74–89 y.o. The highest z-scores indicate the most robust effect.
Figure 5
Figure 5
Age-related changes in the skewness and kurtosis of the temporal variability of MEG signal across five age groups at 6 Hz. (A) Overall group differences (group contrast) for kurtosis; (B) corresponding distribution of z-scores; (C) same distribution of z-scores shown as the topographic map; (D) overall group differences (group contrast) for skewness; (E) corresponding distribution of z-scores; (F) corresponding spatial distribution of z-scores. The contrasts represent a monotonic trend of age-related changes in skewness (A) and kurtosis (D). The largest in magnitude z-scores, positive or negative, indicate the most robust effect. Positive z-scores indicate MEG channels, wherein the kurtosis and skewness and increase with age across the age groups according to (A,D), respectively. Negative z-scores indicate MEG channels, wherein the skewness and kurtosis decrease with age across the age groups according to inversed group contrast (multiplied by −1) in (A,D), respectively.
Figure 6
Figure 6
Age-related changes in the skewness and kurtosis of the temporal variability of MEG signal across five age groups at 22 Hz. (A) Data-driven overall group contrast for kurtosis; (B) corresponding distribution of z-scores; (C) corresponding spatial distribution of z-scores; (D) data-driven overall contrast for skewness; (E) corresponding distribution of z-scores; (F) corresponding spatial distribution of z-scores. The contrasts in (A,D) represent monotonic age-related changes of skewness and kurtosis. There is a mix of positive and negative z-scores, indicating brain areas of increasing and decreasing skewness and kurtosis in aging. Note that the spatial distributions of z-scores, as shown in (C,F) are visually similar to those shown in Figure 5.
Figure 7
Figure 7
Age-related changes in the skewness and kurtosis of the temporal variability of MEG signal across five age groups at 39 Hz. (A) Overall group contrast for kurtosis; (B) corresponding distribution of z-scores; (C) same z-scores shown on the topographic plot; (D) data-driven overall group contrast for skewness; (E) corresponding distribution of z-scores; (F) corresponding spatial distribution of z-scores. The contrasts in (A,D) model age-related changes of skewness and kurtosis as an inverted U-shape. The overall group contrast for kurtosis was not significant. All the z-scores are positive, which implies that skewness increases across age and peaks at around 48–61 y.o and then decreases, whereas kurtosis peaks at 36–48 y.o and then decreases. The highest z-scores indicate the most robust effect.

Similar articles

References

    1. Basalyga G., Salinas E. (2006). When response variability increases neural network robustness to synaptic noise. Neural Comput. 18, 1349–1379. doi: 10.1162/neco.2006.18.6.1349, PMID: - DOI - PubMed
    1. Beggs J. M., Plenz D. (2003). Neuronal avalanches in neocortical circuits. J. Neurosci. 23, 11167–11177. doi: 10.1523/JNEUROSCI.23-35-11167.2003, PMID: - DOI - PMC - PubMed
    1. Brake N., Duc F., Rokos A., Arseneau F., Shahiri S., Khadra A., et al. . (2024). A neurophysiological basis for aperiodic EEG and the background spectral trend. Nat. Commun. 15:1514. doi: 10.1038/s41467-024-45922-8, PMID: - DOI - PMC - PubMed
    1. Broitman A. W., Healey M. K., Kahana M. J. (2024). EEG biomarkers of age-related memory change. Biorxiv. [Preprint]. doi: 10.1101/2024.08.20.608804 - DOI - PubMed
    1. Brookes M. J., Groom M. J., Liuzzi L., Hill R. M., Smith H. J. F., Briley P. M., et al. . (2018). Altered temporal stability in dynamic neural networks underlies connectivity changes in neurodevelopment. NeuroImage 174, 563–575. doi: 10.1016/j.neuroimage.2018.03.008, PMID: - DOI - PubMed

LinkOut - more resources