. 2025 Mar 4:17:1525626.
doi: 10.3389/fnagi.2025.1525626. eCollection 2025.

Knowledge domain and emerging trends in post-stroke cognitive impairment: a bibliometric analysis

Affiliations

Knowledge domain and emerging trends in post-stroke cognitive impairment: a bibliometric analysis

Heyu Zhang et al. Front Aging Neurosci. .

Abstract

Background: Cognitive impairment is an important cause of disability and death among the elderly. One of the most important risk factors is stroke. Post-stroke cognitive impairment (PSCI) not only diminishes the quality of life for patients but also increases the burden on families and society. But PSCI can be mitigated through early intervention. Cerebral small vessel disease (CSVD) is one of the significant causes of stroke and has garnered considerable attention in PSCI. Therefore, this study aims to identify research priorities and trends in PSCI through bibliometric analysis, and further explore the role played by CSVD in PSCI.

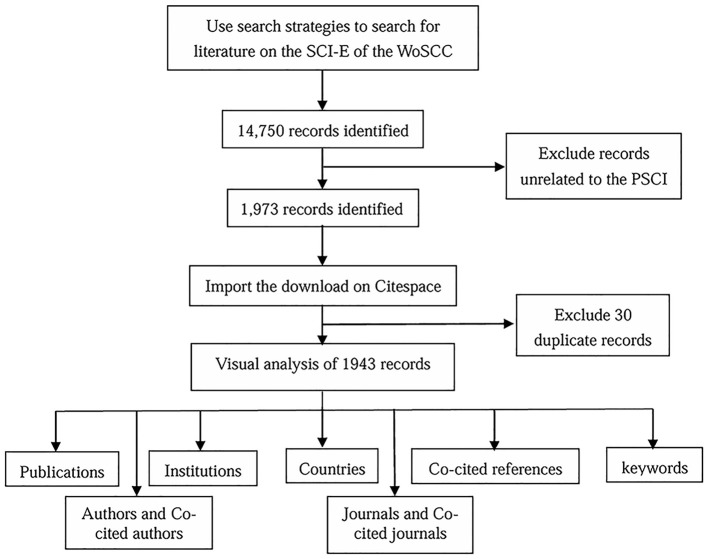
Methods: In this study, we performed a systematic search in the Science Citation Index Expanded (SCI-E) of the Web of Science Core Collection (WoSCC). VOSviewer, CiteSpace and Origin were mainly used to visualize the research focus and trend in PSCI. In addition, we screened the retrieved literature again, and performed keyword analysis on the studies related to CSVD.

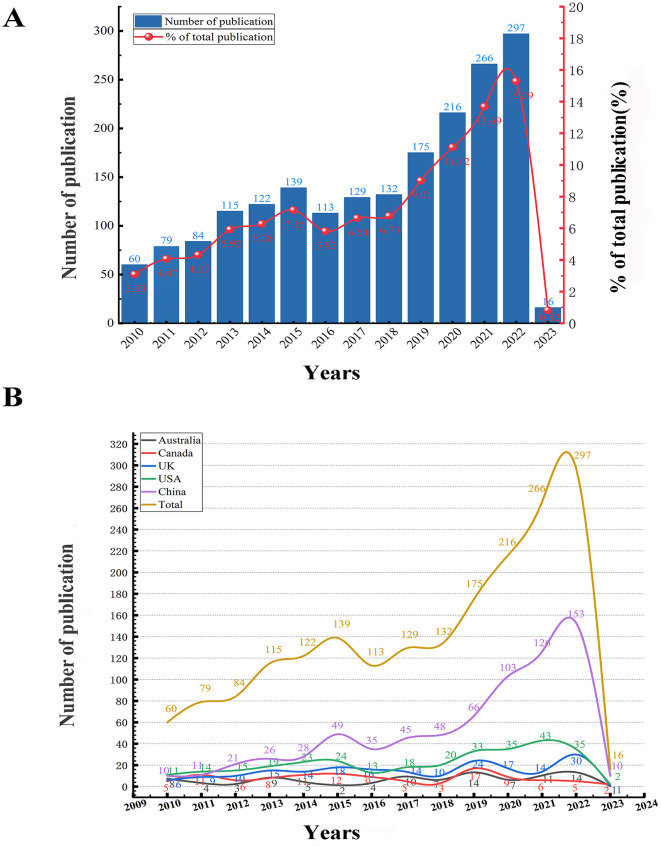
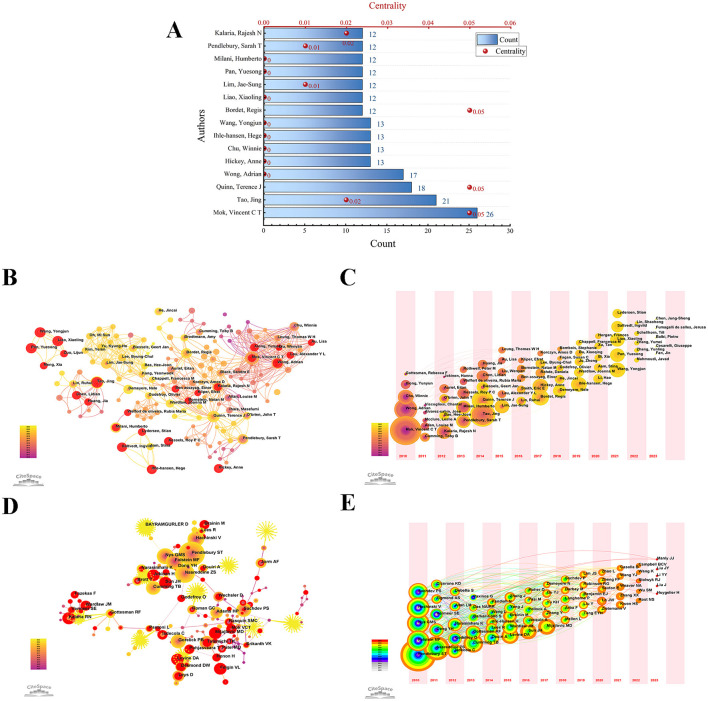
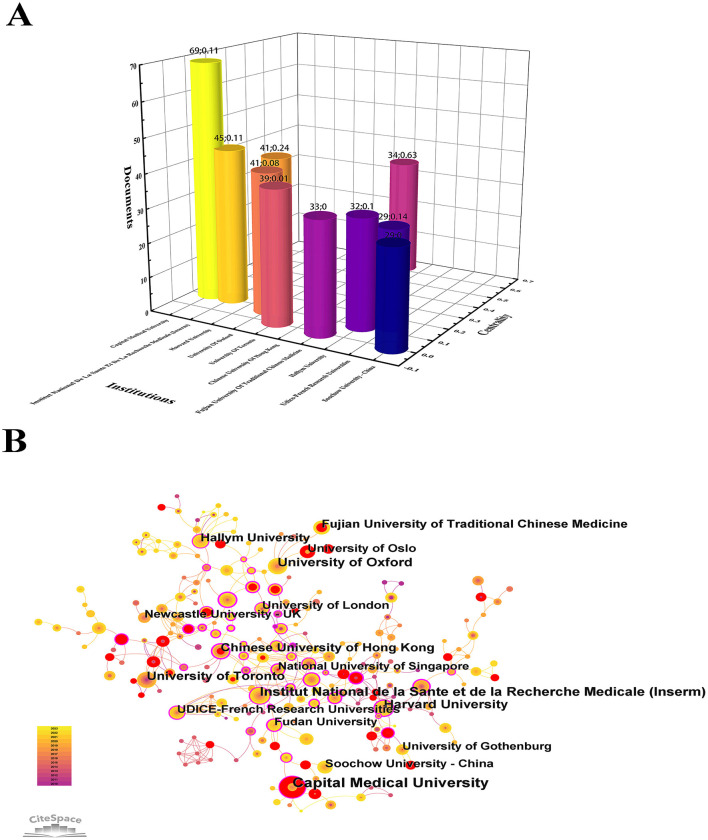
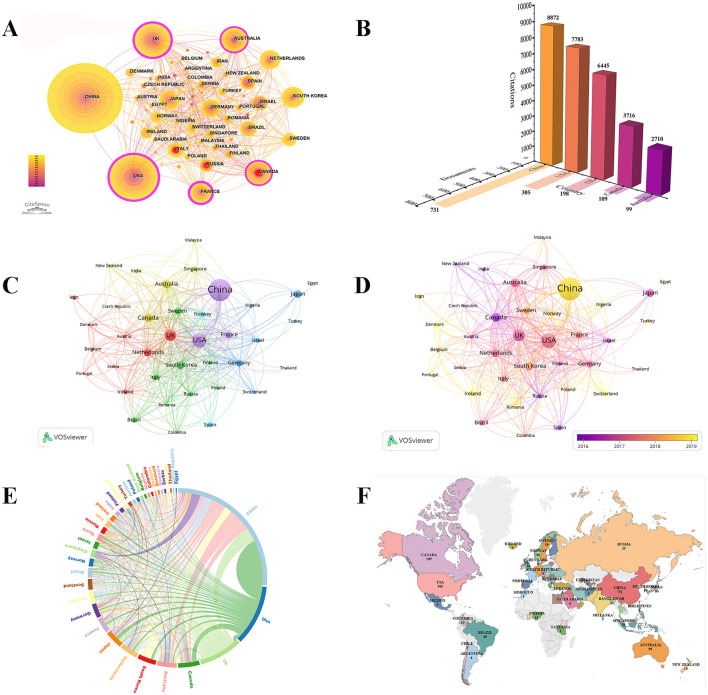
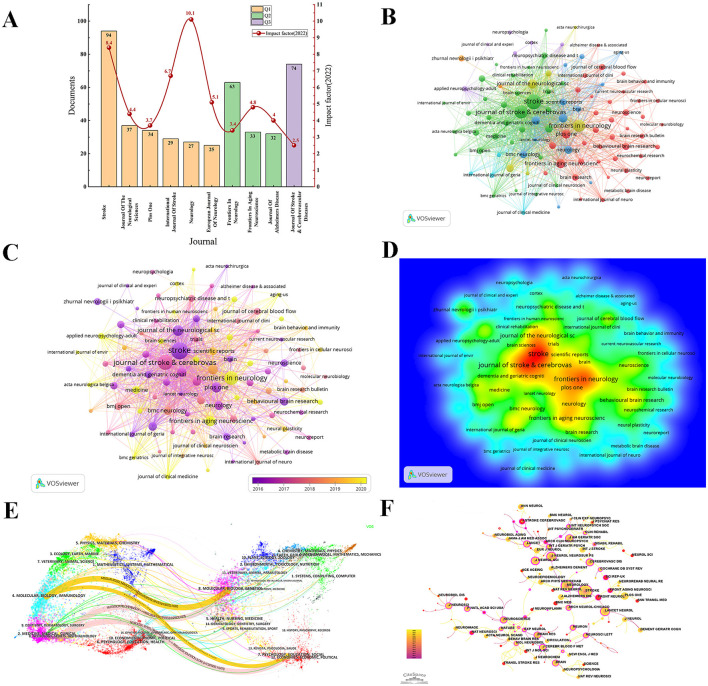
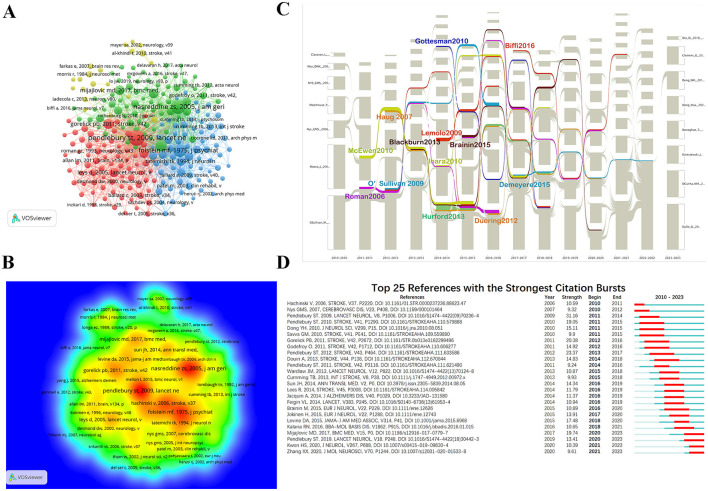
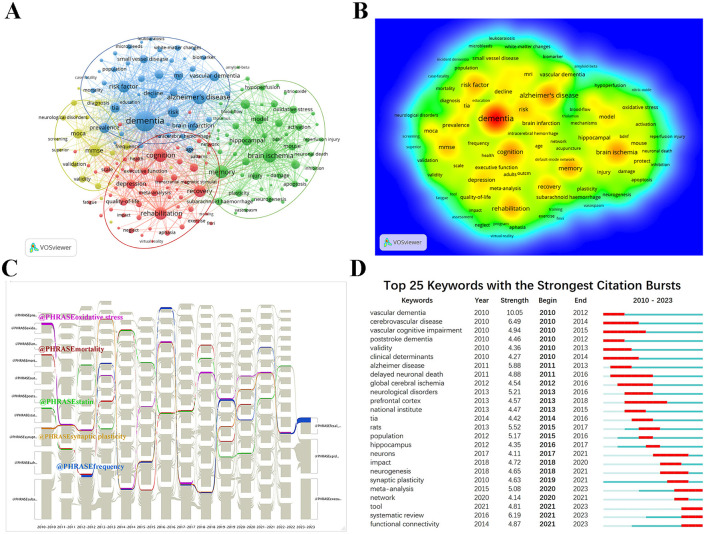
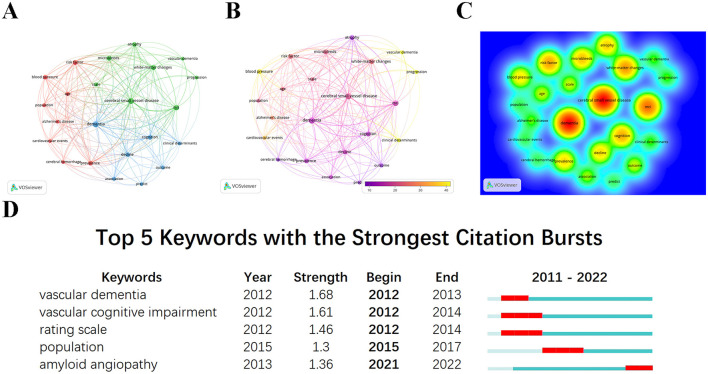
Results: A total of 1,943 publications were retrieved in the field of PSCI in this study, with consistent upward trend in annual publications in recent years. Pendlebury was an important leader in PSCI research. Capital Medical University was in the leading position judging from the number of publications. China had the highest number of publications in this field. The journal Stroke had the strongest international influence in this field. Keywords such as "functional connectivity," "tool," "systematic review," and "meta-analysis" have been revealed to have momentous impact on PSCI in recent years. In the further analysis of PSCI and CSVD, "hypertension," "white matter hyperintensities (WMH)," "cerebral microbleeds (CMBs)," and "cerebral amyloid angiopathy (CAA)" received extensive attention.

Conclusion: The study of PSCI is still in the development stage. This study systematically summarizes the progress and development trend in the field of PSCI, and further explores the relationship between CSVD and PSCI through hypertension and magnetic resonance imaging markers. This study is of great significance for researchers to quickly understand the development of PSCI, but also helps them understand future directions, and provides important insights for the prevention and treatment of PSCI.

Keywords: CiteSpace; VOSviewer; bibliometrics; cerebral small vessel disease; cognitive impairment; post-stroke cognitive impairment; stroke; visual analytics.


Conflict of interest statement

The authors declare that the research was conducted in the absence of any commercial or financial relationships that could be construed as a potential conflict of interest.

Figures

Figure 1
Figure 1
The workflow of this study.
Figure 2
Figure 2
(A) The annual trend of paper publication quantity in the PSCI field. The literature published between January 1, 2010, and January 31, 2023, was included. (B) Annual trends in the number of publications in all countries and the top five countries in the PSCI field.
Figure 3
Figure 3
Authors related to the research in PSCI. (A) The publication quantity and centrality of the top 15 authors in the PSCI field. (B) The author's visualization map. The larger the node is, the higher the author 's publication is. The time of publication is reflected by the depth of color. (C) The author 's timezone map related to PSCI. Different annual rings represent different authors; and the time when the node appears is the time when the author first published the article during the study period; the color reflects the corresponding time. With the change of time, the accumulation of publications is expressed by the size of the annual ring. If the author participates in the same article as the previous author, there is a connection between them, but there is no connection between authors who appear together in the same year. (D) Network of co-cited authors based on CiteSpace. When two authors are cited together in the same article, a co-citation relationship is established. Notably, centrality values > 0.1 would be indicated by a purple circle. Nodes with higher centrality may be positioned in the center of large clusters or subnetworks, indicating the interdisciplinary potential of the node and suggesting that the author's research content is multidisciplinary. (E) The timezone map of co-cited authors.
Figure 4
Figure 4
Visualization of institutions in PSCI. (A) Top 15 institutions engaged in PSCI and their centrality. Different color histograms represent different institutions. The number of institutional publications is related to the height of the histogram. The distance between the bar chart and the X-axis reflects the centrality of the institution. (B) Network of institutions engaged in PSCI. Each node represents an institution, and a larger node represents more publications. If the average time of publishing PSCI articles is later, the node color is lighter. Nodes with red rings represent institutions with a sudden increase in the number of publications over a period of time. The purple circle indicates that the centrality of the institution is >0.1.
Figure 5
Figure 5
Bibliometric analysis of countries in the PSCI field. (A) A visual map for CiteSpace network among countries. (B) Shadow image. The Y-axis numbers and Z-axis numbers respectively indicate the number of PSCI documents and citations in the top five countries. (C) Collaboration network of countries based on VOSviewer. (D) Overlay visualization map of countries analysis. (E) A circle diagram evaluates the international collaboration between clusters. A circle diagram evaluates the international collaboration between clusters. The country is arranged in a circle in the form of an arc, and different countries are distinguished by different colors. The arc becomes shorter in the clockwise direction, indicating that the number of national publications is decreasing. The thicker the connection between countries, the stronger the degree of cooperation between the two. (F) National geographic distribution map.
Figure 6
Figure 6
Analysis of journals and co-cited journals of PSCI publications. (A) Top 10 journals published PSCI publications and their IF. Bar graphs with the same color represent journals with the same JCR partition. (B) Network of journals based on VOSviewer. (C) Overlay visualization map of journals analysis. (D) The density map of journals. Red suggests high density, and the number of PSCI studies published in journals is positively connected to the level of density, the size of the words. (E) The journal dual-map overlay showcases the interconnections among various journals in the field of PSCI. (F) A visual map for CiteSpace network among co-cited journals. Co-cited journals refer to pairs of journals cited together by a third journal, forming a co-citation relationship. A high frequency of co-citation indicates that a journal is an essential theoretical foundation for the field's development.
Figure 7
Figure 7
Visualization of co-cited references in PSCI research. (A) Reference co-citation network. Circles are co-cited literature. (B) Co-cited reference density visualization. (C) The alluvial flow graph of co-cited references. Each specific time point corresponds to a continuously evolving network structure. Each network consists of a number of clusters. The corresponding clusters in the adjacent network form a series of alluvial flows of how the same cluster evolves over time. (D) Top 25 references with the strongest citation bursts (sorted by the beginning year of burst). The red time period represents the duration of the outbreak, which can reflect the wide attention of scholars in the PSCI field during a certain period of time. The blue time period is divided into light blue and dark blue, in which light blue indicates the time when the literature does not appear during the study period, and dark blue refers to the cited time when the literature appears except for the outbreak time.
Figure 8
Figure 8
Bibliometric analysis of keywords in the PSCI field. (A) The keyword co-occurrence map. Nodes with the same color belong to the same cluster. The 178 keywords fell into four clusters based on colors: Cluster 1, 2, 3, and 4 are, respectively, red, green, blue and yellow. The node size denotes the occurrence frequency. And more lines between nodes represent stronger associations between terms (B) The keyword density map. (C) The alluvial flow graph of keywords. (D) Top 25 keywords with the strongest citation bursts.
Figure 9
Figure 9
Visualization analysis of keywords in CSVD research related to PSCI. (A) Co-occurrence network of keywords based on VOSviewer. (B) Overlay visualization map of keywords analysis. Keywords in yellow occurred later than those in purple. (C) The density map of keywords. The level of density, the size of nodes and words all reflect the co-occurrence frequencies. (D) Top five keywords with the strongest citation bursts.

Similar articles

References

    1. Barrett K. M., Brott T. G., Brown R. D., Carter R. E., Geske J. R., Graff-Radford N. R., et al. . (2011). Enhancing recovery after acute ischemic stroke with donepezil as an adjuvant therapy to standard medical care: results of a phase IIA clinical trial. J. Stroke Cerebrovasc. Dis. 20, 177–182. 10.1016/j.jstrokecerebrovasdis.2010.12.009 - DOI - PubMed
    1. Berthier M. L., Green C., Lara J. P., Higueras C., Barbancho M. A., Dávila G., et al. . (2009). Memantine and constraint-induced aphasia therapy in chronic poststroke aphasia. Ann. Neurol. 65, 577–585. 10.1002/ana.21597 - DOI - PubMed
    1. Birks J., Craig D. (2006). Galantamine for vascular cognitive impairment. Cochr. Database Syst. Rev. 2006:CD004746. 10.1002/14651858.CD004746.pub2 - DOI - PMC - PubMed
    1. Bloomfield G. S., Baldridge A., Agarwal A., Huffman M. D., Colantonio L. D., Bahiru E., et al. . (2015). Disparities in cardiovascular research output and citations from 52 African countries: a time-trend, bibliometric analysis (1999-2008). J. Am. Heart Assoc. 4:e001606. 10.1161/JAHA.114.001606 - DOI - PMC - PubMed
    1. Brainin M., Matz K., Nemec M., Teuschl Y., Dachenhausen A., Asenbaum-Nan S., et al. . (2015b). Prevention of poststroke cognitive decline: ASPIS–a multicenter, randomized, observer-blind, parallel group clinical trial to evaluate multiple lifestyle interventions–study design and baseline characteristics. Int. J. Stroke 10, 627–635. 10.1111/ijs.12188 - DOI - PubMed

LinkOut - more resources