

Interpretable prediction of stroke prognosis: SHAP for SVM and nomogram for logistic regression
- PMID: 40103937
- PMCID: PMC11913711
- DOI: 10.3389/fneur.2025.1522868
Interpretable prediction of stroke prognosis: SHAP for SVM and nomogram for logistic regression
Abstract
Background: Ischemic Stroke (IS) stands as a leading cause of mortality and disability globally, with an anticipated increase in IS-related fatalities by 2030. Despite therapeutic advancements, many patients still lack effective interventions, underscoring the need for improved prognostic assessment tools. Machine Learning (ML) models have emerged as promising tools for predicting stroke prognosis, surpassing traditional methods in accuracy and speed.
Objective: The aim of this study was to develop and validate ML algorithms for predicting the 6-month prognosis of patients with Acute Cerebral Infarction, using clinical data from two medical centers in China, and to assess the feasibility of implementing Explainable ML in clinical settings.
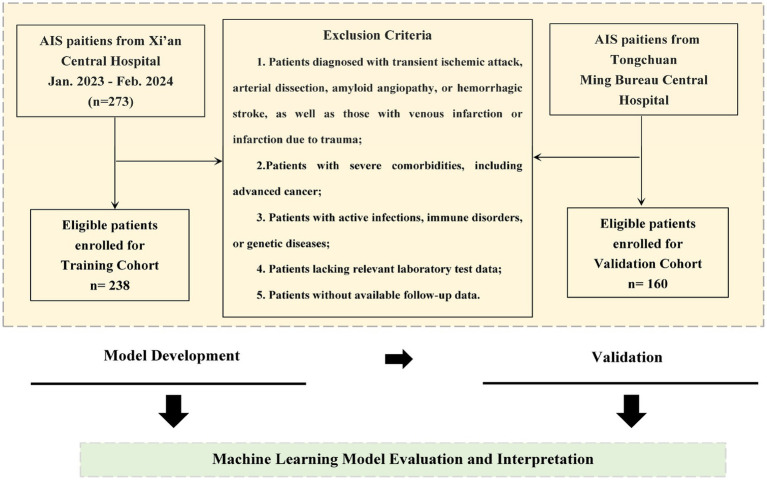
Methods: A retrospective observational cohort study was conducted involving 398 patients diagnosed with Acute Cerebral Infarction from January 2023 to February 2024. The dataset included demographic information, medical histories, clinical evaluations, and laboratory results. Six ML models were constructed: Logistic Regression, Naive Bayes, Support Vector Machine (SVM), Random Forest, XGBoost, and AdaBoost. Model performance was evaluated using the Area Under the Receiver Operating Characteristic curve (AUC), sensitivity, specificity, predictive values, and F1 score, with five-fold cross-validation to ensure robustness.
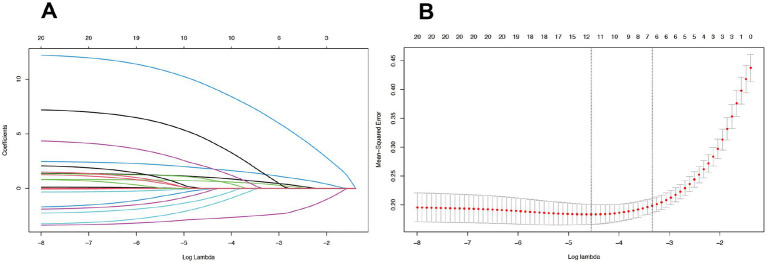
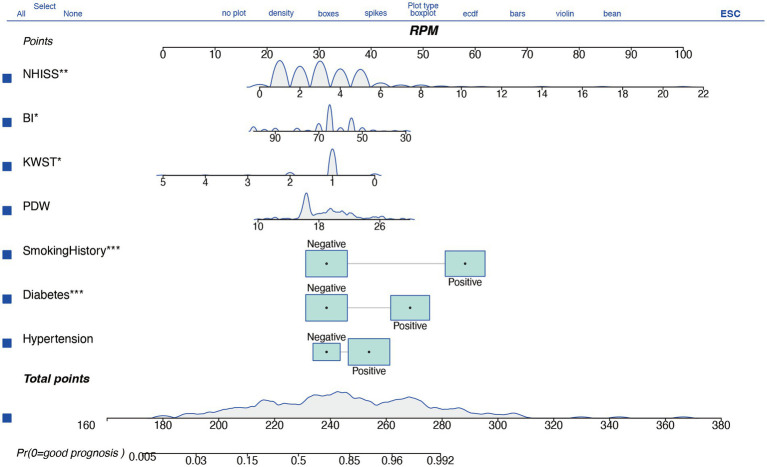
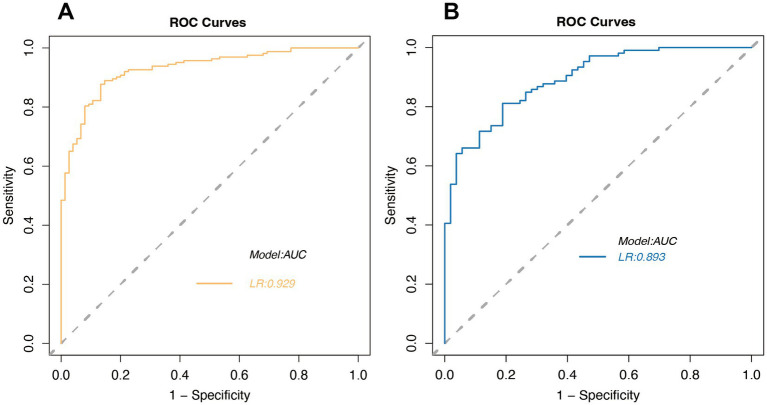
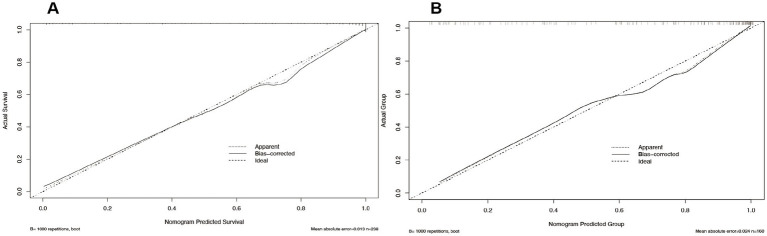
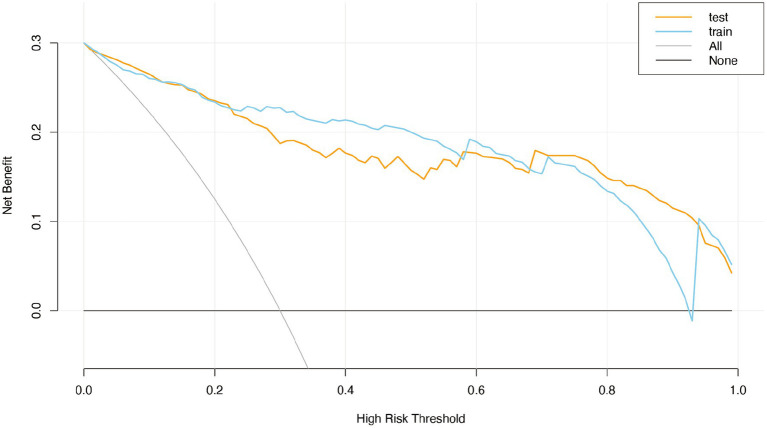
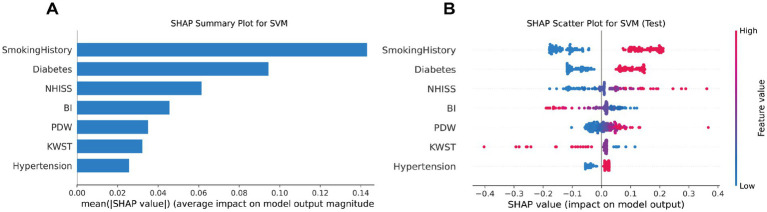
Results: The training set, identified key variables associated with stroke prognosis, including hypertension, diabetes, and smoking history. The SVM model demonstrated exceptional performance, with an AUC of 0.9453 on the training set and 0.9213 on the validation set. A Nomogram based on Logistic Regression was developed for visualizing prognostic risk, incorporating factors such as the National Institutes of Health Stroke Scale (NIHSS) score, Barthel Index (BI), Watanabe Drinking Test (KWST) score, Platelet Distribution Width (PDW), and others. Our models showed high predictive accuracy and stability across both datasets.
Conclusion: This study presents a robust ML approach for predicting stroke prognosis, with the SVM model and Nomogram providing valuable tools for clinical decision-making. By incorporating advanced ML techniques, we enhance the precision of prognostic assessments and offer a theoretical and practical framework for clinical application.
Keywords: clinical decision support; ischemic stroke; machine learning; predictive modeling; prognosis.
Copyright © 2025 Guo, Zhu, Zha, Shao, Liu, Gu and Chen.
Conflict of interest statement
The authors declare that the research was conducted in the absence of any commercial or financial relationships that could be construed as a potential conflict of interest.
Figures

References
-
- Feigin VL, Stark BA, Johnson CO, Roth GA, Bisignano C, Abady GG, et al. Global, regional, and national burden of stroke and its risk factors, 1990-2019: a systematic analysis for the global burden of disease study 2019. Lancet Neurol. (2021) 20:795–820. doi: 10.1016/S1474-4422(21)00252-0, PMID: - DOI - PMC - PubMed
LinkOut - more resources
Full Text Sources