

Accumulation differences of high-value ingredients in different phenotype Lonicera macranthoides: insights from integrative metabolome and transcriptome analyses
- PMID: 40104033
- PMCID: PMC11913843
- DOI: 10.3389/fpls.2025.1533263
Accumulation differences of high-value ingredients in different phenotype Lonicera macranthoides: insights from integrative metabolome and transcriptome analyses
Abstract
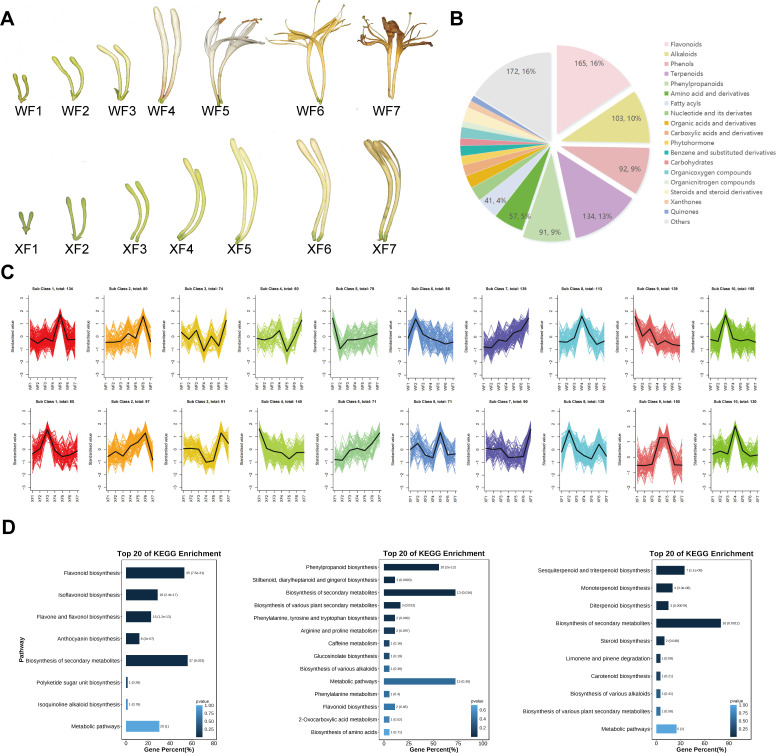
Background: Lonicera macranthoides Hand.-Mazz., the primary sources of Lonicerae Flos(Shanyinhua), brings great medicinal and economic value as an invaluable source of natural bioactive compounds. Nutrient and metabolites accumulation generally changed accompany with its floral development and opening. While the specific accumulation pattern and the underlying molecular regulatory networks remain unclear.
Methods: The present study intergrated a comparative analysis upon UPLC-MS/MS-based metabolomics and RNA-seq-based transcriptomics to revealed the differences in accumulation of flavonoids, phenolic acids, and terpenoids between the xianglei-type (corolla-closed) and wild-type (corolla-unfolded) of L. macranthoides flowers.
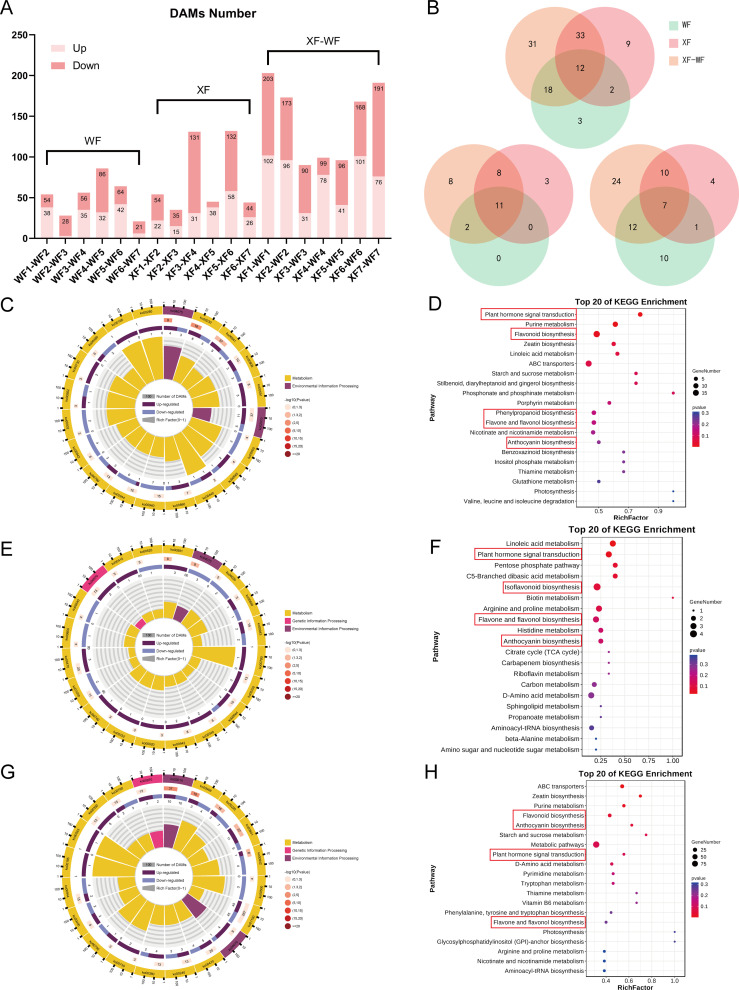
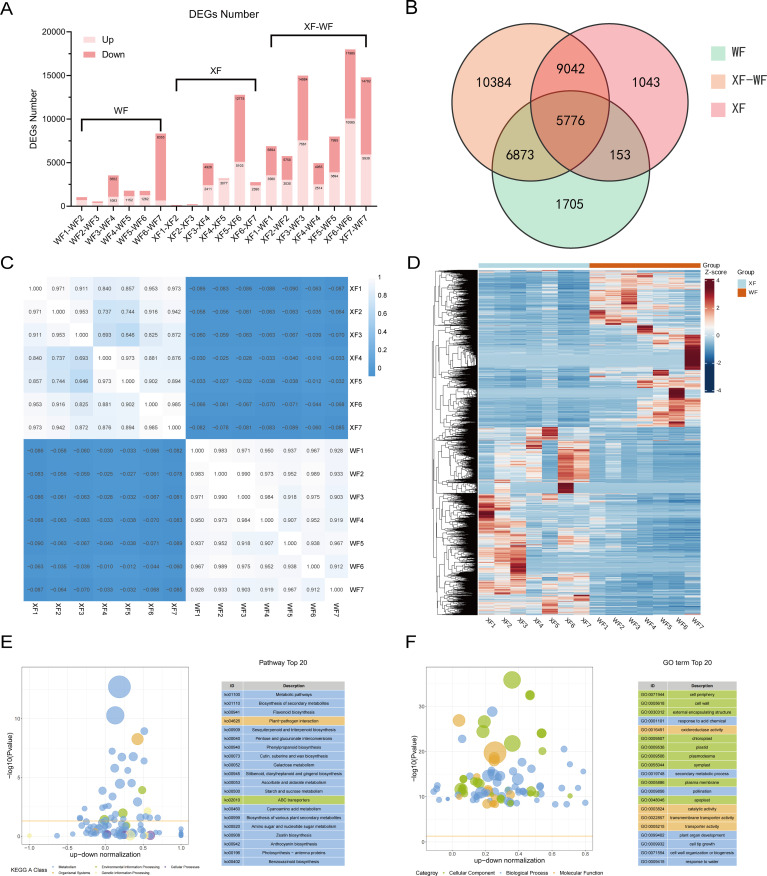
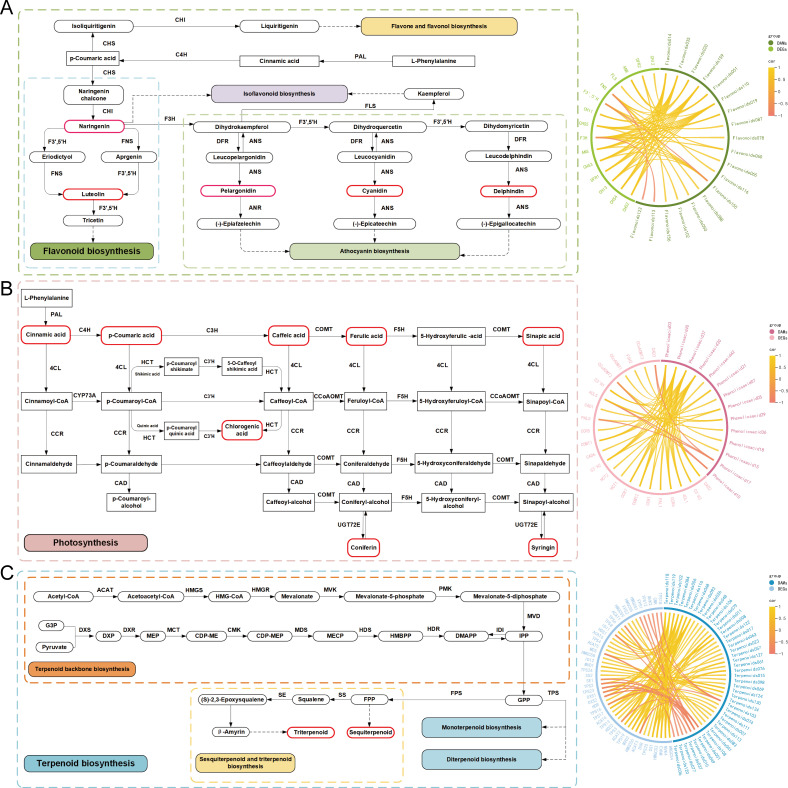
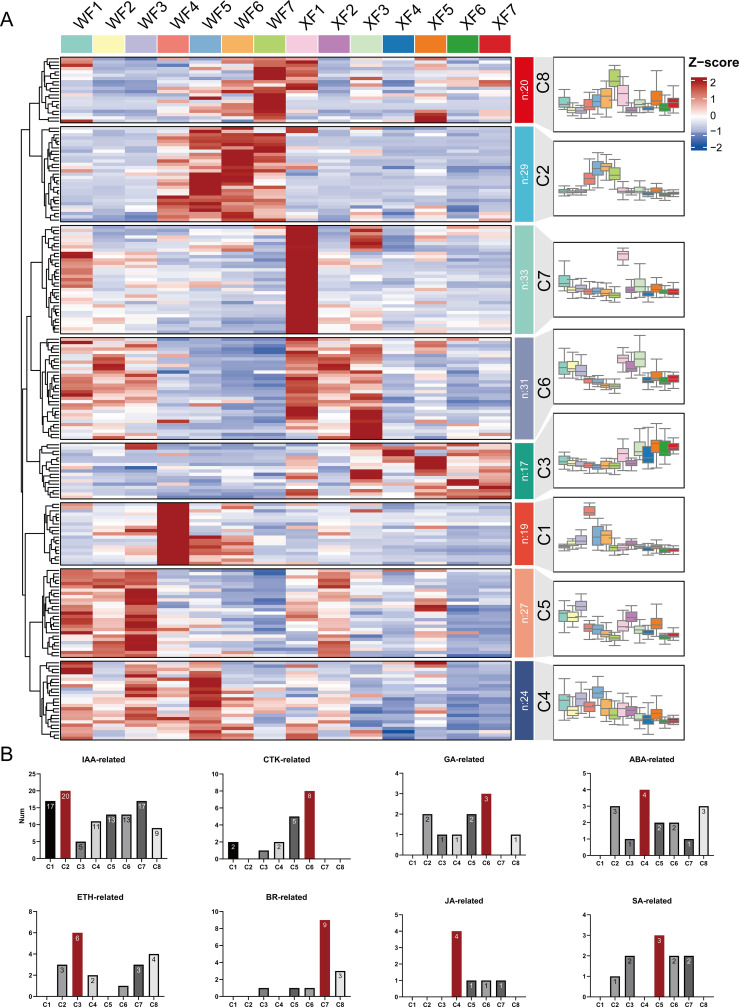
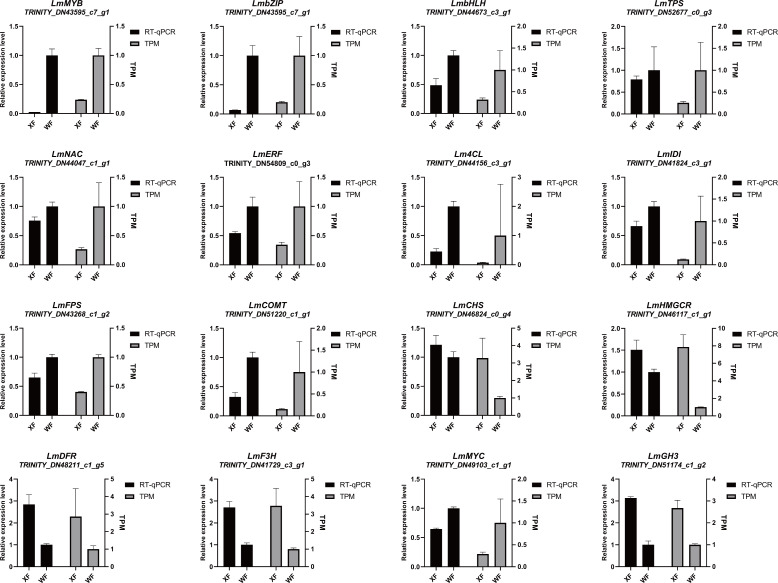
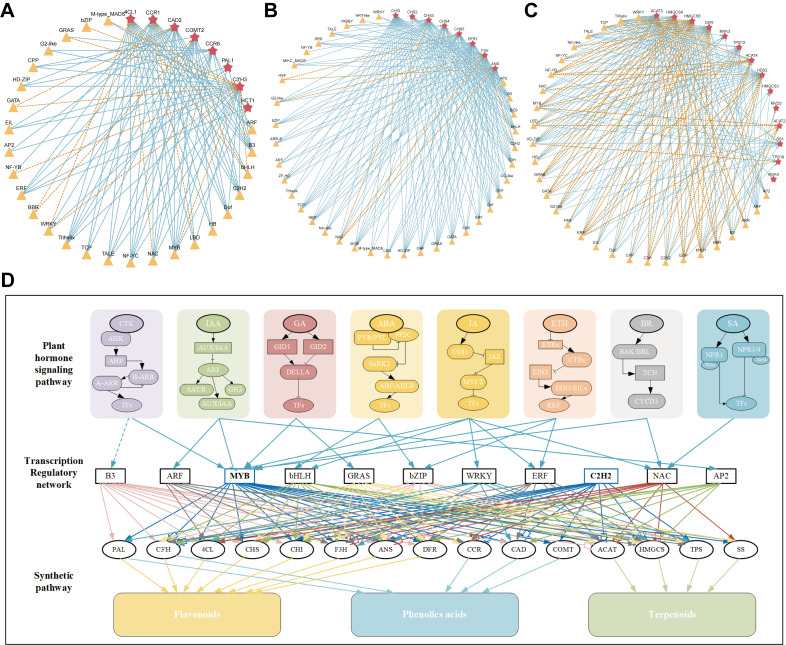
Results and conclusion: 674 differentially accumulated metabolites(DAMs) were identified in WT and XL, with 5,776 common differentially expressed genes(DEGs), revealing a significant differences in accumulation of flavonoids, phenolic acids, and terpenoids during the late stage of flower development between the xianglei-type and wild-type of L. macranthoides flowers. Combined analysis further identified 36 hub genes, major transcription factors and hormone-related genes, which play key roles in the differential accumulation of the abovementioned metabolites. These lines of evidences provide a molecular basis for the metabolic changes occurring during growth and can be significantly implicated in further research on the biosynthetic pathways associated with high-value potent active components in woody plants.
Keywords: Lonicera macranthoides Hand.-Mazz.; active ingredients; metabolome; regulatory network; transcriptome.
Copyright © 2025 Zeng, Long, Zhu, Fu, Zhang, He, Liu, Wang, Tong, Liu and Zhou.
Conflict of interest statement
The authors declare that the research was conducted in the absence of any commercial or financial relationships that could be construed as a potential conflict of interest.
Figures

Similar articles
-
Transcriptomic and metabolomic analyses provide insights into the biosynthesis of chlorogenic acids in Lonicera macranthoides Hand.-Mazz.PLoS One. 2021 May 26;16(5):e0251390. doi: 10.1371/journal.pone.0251390. eCollection 2021. PLoS One. 2021. PMID: 34038434 Free PMC article.
-
Comparative transcriptome analysis to reveal key ethylene genes involved in a Lonicera macranthoides mutant.Genes Genomics. 2023 Apr;45(4):437-450. doi: 10.1007/s13258-022-01354-6. Epub 2023 Jan 25. Genes Genomics. 2023. PMID: 36694039
-
[Transcriptional regulation mechanism of differential accumulation of flavonoids in different varieties of Lonicera macranthoides based on metabonomics and transcriptomics].Zhongguo Zhong Yao Za Zhi. 2024 May;49(10):2666-2679. doi: 10.19540/j.cnki.cjcmm.20240211.101. Zhongguo Zhong Yao Za Zhi. 2024. PMID: 38812167 Chinese.
-
The effects and underlying mechanisms of medicine and food homologous flowers on the prevention and treatment of related diseases.J Food Biochem. 2022 Dec;46(12):e14430. doi: 10.1111/jfbc.14430. Epub 2022 Sep 27. J Food Biochem. 2022. PMID: 36165435 Review.
-
Lonicerae japonicae flos and Lonicerae flos: a systematic review of ethnopharmacology, phytochemistry and pharmacology.Phytochem Rev. 2020;19(1):1-61. doi: 10.1007/s11101-019-09655-7. Epub 2019 Nov 22. Phytochem Rev. 2020. PMID: 32206048 Free PMC article. Review.
Cited by
-
Integrated transcriptomics and metabolomics analysis of flower petals color transition in different phenotype of Lonicera macranthoides.Front Plant Sci. 2025 Jul 10;16:1605238. doi: 10.3389/fpls.2025.1605238. eCollection 2025. Front Plant Sci. 2025. PMID: 40708580 Free PMC article.
References
LinkOut - more resources
Full Text Sources