. 2025 Feb 12;28(3):112006.
doi: 10.1016/j.isci.2025.112006. eCollection 2025 Mar 21.

Astrocyte-induced firing in primary afferent axons

Affiliations

Astrocyte-induced firing in primary afferent axons

Fanny Gaudel et al. iScience. .

Abstract

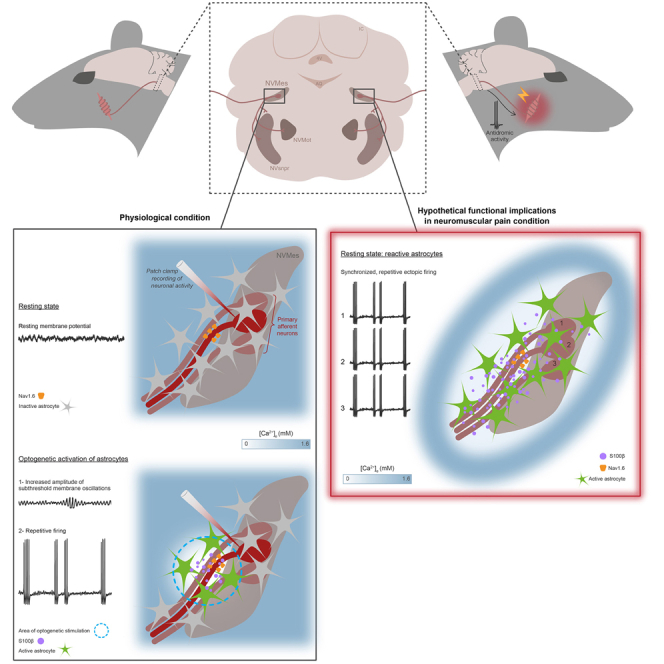
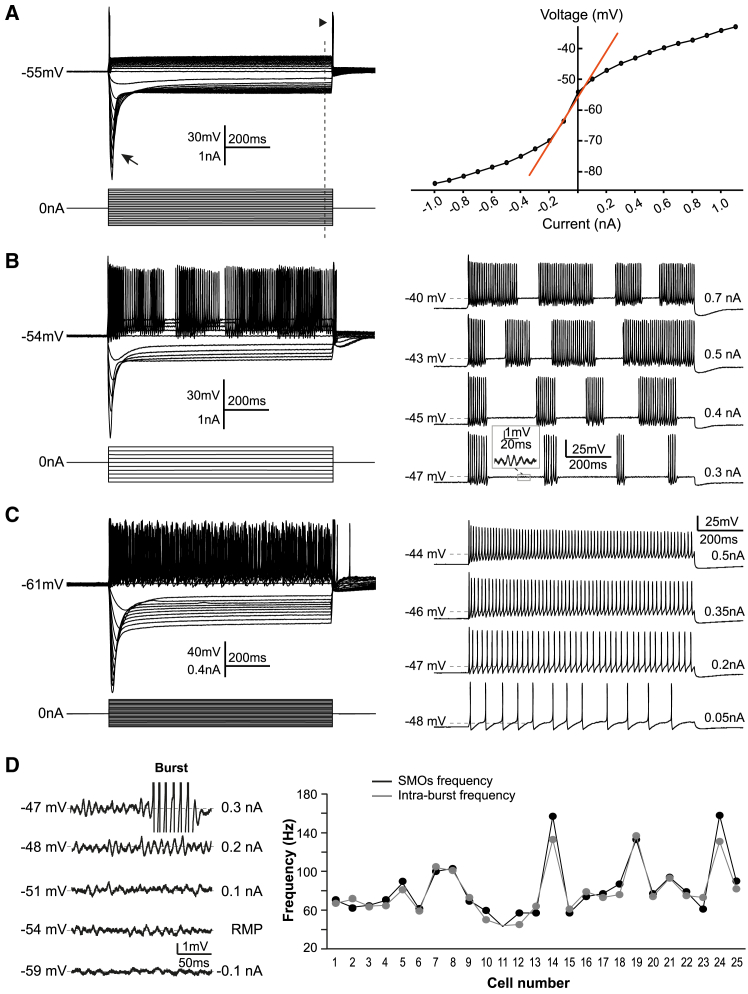
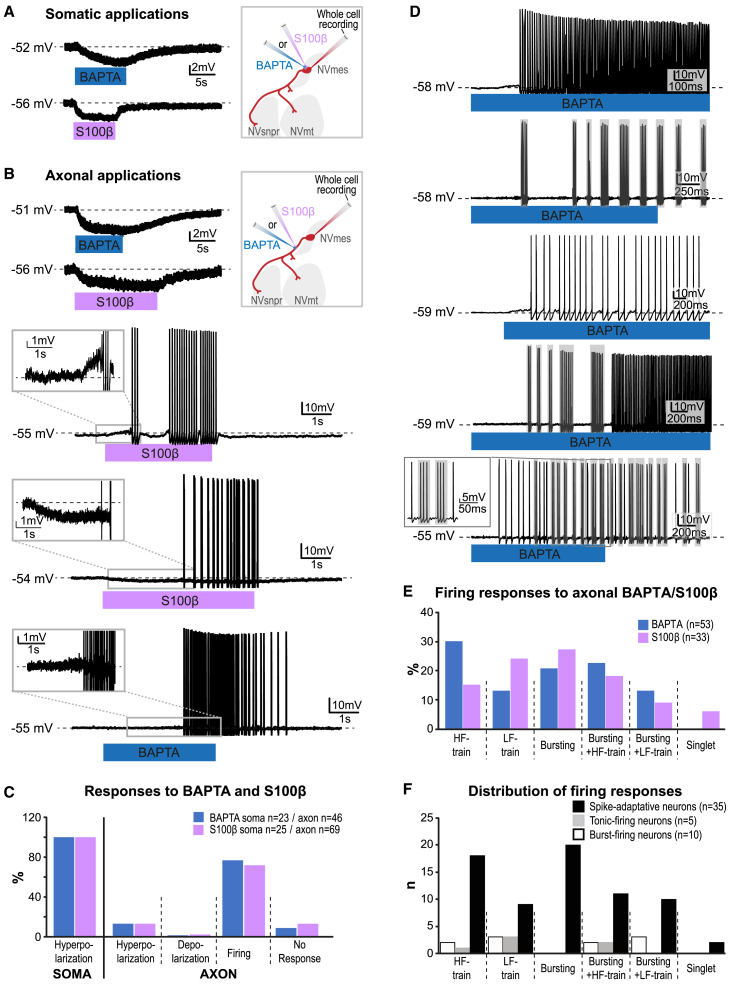
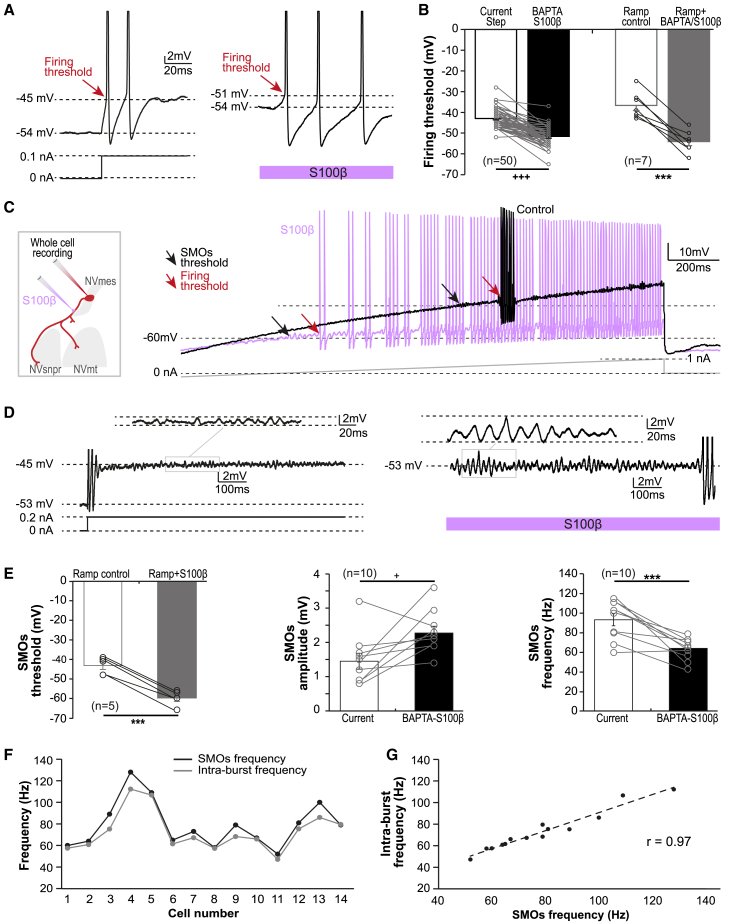
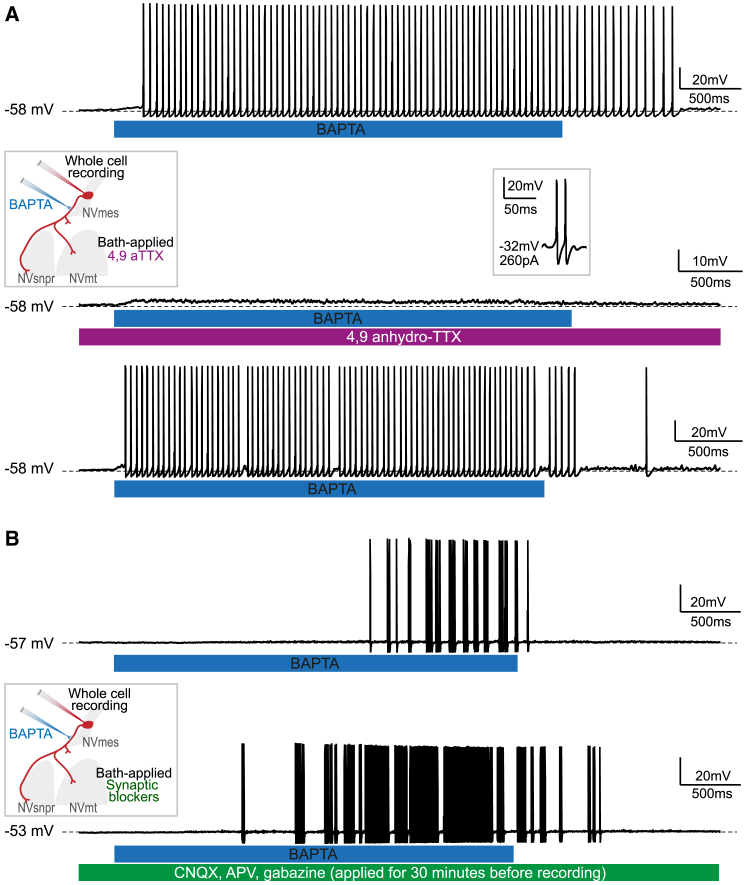
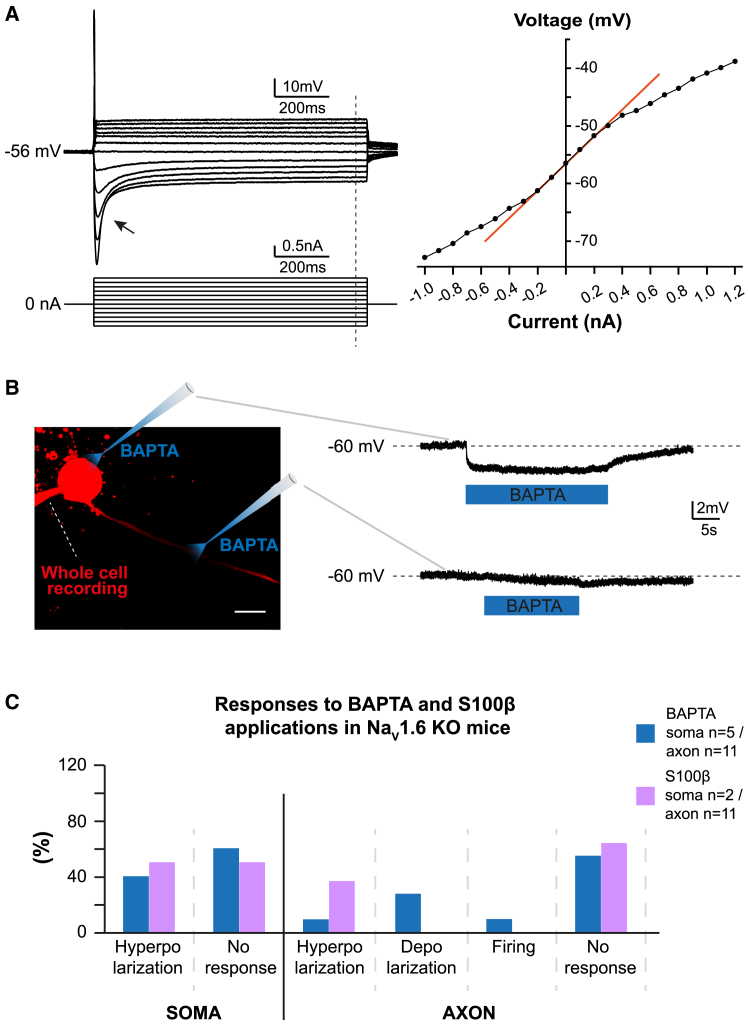
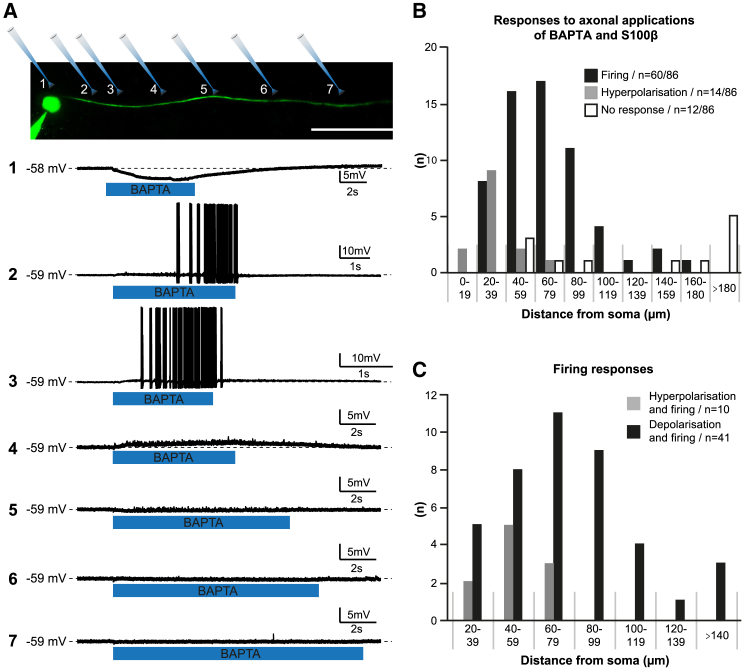
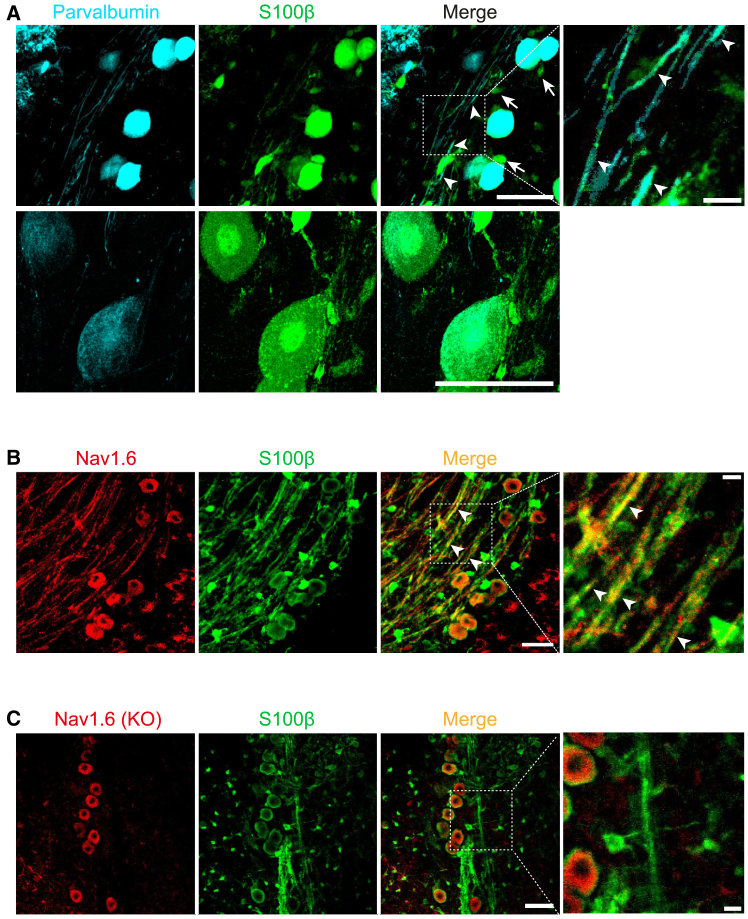
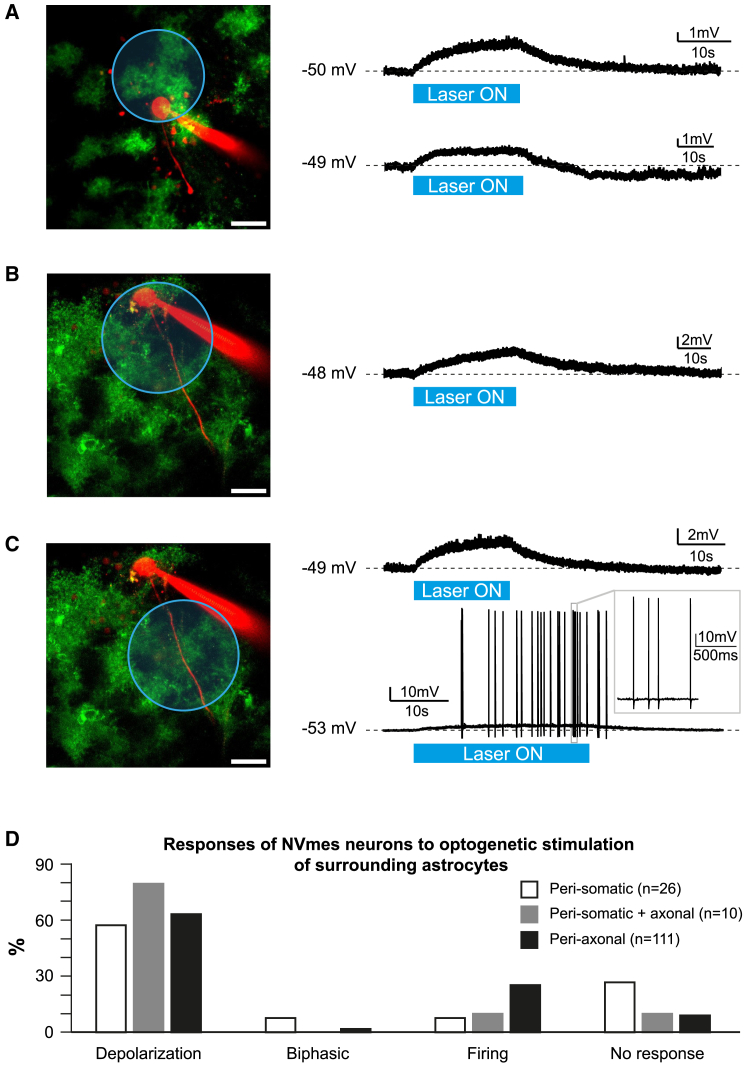
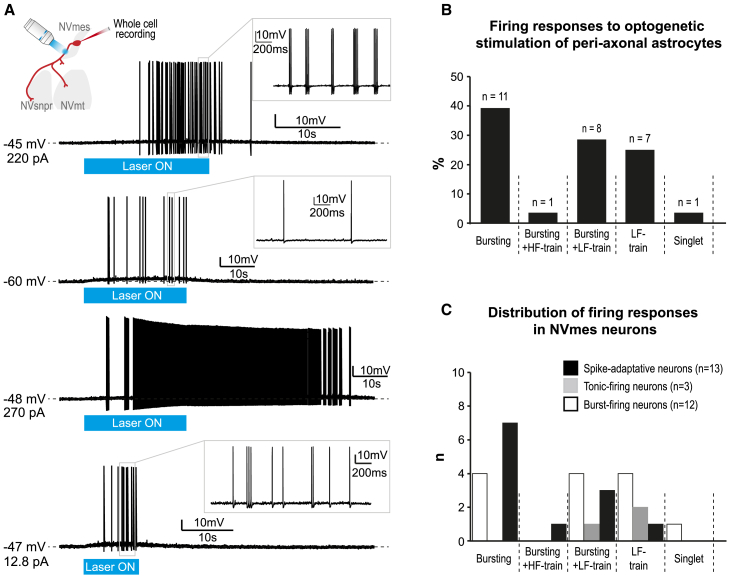
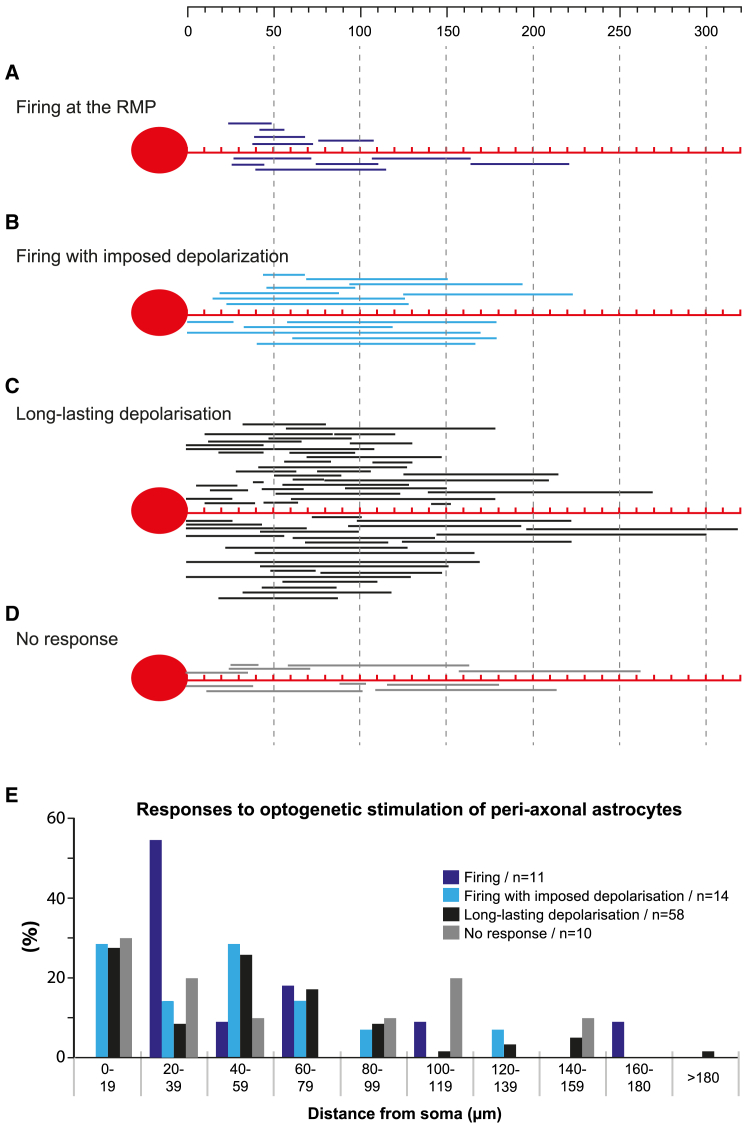
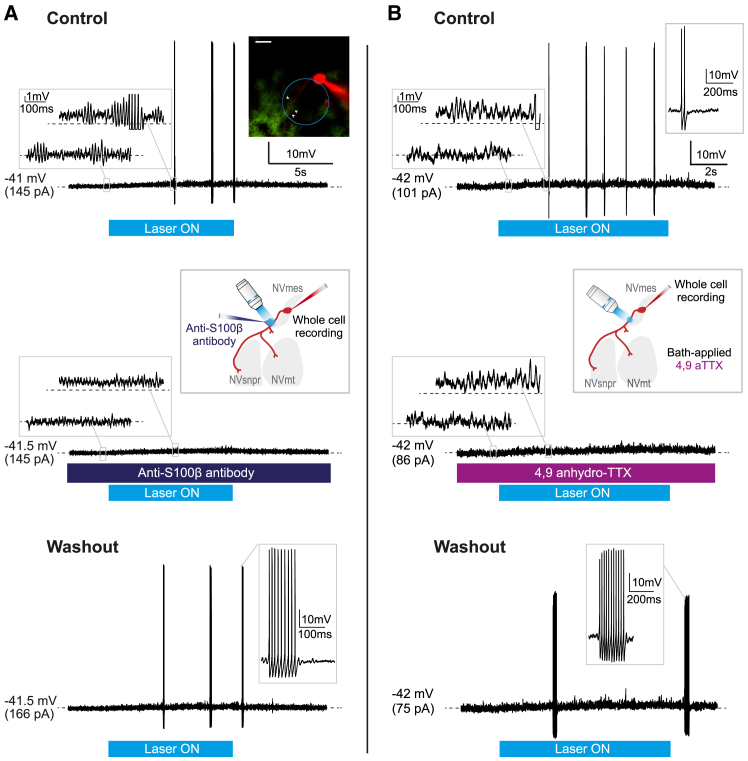
The large-caliber primary afferents innervating the spindles of the jaw-closing muscles have their cell bodies located centrally in the mesencephalic trigeminal nucleus (NVmes). We have shown, in an acid-induced jaw muscle chronic myalgia model, that these afferents exhibit increased excitability and ectopic discharges that emerge from subthreshold membrane oscillations (SMOs) supported by a persistent sodium current (I NaP) exquisitely sensitive to extracellular Ca2+-decreases. Here, we explore if the Ca2+-binding astrocytic protein, S100β, contributes to this hyperexcitability emergence and aim to localize the site where ectopic discharge arises using whole-cell patch-clamp recordings on mice brain slices. We found that astrocytes, by lowering [Ca2+]e at focal points along the axons of NVmes neurons through S100β, enhance the amplitude of the NaV1.6-dependent SMOs, leading to ectopic firing. These findings suggest a crucial role for astrocytes in excitability regulation and raise questions about this neuron-astrocyte interaction as a key contributor to hyperexcitability in several pathologies.

Keywords: cell biology; neuroscience.


Conflict of interest statement

The authors declare competing interests.

Figures

None
Graphical abstract
Figure 1
Figure 1
Diversity of NVmes neurons firing profiles (A–C) Left, top traces: membrane responses of a spike-adaptative (A), a burst-firing (B), and a tonic-firing (C) NVmes neuron to injections of hyperpolarizing and depolarizing current pulses (bottom traces). The arrow and arrowhead point the sag and the rebound action potential, respectively. The vertical dotted line indicates the position of the membrane voltage and the current injection lecture for the I-V curve. (A) Right: I-V curve showing the inward and outward membrane rectification of a spike-adaptative neuron in response to hyperpolarizing and depolarizing injected current, respectively. The red line is the linear fitting to the non-rectifying portion of the I-V curve. (B and C) Right: isolated traces to distinguish bursting and tonic firing profiles. Inset in (B, right) shows SMOs in a burst-firing NVmes neuron. (D) Left: membrane voltage recordings showing the effect of membrane potential on the SMOs. They are abolished with membrane hyperpolarization (bottom trace), and lead to firing with membrane depolarization (top trace). (D) Right: plot of the intra-burst firing frequency (gray dots) and SMOs frequency (black dots) in 25 NVmes neurons at the bursting threshold for each cell showing how they parallel each other. I-V, current-voltage; NVmes, mesencephalic trigeminal nucleus; RMP, resting membrane potential; SMOs, subthreshold membrane oscillations.
Figure 2
Figure 2
Chelation of extracellular calcium exerts a variety of effects on NVmes neurons (A) Somatic applications of Ca2+ chelators BAPTA (top trace) and S100β (bottom trace) induce a slight and reversible hyperpolarization of NVmes neurons’ membrane potential. (B) Applications of Ca2+ chelators BAPTA or S100β along the axonal process of NVmes neurons induce cell hyperpolarization (top two traces) or firing, which could be preceded by membrane depolarization (second trace), hyperpolarization (third trace), or no change in membrane potential (bottom trace). Middle insets: cartoons illustrating the experimental set-ups. Left insets: zooms on the initial part of the firing responses. (C) All somatic applications resulted in cell hyperpolarization, while most axonal applications triggered cell firing. (D) This firing was observed in different patterns. Trains of high-frequency repetitive firing (top trace) were prominent in a majority of NVmes neurons. In some neurons, BAPTA triggered recurrent bursts (second trace), a train of low-frequency single action potentials (third trace), or a mix of neuronal bursting and train of high- or low-frequency action potentials (fourth and fifth traces, respectively) for the duration of BAPTA application. (E) Bar chart quantifying the response profiles of NVmes neurons to somatic or axonal applications of BAPTA (blue), or S100β (purple) in WT/GFAP-ChR2 mice. (F) Bar chart of the relative distribution of the neuronal firing responses elicited after axonal applications of BAPTA and S100β in the spike-adaptative (black bars), tonic-firing (gray bars), and burst-firing (empty bars) NVmes neurons. ChR2, channelrhodopsin 2; GFAP, glial fibrillary acidic protein; HF, high-frequency; LF, low-frequency; NVmes, mesencephalic trigeminal nucleus; NVmt, trigeminal motor nucleus; NVsnpr, trigeminal main sensory nucleus.
Figure 3
Figure 3
Lowering of SMOs and firing voltage thresholds of NVmes neurons by chelation of extracellular Ca2+ around their axonal processes (A) Membrane voltage recordings of a NVmes neuron firing induced with depolarizing step current injection (left trace) or axonal application of S100β (right trace, setup illustrated in C) showing that S100β lowers the firing threshold. (B) Bar chart comparing firing voltage threshold of 50 NVmes neurons with step current injections (empty black bar, as illustrated in A, left trace) and with BAPTA and S100β axonal applications (solidblack bar, as illustrated in A, right trace). The gray bars show the firing voltage threshold of 7 NVmes neurons with ramp current injection (as illustrated in C) in control condition (empty gray bar) and during BAPTA and S100β applications near the axonal process (solid gray bar) of the recorded neurons. (C) Illustration of the experimental set-up (left), and recording (right) of a NVmes neuron while applying a ramp current injection (−1 to 1nA, the hyperpolarizing part is truncated) in control condition or during an axonal application of S100β (black and purple traces, respectively). S100β triggered neuronal repetitive firing by lowering the SMOs (black arrows, control: −39 mV vs. S100β: −59 mV) and firing (red arrows, control: −34 mV vs. S100β: −57 mV) voltage thresholds. (D) Membrane voltage recordings of a NVmes neuron SMOs induced with depolarizing step current injection (left trace) or axonal application of S100β (right trace, as illustrated in B) showing that S100β increases SMOs amplitude in this neuron. (E) Left: bar chart of SMOs voltage threshold of 5 NVmes neurons with ramp current injection in control condition (empty gray bar) and during S100β applications near their axonal process (solid gray bar). Middle: bar chart of the amplitude of the SMOs induced with depolarizing step current injection (empty black bar, as shown in D, left) or axonal application of BAPTA or S100β (solid black bar, as shown in D, right) in 10 NVmes neurons. Right: bar chart of the frequency of the SMOs induced with depolarizing step current injection (empty black bar, as shown in D, left) or axonal application of BAPTA or S100β (solid black bar, as shown in D, right) in 10 NVmes neurons. (F) Plot of intra-burst firing frequency (gray dots) and SMOs frequency (black dots) in 14 neurons showing a parallel increase with both S100β and BAPTA. (G) Scatterplot of intra-burst firing frequency and SMOs frequency in the BAPTA- or S100β-induced burst-firing responses showing a positive relationship between both variables. A linear regression (dotted line) between both variables shows that they are significantly correlated (r = 0.97, p < 0.001). Data in (B) and (E) are represented as mean ± SEM. +p < 0.05, Wilcoxon Signed rank test. +++p < 0.001, Wilcoxon Signed rank test. ∗∗∗p < 0.001, Student paired t test. NVmes, mesencephalic trigeminal nucleus; NVmt, trigeminal motor nucleus; NVsnpr, trigeminal main sensory nucleus; SMOs, subthreshold membrane oscillations.
Figure 4
Figure 4
Axonal BAPTA- and S100β-induced firing in NVmes neuron persists in presence of synaptic blockers and appears to depend solely on INaP and the activity of NaV1.6 channels (A) Sustained firing recorded in a NVmes neuron following local application of BAPTA on its axonal process (top) is abolished in presence of 4,9-anhydro-TTX, a highly specific NaV1.6 blocker (middle) and recovered after 40 min of washout of the 4,9-anhydro-TTX (bottom). The experimental setup is illustrated in the left inset, while the right inset shows that the neuron is still capable of firing with membrane depolarization by current injection in presence of 4,9-anhydro-TTX. (B) Repetitive bursting recorded in a NVmes neuron following local application of BAPTA on its axonal process (top) persists after 30 min of bath application of glutamatergic and GABAergic blockers (respectively CNQX, APV and gabazine; bottom). NVmes, mesencephalic trigeminal nucleus; NVmt, trigeminal motor nucleus; NVsnpr, trigeminal main sensory nucleus.
Figure 5
Figure 5
Nav1.6 KO NVmes neurons do not respond to axonal applications of BAPTA and S100β (A) Left: membrane responses of a NaV1.6-KO NVmes neuron (top traces) to injections of hyperpolarizing and depolarizing current pulses (bottom traces). The arrow points to the sag. The vertical dotted line indicates the position of the membrane voltage and the current injection lecture for the I-V curve. Right: I-V curve showing the inward and outward membrane rectification of a spike-adaptative NaV1.6-KO NVmes neuron in response to hyperpolarizing and depolarizing injected current, respectively. The red line is the linear fitting to the non-rectifying portion of the I-V curve. (B) Left: photomicrography of a NaV1.6-KO NVmes neuron filled with intrapipette Alexa 594 with the BAPTA containing micropipette drawn to indicate the positions of the local applications. Right: membrane responses of the recorded neuron to somatic (top trace) and axonal applications (bottom trace). (C) Bar chart quantifying the response profiles of NVmes neurons to somatic or axonal applications of BAPTA (blue), or of S100β (purple) in NaV1.6-KO mice. Scale bar: 20 μm. I-V, current-voltage; KO, knock-out; NVmes, mesencephalic trigeminal nucleus.
Figure 6
Figure 6
Chelation of extracellular Ca2+ around specific axonal subregions initiate NVmes neuronal bursting (A) Top: reconstructed image of the tested NVmes neuron filled with intrapipette Alexa 488, indicating all positions of BAPTA applications along the axon for the recorded membrane responses below. Bottom1–7: electrophysiological responses elicited by local BAPTA applications at the top-illustrated corresponding positions. Somatic application (position 1) of BAPTA induced a hyperpolarization, while bursting was initiated for the 2 and 3 micropipette positions, corresponding respectively to a 57 and 107 μm distance from the soma. Position 4 induced only a slight depolarization associated with membrane potential oscillations, and all further BAPTA applications had no effect. Initial membrane potentials and scale bars are indicated next to each trace. (B) Bar chart of the distribution of all neuronal responses to the axonal applications of BAPTA and S100β relatively to the distance from the soma of the local application. (C) Most firing responses were observed following a neuronal depolarization (black bars, n = 41), but some neurons displayed firing following a hyperpolarization episode (gray bars, n = 10). Scale bar: 150 μm. NVmes, mesencephalic trigeminal nucleus.
Figure 7
Figure 7
Close relationship between astrocytes and NaV1.6 immuno-positive NVmes neurons (A) Top: parvalbumin-positive NVmes neurons (cyan, left) cell bodies are surrounded by astrocytes (arrows) (S100β staining, second, green) that also contact NVmes axons (arrowheads). Bottom: higher resolution images of parvalbumin-positive NVmes neurons (cyan, left) and S100β immuno-staining (green, middle) that show that NVmes neurons are clearly S100β immuno-positive but that the intensity of the labeling seen in top (middle) is due in part to enwrapping of NVmes neurons somata by astrocytic processes. (B and C) Immunofluorescence staining of Nav1.6 (left panels, red), S100β (second, green) and superposition of Nav1.6 and S100β (right, yellow) in WT (B) and Nav1.6 KO (C) mice. Axonal colocalization of Nav1.6 and S100β indicating axonal apposition of astrocytic processes over Nav1.6 channels (arrowheads) is observed in WT, but not Nav1.6 KO mice. Scale bars are 10 μm for the zoomed images (fourth images in A [top], B, and C) and 50 μm for the other images. KO, knock-out; NVmes, mesencephalic trigeminal nucleus; WT, wild type.
Figure 8
Figure 8
Optogenetic stimulation of peri-neuronal astrocytes in GFAP-ChR2-EYFP mice elicits a diversity of effects (A–C) Photomicrographs of the area of optogenetic stimulation (blue circle) of peri-somatic astrocytes (A), or both peri-somatic and peri-axonal astrocytes (B) or only peri-axonal astrocytes (C) (green astrocytes, red through intrapipette Alexa 594 recorded NVmes neuron). (A) Example of a long-lasting depolarization response (top trace) and of a biphasic response consisting of a depolarization followed by a hyperpolarization (bottom trace) induced by the optogenetic stimulation of peri-somatic astrocytes. (B) Example of a long-lasting depolarization response induced by the optogenetic stimulation of both peri-somatic and peri-axonal astrocytes. (C) Example of a long-lasting depolarization response (top trace) and of repetitive firing (bottom trace) induced by the optogenetic stimulation of peri-axonal astrocytes. (D) Bar chart of the responses of NVmes neurons to optogenetic stimulation of peri-somatic (white), peri-somatic and peri-axonal (gray) and only peri-axonal (black) astrocytes. Scale bars: 50 μm. ChR2, channelrhodopsin 2; EYFP, enhanced yellow fluorescent protein; GFAP, glial fibrillary acidic protein; NVmes, mesencephalic trigeminal nucleus.
Figure 9
Figure 9
NVmes neurons firing responses to the optogenetic stimulation of peri-axonal astrocytes in GFAP-ChR2-EYFP mice (A) The optogenetic stimulation (blue light, combination of 440 and 488 nm lasers, 15% laser power) of peri-axonal astrocytes (as illustrated by the cartoon) triggered diverse firing patterns in the recorded NVmes neurons including bursting (top trace), low-frequency train of action potentials (second trace), bursting associated with high- and low-frequency train of action potentials (third and bottom traces, respectively). (B) Bar chart of the relative distribution of the firing responses (shown in A) elicited by peri-axonal astrocytes stimulations. (C) Bar chart of the relative distribution of the neuronal firing responses elicited by peri-axonal astrocytes stimulations in the spike-adaptative (black bars), tonic-firing (gray bars), and burst-firing (empty bars) NVmes neurons. ChR2, channelrhodopsin 2; EYFP, enhanced yellow fluorescent protein; GFAP, glial fibrillary acidic protein; HF, high-frequency; LF, low-frequency; NVmes, mesencephalic trigeminal nucleus; NVmt, trigeminal motor nucleus; NVsnpr, trigeminal main sensory nucleus.
Figure 10
Figure 10
NVmes neuronal firing is initiated by optogenetic stimulation of peri-axonal astrocytes in GFAP-ChR2-EYFP mice surrounding specific axonal subregions (A–D) Graphic summary of recorded responses following optogenetic stimulations of astrocytes surrounding NVmes axonal subregions in GFAP-ChR2-EYFP mice in relation to the position of the proximal extremity of the covered area of stimulation from 0 to 300 μm of distance from the soma (top grid lines) for 93 of the 111 stimulation sites where images were recorded for offline analysis. (E) All responses with the nominal distances of the proximal extremity of the covered area from the soma are plotted. Following these optogenetic stimulations, we observed firing at the resting membrane potential for 11 stimulation sites (A; E purple bars) and firing following an imposed depolarization for 14 stimulation sites (B; E blue bars). The most common response was a long-lasting depolarization elicited by 58 stimulation sites (C; E black bars), with 10 sites producing no response (D; E gray bars). ChR2, channelrhodopsin 2; EYFP, enhanced yellow fluorescent protein; GFAP, glial fibrillary acidic protein; NVmes, mesencephalic trigeminal nucleus; RMP, resting membrane potential.
Figure 11
Figure 11
Firing triggered in NVmes neurons by optogenetic stimulation of peri-axonal astrocytes in GFAP-ChR2-EYFP mice is reversibly suppressed by the application of an S100β antibody and a NaV1.6 channel blocker (A) Transient bursting (top trace; left inset emphasizes the slight depolarization underlying the firing) induced in an NVmes neuron by a 10 s optogenetic stimulation of its peri-axonal astrocytes (arrowheads in blue circle in photomicrograph) is abolished following local application of the anti-S100β antibody (middle; left inset emphasizes the remaining slight depolarization, right inset illustrates the experimental setup) and recovered after a 35-min wash (bottom). (B) Doublets and singlets (top trace; left inset emphasizes the slight depolarization underlying the firing) induced in an NVmes neuron by a 10 s optogenetic stimulation of its peri-axonal astrocytes are abolished following the addition of 4.9-anhydro-TTX, a selective Nav1.6 antagonist, to the perfusion bath (middle; left inset emphasizes the remaining slight depolarization, right inset illustrates the experimental setup). Bottom: a bursting response was recovered after a prolonged wash. Scale bar: 50 μm. ChR2, channelrhodopsin 2; EYFP, enhanced yellow fluorescent protein; GFAP, glial fibrillary acidic protein; NVmes, mesencephalic trigeminal nucleus; NVmt, trigeminal motor nucleus; NVsnpr, trigeminal main sensory nucleus.

Similar articles

Cited by

References

    1. Copray J.C., Liem R.S., Ter Horst G.J., van Willigen J.D. Dopaminergic afferents to the mesencephalic trigeminal nucleus of the rat: a light and electron microscope immunocytochemistry study. Brain Res. 1990;514:343–348. doi: 10.1016/0006-8993(90)91430-o. - DOI - PubMed
    1. Krettek J.E., Price J.L. Amygdaloid projections to subcortical structures within the basal forebrain and brainstem in the rat and cat. J. Comp. Neurol. 1978;178:225–254. doi: 10.1002/cne.901780204. - DOI - PubMed
    1. Nagy J.I., Buss M., Daddona P.E. On the innervation of trigeminal mesencephalic primary afferent neurons by adenosine deaminase-containing projections from the hypothalamus in the rat. Neuroscience. 1986;17:141–156. doi: 10.1016/0306-4522(86)90232-0. - DOI - PubMed
    1. Bae Y.C., Park K.P., Yoshida A., Nakagawa S., Kurata S., Chen K., Takemura M., Shigenaga Y. Identification of gamma-aminobutyric acid-immunoreactive axon endings associated with mesencephalic periodontal afferent terminals and morphometry of the two types of terminals in the cat supratrigeminal nucleus. J. Comp. Neurol. 1997;389:127–138. doi: 10.1002/(sici)1096-9861(19971208)389:1<127::aid-cne9>3.0.co;2-4. - DOI - PubMed
    1. Buisseret-Delmas C., Pinganaud G., Compoint C., Buisseret P. Projection from trigeminal nuclei to neurons of the mesencephalic trigeminal nucleus in rat. Neurosci. Lett. 1997;229:189–192. doi: 10.1016/s0304-3940(97)00452-7. - DOI - PubMed

LinkOut - more resources