. 2025 Feb 15;28(3):112031.
doi: 10.1016/j.isci.2025.112031. eCollection 2025 Mar 21.

Islet single-cell transcriptomic profiling during obesity-induced beta cell expansion in female mice

Affiliations

Islet single-cell transcriptomic profiling during obesity-induced beta cell expansion in female mice

Peter M Masschelin et al. iScience. .

Abstract

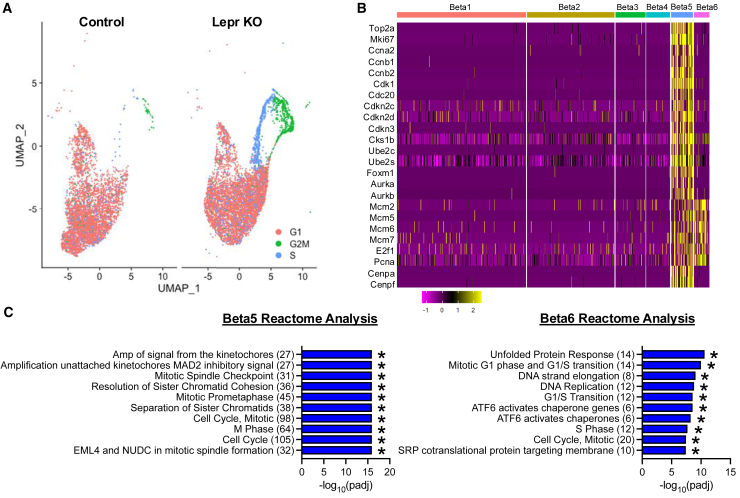
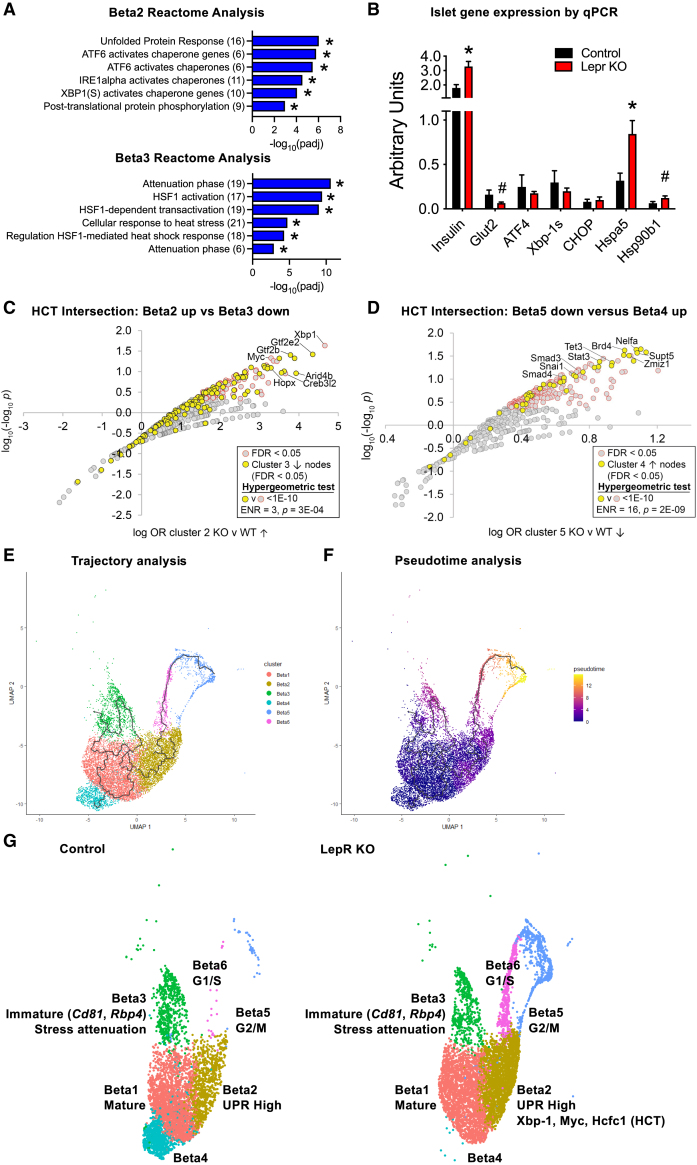
Targeting beta cell proliferation is an appealing approach to restore glucose control in type 1 diabetes. However, the underlying mechanisms of beta cell proliferation remain incompletely understood, limiting identification of new therapeutic targets. Obesity is a naturally occurring process that potently induces human and rodent beta cell replication, representing an ideal model to study mechanisms of beta cell proliferation. We showed previously acute whole-body Lepr gene deletion in adult mice induces obesity and massive beta cell expansion. Here, using single-cell transcriptomics with female Lepr KO islets, we identified distinct populations of beta cells undergoing unfolded protein response (UPR), stress resolution, and cell cycle progression. Lepr KO beta cells undergoing UPR markedly increased chaperone protein, ribosomal biogenesis, and cell cycle transcriptional programs that were enriched for Xbp1 and Myc target genes. Our findings suggest a coordinated transcriptional mechanism involving Xbp1 and Myc to alleviate UPR and stimulate beta cell proliferation in obese female mice.

Keywords: Biological sciences; Cell biology; Functional aspects of cell biology; Specialized functions of cells.


Conflict of interest statement

The authors declare no competing interests.

Figures

None
Graphical abstract
Figure 1
Figure 1
Single cell transcriptome analysis following acute whole body Lepr KO (A) Body mass (g) from the start of tamoxifen treatment (day 0) until islet harvest (day 9) (n = 4/group). Mean ± SEM; ∗p < 0.05 by two-way ANOVA. (B) Fed glucose levels (mg/dL) and C) insulin tolerance test (% initial glucose at time = 0 min) (n = 4–6/group). Mean ± SEM; ∗p < 0.05, #p < 0.09 by (b) t-test or (C) two-way ANOVA. (D) Cell type specific marker gene expression for alpha (glucagon; Gcg), beta (insulin 1; Ins1), delta (somatostatin; Sst), Ppy (pancreatic polypeptide; Ppy), immune (Ccl4), stellate (Pdgfrb), acinar (Prss2), Schwann (S100a6), and endothelial (Cd34). (E) UMAP plot of single cell RNA-seq from control (left; Lepr-lp/lp) and Lepr KO (right; Ubc-Cre;Lepr-lp/lp) islets. Also see Figure S1. (F) Relative abundance of hormone producing cells as a percentage of total islet endocrine cells within control and Lepr KO islets analyzed from scRNA-seq. (G) Hallmark enrichment analysis of genes significantly upregulated in total beta cells from Lepr KO islets compared to control (∗p < 0.05 by hypergeometric test for overrepresentation). (D–G) The total cells analyzed included 7975 cells from control islets and 9406 cells from Lepr KO islets.
Figure 2
Figure 2
Acute Lepr KO induces shift in beta cell subpopulation abundance (A) Six beta cell subpopulations were identified by differential gene expression analysis as shown by the UMAP plot. (B) Relative abundance of beta cell subpopulations as a percentage of total beta cells from control and Lepr KO islets (percentages shown above the bar). (C) Heatmap of beta cell marker gene expression across beta cell subpopulations. (D) Heatmap of differentially expressed genes for each beta cell subpopulation. (E) Heatmap of islet hormone expression across beta cell clusters, alpha, delta, and PP cells, as well as immune, stellate, acinar, Schwann, and endothelial (EC) cells. (F) Heatmap of immature and mature marker gene expression across beta cell subpopulations. The total beta cells analyzed included 4567 beta cells from control islets and 6545 beta cells from Lepr KO islets. Alpha cells from control = 1586 and Lepr KO = 1174 cells, for delta cells from control = 606 and Lepr KO = 585 cells, and for PP from control = 289 and Lepr KO = 148 cells were analyzed.
Figure 3
Figure 3
Acute Lepr KO activates gene programs associated with cell cycle progression (A) UMAP plot of beta cells analyzed for enrichment of transcripts in the different cell cycle stages (G1 – pink; S – blue; G2/M – green). (B) Heatmap of gene expression for markers of S and G2/M phases of the cell cycle across beta cell subpopulations. (C) Reactome pathway analysis of differentially upregulated genes between control and Lepr KO islets for Beta5 (top) and Beta6 (bottom) beta cell subpopulations (∗p < 0.05 by hypergeometric test for overrepresentation). The total beta cells analyzed included 4567 beta cells from control islets and 6545 beta cells from Lepr KO islets.
Figure 4
Figure 4
Lepr KO induced ER stress response associates with Xbp-1 and Myc activity leading to cell cycle progression (A) Reactome pathway analysis of differentially expressed genes for Beta2 (top) and Beta3 (bottom) beta cell subpopulations (∗p < 0.05 by hypergeometric test for overrepresentation). (B) Gene expression (fold change) from control (black; Lepr-lp/lp) and Lepr KO (red; Ubc-Cre;Lepr-lp/lp) using total islet RNA (n = 4/group). Mean ± SEM; ∗p < 0.05, #p < 0.10 by t-test. (C) Pathway nodes from the high confidence transcriptional target (HCT) intersection analysis of the Beta2 up gene set (Lepr KO vs. control) were plotted as log odds ratio (log OR) against log10(-log10 P) (double-log procedure was used due to the large p-value range). Nodes with significant (q < 0.05) HCT intersections with the Beta2 up gene set are colored gray with a red border. Nodes with non-significant (q > 0.05) intersections with the Beta2 up gene set are colored gray. A hypergeometric test was performed on the overrepresentation in the q < 0.05 nodes of nodes encoded by genes in the Beta3 down gene set, shown in yellow. (D) Pathway nodes from the HCT intersection analysis of the Beta5 down gene set (Lepr KO vs. control) were plotted as log odds ratio (log OR) against log10(-log10 P) (double-log procedure was used due to the large p-value range). Nodes with significant (q < 0.05) HCT intersections with the Beta5 down gene set are colored gray with a red border. Nodes with non-significant (q > 0.05) intersections with the Beta5 down gene set are colored gray. A hypergeometric test was performed on the overrepresentation in the q < 0.05 nodes of nodes encoded by genes in the Beta4 up gene set, shown in yellow. (E) Trajectory analysis colored by beta cell subpopulation of combined control and Lepr KO datasets. (F) Pseudotime analysis of beta cells of combined control and Lepr KO datasets. (G) Summary of beta cell subpopulations and corresponding state (mature, immature, proliferative) with an overlay of enriched pathways and transcriptional nodes. (C–G)The total beta cells analyzed included 4567 beta cells from control islets and 6545 beta cells from Lepr KO islets.

Similar articles

References

    1. Prentki M., Peyot M.-L., Masiello P., Madiraju S.R.M. Nutrient-Induced Metabolic Stress, Adaptation, Detoxification, and Toxicity in the Pancreatic β-Cell. Diabetes. 2020;69:279–290. doi: 10.2337/dbi19-0014. - DOI - PubMed
    1. Butler A.E., Janson J., Bonner-Weir S., Ritzel R., Rizza R.A., Butler P.C. Beta-cell deficit and increased beta-cell apoptosis in humans with type 2 diabetes. Diabetes. 2003;52:102–110. doi: 10.2337/diabetes.52.1.102. - DOI - PubMed
    1. Karaca M., Castel J., Tourrel-Cuzin C., Brun M., Géant A., Dubois M., Catesson S., Rodriguez M., Luquet S., Cattan P., et al. Exploring functional beta-cell heterogeneity in vivo using PSA-NCAM as a specific marker. PLoS One. 2009;4 doi: 10.1371/journal.pone.0005555. - DOI - PMC - PubMed
    1. Smukler S.R., Arntfield M.E., Razavi R., Bikopoulos G., Karpowicz P., Seaberg R., Dai F., Lee S., Ahrens R., Fraser P.E., et al. The adult mouse and human pancreas contain rare multipotent stem cells that express insulin. Cell Stem Cell. 2011;8:281–293. doi: 10.1016/j.stem.2011.01.015. - DOI - PubMed
    1. Dorrell C., Schug J., Canaday P.S., Russ H.A., Tarlow B.D., Grompe M.T., Horton T., Hebrok M., Streeter P.R., Kaestner K.H., Grompe M. Human islets contain four distinct subtypes of β cells. Nat. Commun. 2016;7 doi: 10.1038/ncomms11756. - DOI - PMC - PubMed

LinkOut - more resources