. 2025 Feb 12;28(3):111999.
doi: 10.1016/j.isci.2025.111999. eCollection 2025 Mar 21.

Divergent responses to SARS-CoV-2 infection in bronchial epithelium with pre-existing respiratory diseases

Affiliations

Divergent responses to SARS-CoV-2 infection in bronchial epithelium with pre-existing respiratory diseases

Justine Oliva et al. iScience. .

Abstract

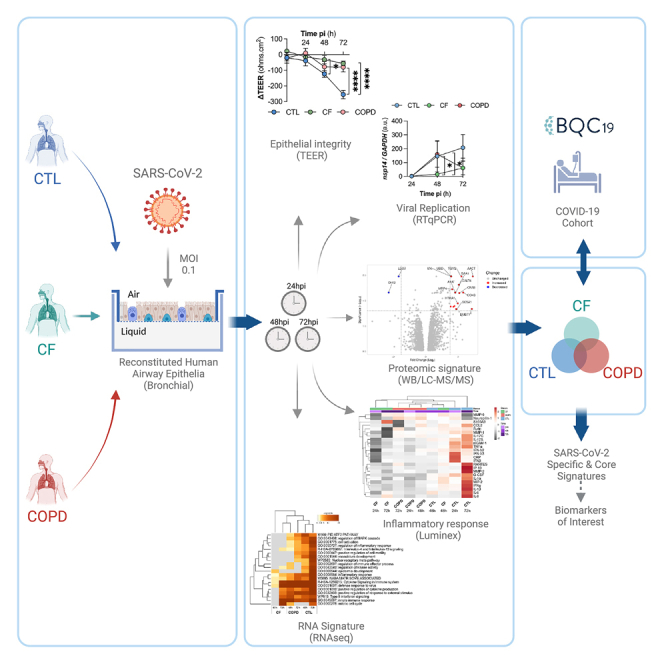
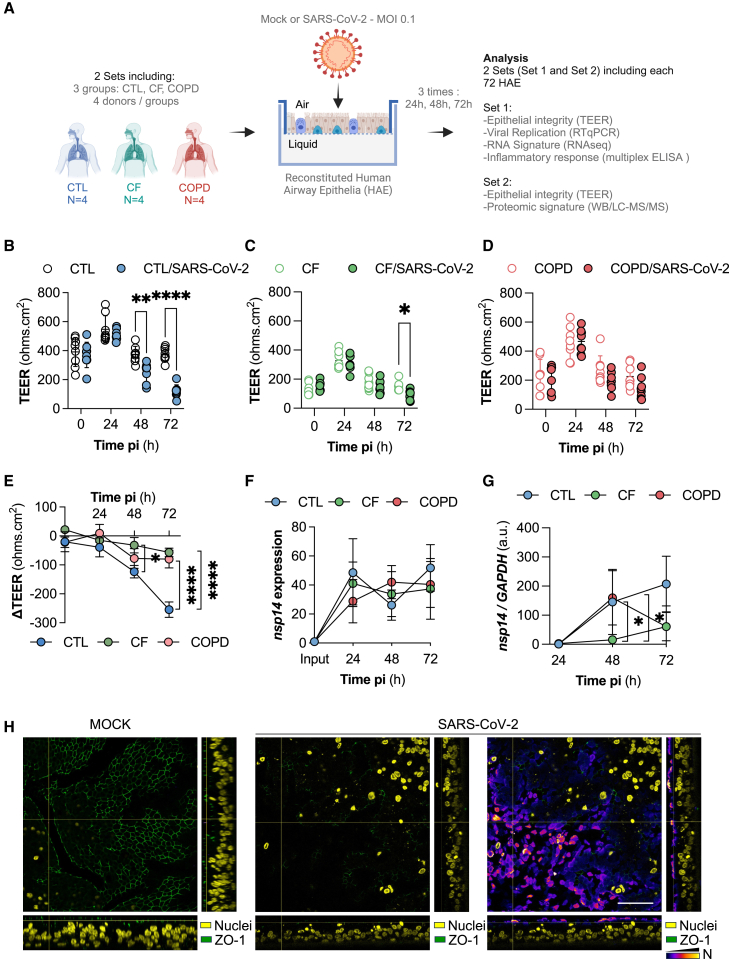
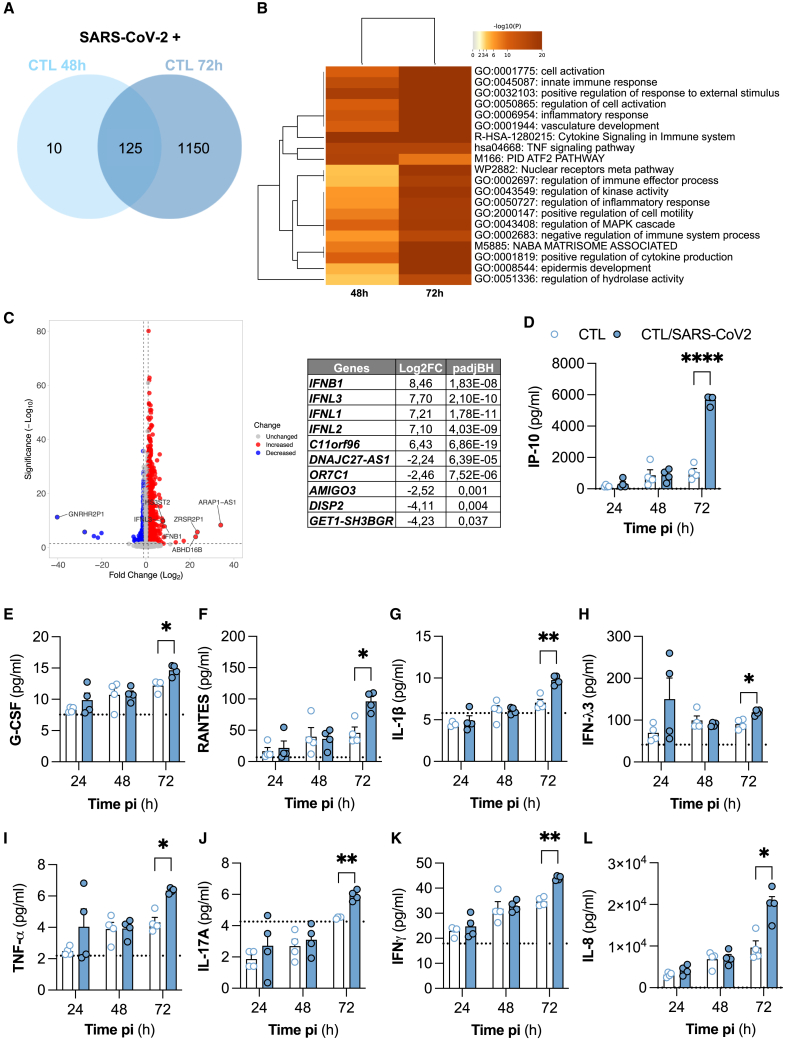
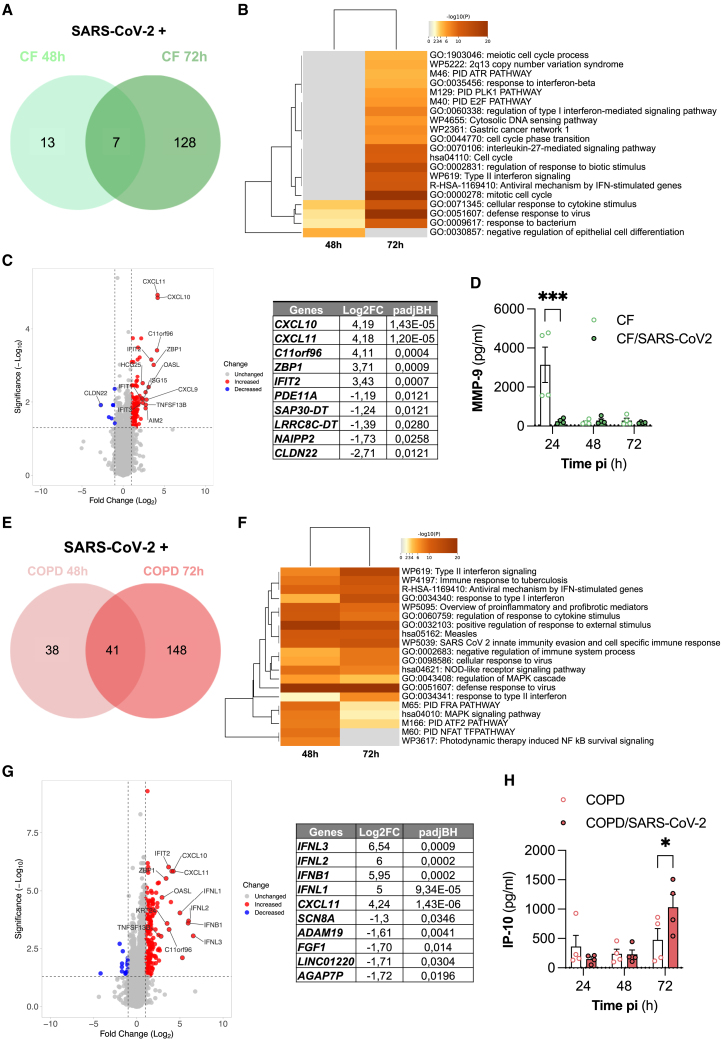
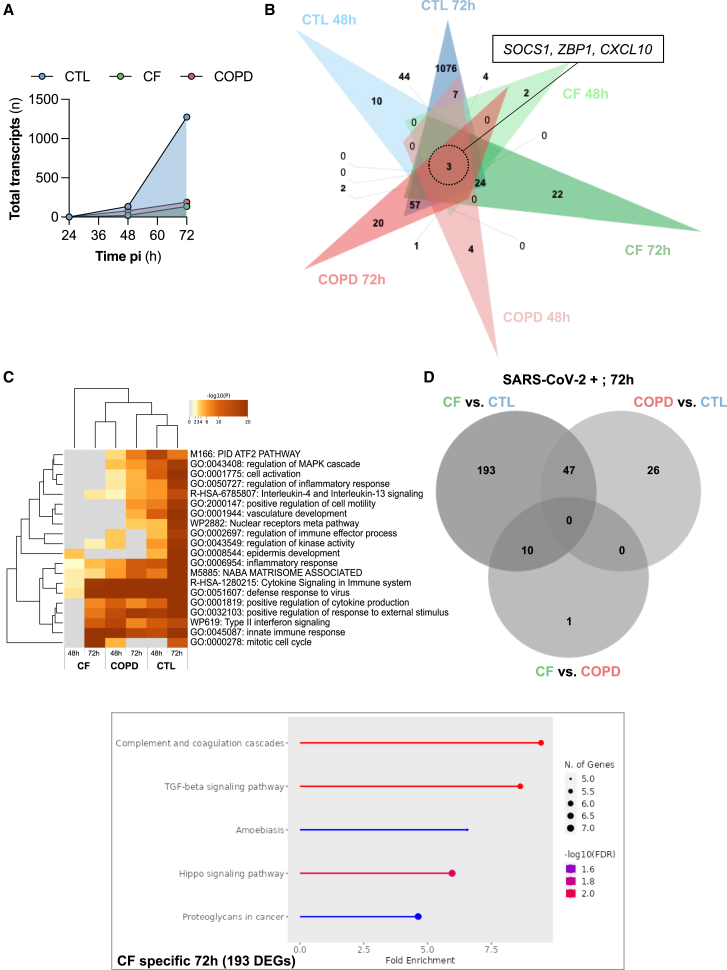
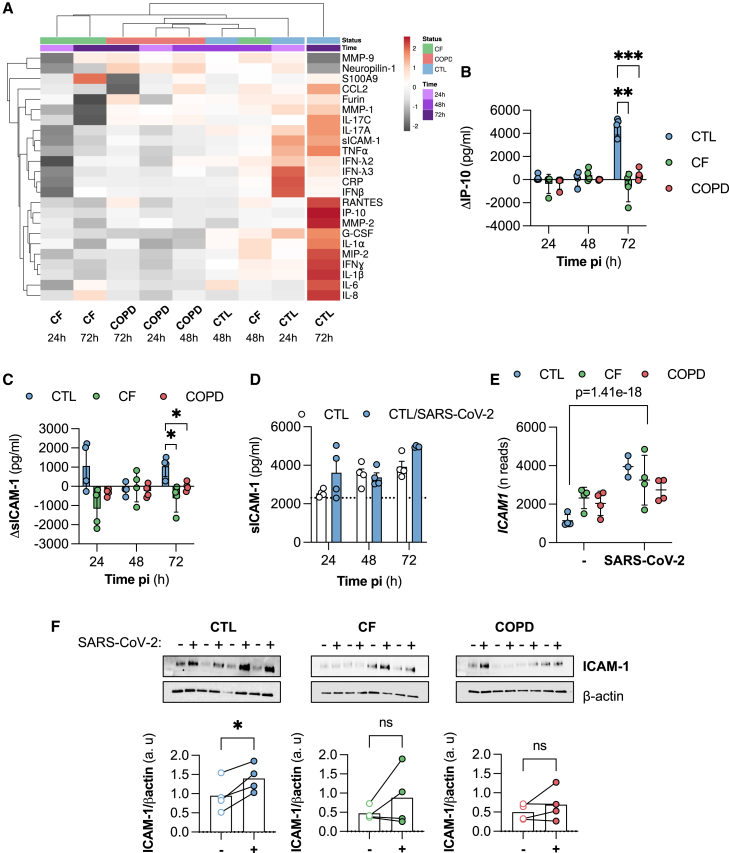
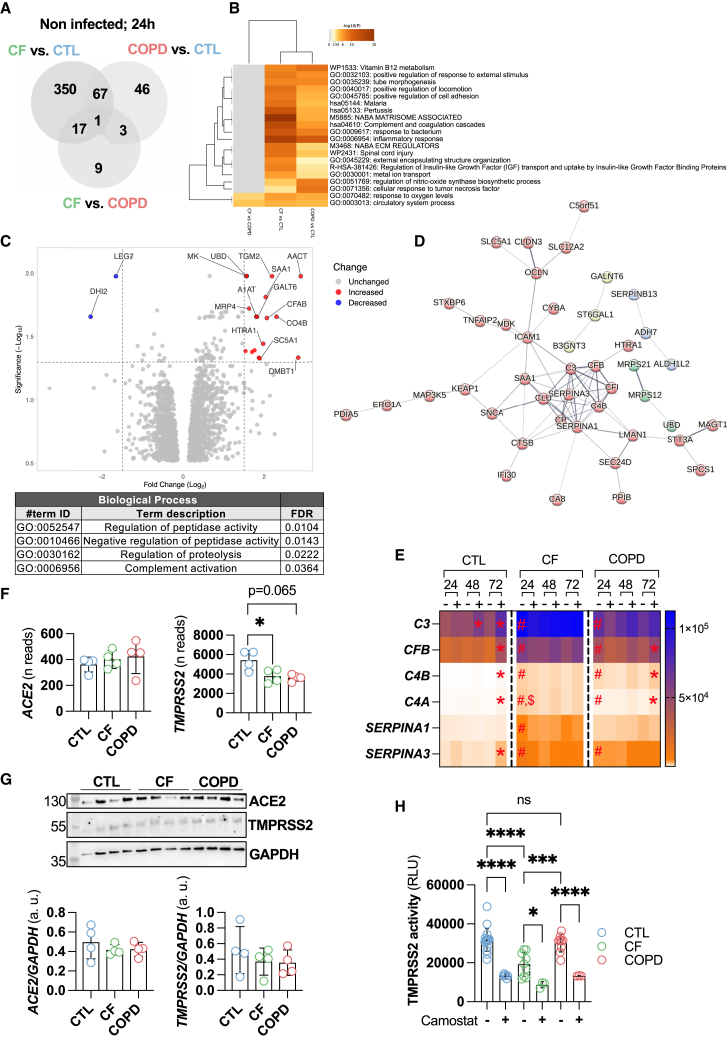
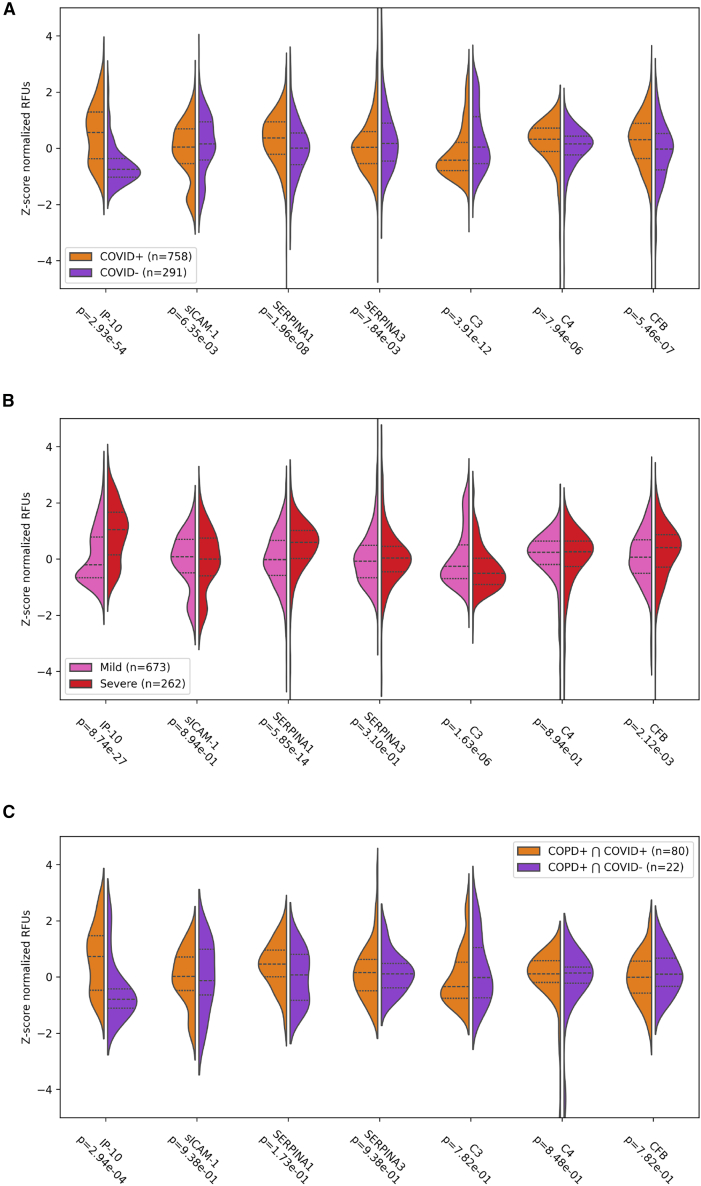
Pre-existing respiratory diseases may influence coronavirus disease (COVID-19) susceptibility and severity. However, the molecular mechanisms underlying the airway epithelial response to severe acute respiratory syndrome coronavirus 2 (SARS-CoV-2) infection severity in patients with chronic respiratory diseases remain unelucidated. Using an in vitro model of differentiated primary bronchial epithelial cells, we aimed to investigate the molecular mechanisms of SARS-CoV-2 infection in pre-existing cystic fibrosis (CF) and chronic obstructive pulmonary disease (COPD). Our study revealed reduced susceptibility of CF and COPD airway epithelia to SARS-CoV-2, relative to that in healthy controls. Mechanistically, reduced transmembrane serine protease 2 (TMPRSS2) activity potentially contributed to this resistance of CF epithelium. Upregulated complement and inflammatory pathways in CF and COPD epithelia potentially primed the antiviral state prior to infection. Analysis of a COVID-19 patient cohort validated our findings, correlating specific inflammatory markers (IP-10, SERPINA1, and CFB) with COVID-19 severity. This study elucidates SARS-CoV-2 pathogenesis and identifies potential biomarkers for clinical monitoring.

Keywords: Microbiology; Respiratory medicine; Virology.


Conflict of interest statement

The authors declare no competing interests.

Figures

None
Graphical abstract
Figure 1
Figure 1
Severe acute respiratory syndrome coronavirus 2 (SARS-CoV-2) infection features in reconstituted bronchial human airway epithelium (HAE) obtained from control (CTL), chronic obstructive pulmonary disease (COPD), and cystic fibrosis (CF) donors (A) Summary of the experimental design: HAE obtained from four different donors for each group were mock-infected or infected with SARS-CoV-2 (multiplicity of infection [MOI] = 0.1) for 24, 48, or 72 h. Thus, to conduct the various analyses, the experiment includes two sets, each comprising a total of 72 HAE. (B–D) At each time point, transepithelial electrical resistance (TEER; ohms.cm2) was measured for the CTL (B), CF (C), and COPD (D) groups. Data are the mean (±SD) TEERs measured in each group, CTL, CF, and COPD, each of which includes 4 donors. For each group, the number of values represented (n = 8) corresponds to two independent measurements per individual (2 independent epithelium sets—see A). Two-way analysis of variance (ANOVA) was used with Sidak’s multiple comparisons test. ∗, ∗∗ and ∗∗∗∗ for p < 0.05, p < 0.01 and p < 0.0001, respectively. (E) Data are the mean (±SD) of the change in TEER between infected and mock condition and were determined at each time point for the three groups (n = 8/group). Two-way ANOVA was used with Tukey’s multiple comparisons test. ∗ and ∗∗∗∗ for p < 0.05, p < 0.0001, respectively. (F and G) Kinetics of (F) apical (relative to input as the reference = 1) and (G) intracellular (relative to that of the housekeeping gene GAPDH) nsp14 mRNA expression determined using quantitative reverse transcriptase-polymerase chain reaction. Data are the mean (±SD) of relative gene expression at each time point for the three groups (n = 8/group). Two-way ANOVA was used with Tukey’s multiple comparisons test. ∗ for p < 0.05, respectively. (H) Confocal images of mock-infected (left image) and SARS-CoV-2-infected HAE CTL cells (MOI = 0.1; 72 h) stained for ZO-1 (green) (middle image) and co-stained with the SARS-CoV-2 nucleocapsid (gradient) (overlay, right image). Nuclei were stained with DAPI (yellow). Images were taken at a magnification of ×63 (scale bar 50 μm).
Figure 2
Figure 2
Specific antiviral response in healthy (CTL) reconstituted bronchial HAE (A) Venn diagram depicting the total number of differentially expressed genes (DEGs) (padjBH<0.05, log2FC > 1 and <−1, Base mean > 20) in CTL HAE infected with SARS-CoV-2 (MOI = 0.1) for 24, 48, or 72 h. (B) Heatmap of biological pathways involved in SARS-CoV-2 response of CTL HAE cells at 48 h and 72 h. (C) Volcano plot comparison of infected and mock-infected CTL cells (padjBH cut-off 1.3, log2FC cut-off: 1/−1). (D–L) Kinetics of IP-10 (D), G-CSF (E), RANTES (F), IL-1β (G), IFN-λ2 (IL-28B) (H), TNF-α (I), IL-17A (J), IFN-γ (K), IL-8 (L) production in CTL HAE cells infected with SARS-CoV-2 (MOI = 0.1) for 24, 48, or 72 h. Data are the mean (±SD) of cytokine expression at each time point (n = 4/group). Two-way ANOVA was used with Sidak’s multiple comparisons test. ∗, ∗∗ and ∗∗∗∗ for p < 0.05, p < 0.01 and p < 0.0001, respectively. See Figures S1 and S2.
Figure 3
Figure 3
Specific antiviral response in CF and COPD reconstituted bronchial HAE (A) Venn diagram depicting the total number of DEGs (padjBH < 0.05, log2FC > 1 and <-1, Base mean > 20) in CF HAE cells infected with SARS-CoV-2 (MOI = 0.1) for 24, 48, or 72 h. (B) Heatmap of biological pathways involved in SARS-CoV-2 response of CF HAE at 48 h and 72 h. (C) Volcano plot comparison of infected and mock-infected CF cells (padjBH cut-off 1.3, log2FC cut-off: 1/−1). (D) Kinetics of Matrix metalloproteinase-9 (MMP-9) production in CF HAE infected with SARS-CoV-2 (MOI = 0.1) for 24, 48, or 72 h. Data are the mean (±SD) of MMP-9 expression at each time point (n = 4/group). ∗∗∗p < 0.001 two-way ANOVA was used with Sidak’s multiple comparisons test. (E) Venn diagram depicting the total number of DEGs (padjBH<0.05, log2FC > 1 and <−1, Base mean > 20) in COPD HAE infected with SARS-CoV-2 (MOI = 0.1) for 24, 48, or 72 h. (F) Heatmap of biological pathways involved in SARS-CoV-2 response of COPD HAE at 48 h and 72 h. (G) Volcano plot comparison of infected and mock-infected COPD cells (padjBH cut-off 1.3, log2FC cut-off: 1/−1). (H) Kinetics of CXCL-10 production in COPD HAE infected with SARS-CoV-2 (MOI = 0.1) for 24, 48, or 72 h. Data are the mean (±SD) of IP-10 expression at each time point (n = 4/group). ∗p < 0.05 two-way ANOVA was used with Sidak’s multiple comparisons test. See Figures S1 and S2.
Figure 4
Figure 4
Comparison of transcriptomic signature of CTL, CF, and COPD reconstituted bronchial HAE with time (A) Total number (up- and downregulated) of DEGs in HAE from CF, COPD, and CTL donors infected with SARS-CoV-2 (MOI = 0.1) for 24, 48, or 72 h. (B) Venn diagram depicting the total number of DEGs (padjBH < 0.05, log2FC > 1 and <−1, Base mean > 20) in the CTL, CF, and COPD HAE infected with SARS-CoV-2 (MOI = 0.1) for 48 or 72 h. (C) Heatmap of biological pathways involved in SARS-CoV-2 response of CTL, CF, and COPD HAE cells at 48 h and 72 h. (D) Venn diagram depicting the total number of DEGs (padjBH < 0.05, log2FC > 1 and <−1, Base mean > 20) at 72 h among SARS-CoV-2-infected HAE from CTL, CF, and COPD groups. Gene ontology enrichment analysis was performed with ShinyGO 0.8, using a list of specific DEGs (when the number of DEGs is sufficient). The charts represent the most enriched biological processes; the size and color of the dots indicate the number of genes and the false discover rate (-log10[FDR]). See Figures S3 and S4.
Figure 5
Figure 5
Comparison of inflammatory responses from CTL, CF, and COPD reconstituted bronchial HAE with time heatmap (A) (ClustVis options: clustering distance rows/columns: correlation; clustering method rows/columns: average) of mean comparative production data (Δ = differences between production measured without and with infection in each group; n = 4) with time (24, 48, or 72 h) of inflammatory mediators, including IP-10. (B) between CTL, CF, and COPD HAE infected with SARS-CoV-2 (MOI = 0.1) at each time point. ∗∗p < 0.01, ∗∗∗p < 0.001 two-way ANOVA was used with Tukey’s multiple comparisons test. (C) Kinetic of ΔsICAM-1 (infected/non-infected) mean (±SD) expression using enzyme-linked immunosorbent assay (ELISA) in bronchial epithelial cells from CTL, CF, and COPD groups (n = 4/group) infected with SARS-CoV-2 (MOI = 0.1) for 24, 48, and 72 h. ∗p < 0.05 two-way ANOVA was used with Tukey’s multiple comparisons test. (D–F) (D) Kinetics of sICAM-1 mean (±SD) expression using ELISA in mock-infected or SARS-CoV-2-infected (MOI = 0.1) CTL group (n = 4) at 24, 48, and 72 h. ∗p < 0.05 two-way ANOVA was used with Sidak’s multiple comparisons test (E) ICAM-1 mRNA (mean number (n) ± SD of reads, extracted RNA-seq data) (F) and protein (relative expression after normalization against β-actin) expressions in CF, COPD, and CTL HAE (n = 4/group) infected with SARS-CoV-2 (MOI = 0.1) for 72 h. ∗p < 0.05 paired t test. See Figure S6.
Figure 6
Figure 6
Comparison of transcriptomic and proteomic signatures of initial infection-free states among CTL, CF, and COPD reconstituted bronchial HAE (A) Venn diagram depicting the total number of DEGs among non-infected CTL, CF, and COPD HAE at 24 h (padjBH<0.05). (B) Heatmap of biological pathways involved in the initial infection-free state of CTL, CF, and COPD HAE at 24 h. (C) Volcano plot for comparison of protein expressions between non-infected CF and CTL HAE at 24 h (padjBH cut-off 1.3, log2FC cut-off: 1.5/-1.5). (D) Network (STRING) of predicted associations of the proteins coded by the 86 differentially expressed proteins between non-infected CF and CTL HAE cells at 24 h. The network nodes are proteins, and the edges represent the predicted functional associations. Line thickness indicates the strength of data support. Four clusters (K-means clustering) have been identified (light and dark green, red and blue). (E) Temporal comparison of the mean (±SD) expressions of various transcripts among CTL, CF, and COPD HAE (n = 4/group) in uninfected or SARS-COV-2-infected conditions (∗padjBH < 0.05: uninfected (−) vs. (+) SARS-CoV-2; (#padjBH < 0.05: CF vs. CTL or COPD vs. CTL at 24 h uninfected; $padjBH < 0.05: CF vs. COPD at 24 h uninfected). (F and G) (F) Angiotensin-converting enzyme 2 (ACE2) and TMPRSS2 mRNA (mean number (n) (±SD) of reads, extracted RNA-seq data, padjBH < 0.05) and (G) protein expressions in CTL, CF, and COPD HAE (n = 4/group) not infected at 24 h. Data are the mean (±SD) of relative TMPRSS2 and ACE2 protein expressions after normalization against GAPDH. One-way analysis of variance (ANOVA) was used with Tukey’s multiple comparisons test. (H) TMPRSS2 activity in HAE cells from two CTL (n = 9 independent inserts per donor), one CF donor (n = 9 independent inserts) and one COPD donor (n = 9 independent inserts) treated or not with camostat mesylate (n = 3 independent inserts for each donor). ∗p < 0.05, ∗∗∗p < 0.001, ∗∗∗∗p < 0.0001; One-way analysis of variance (ANOVA) was used with Sidak’s multiple comparisons test.
Figure 7
Figure 7
Analysis of Inflammatory markers in the BQC19 cohort Violin plot of expression levels (z-scores) of IP-10, sICAM-1, SERPINA1, SERPINA3, C3, C4, and CFB proteins between COVID+ and COVID-patients (A), severe and moderate COVID+ patients (B) and COVID+ and COVID-patients with COPD (C).

References

    1. Zhang J.J., Dong X., Liu G.H., Gao Y.D. Risk and Protective Factors for COVID-19 Morbidity, Severity, and Mortality. Clin. Rev. Allergy Immunol. 2023;64:90–107. doi: 10.1007/s12016-022-08921-5. - DOI - PMC - PubMed
    1. Conway F.M., Bloom C.I., Shah P.L. Susceptibility of Patients with Airway Disease to SARS-CoV-2 Infection. Am. J. Respir. Crit. Care Med. 2022;206:696–703. doi: 10.1164/rccm.202111-2547PP. - DOI - PMC - PubMed
    1. Naehrlich L., Orenti A., Dunlevy F., Kasmi I., Harutyunyan S., Pfleger A., Keegan S., Daneau G., Petrova G., Tješić-Drinković D., et al. Incidence of SARS-CoV-2 in people with cystic fibrosis in Europe between February and June 2020. J. Cyst. Fibros. 2021;20:566–577. doi: 10.1016/j.jcf.2021.03.017. - DOI - PMC - PubMed
    1. Corvol H., de Miranda S., Dehillotte C., Lemonnier L., Chiron R., Danner-Boucher I., Hamidfar R., Houdouin V., Macey J., Marguet C., et al. Cumulative Incidence and Risk Factors for Severe Coronavirus Disease 2019 in French People With Cystic Fibrosis. Clin. Infect. Dis. 2022;75:2135–2144. doi: 10.1093/cid/ciac333. - DOI - PMC - PubMed
    1. Gerayeli F.V., Milne S., Cheung C., Li X., Yang C.W.T., Tam A., Choi L.H., Bae A., Sin D.D. COPD and the risk of poor outcomes in COVID-19: A systematic review and meta-analysis. EClinicalMedicine. 2021;33 doi: 10.1016/j.eclinm.2021.100789. - DOI - PMC - PubMed

LinkOut - more resources