. 2025 Feb 28;14(2):808-826.
doi: 10.21037/tcr-24-1047. Epub 2025 Feb 17.

Nomogram for predicting survival in breast cancer with lung metastasis based on SEER data

Affiliations

Nomogram for predicting survival in breast cancer with lung metastasis based on SEER data

Cheng-Liang Chen et al. Transl Cancer Res. .

Abstract

Background: The incidence of breast cancer (BC) has been steadily increasing, highlighting the need for a predictive model to assess the survival prognosis of BC patients. The objective of this research was to formulate a prognostic nomogram framework tailored to forecast survival among individuals diagnosed with BC with lung metastasis (BCLM).

Methods: Our information was sourced from the Surveillance, Epidemiology, and End Results (SEER) database. Individuals who were diagnosed with BC from 2010 to 2015 were selected. The 4,309 collected participants were randomly separated into a training cohort (n=3,231) and a validation cohort (n=1,078). In this study, age, marital status, race, tumor location, laterality, type of primary surgery, surgical margin, tumor grade, tumor (T) stage, node (N) stage, as well as the use of radiotherapy and chemotherapy, were identified as potential prognostic factors. The overall survival (OS) and breast cancer-specific survival (CSS) were defined as the primary endpoints of this study. Univariate and multivariate analyses were conducted to assess the impact of different factors on prognosis. Structured nomograms were developed to improve the prediction of OS and CSS. The concordance index (C-index), receiver operating characteristic (ROC) curves, calibration curves, and decision curve analysis (DCA) were employed to estimate the performance of the nomogram.

Results: The nomograms incorporated age, marital status, race, primary surgery or not, BC subtype, grade, T stage, and the use of chemotherapy or not. The C-index for OS was 0.77, and it was 0.77 in CSS for the training group. The C-indexes for the control group of OS and CSS prediction were 0.78 and 0.78, respectively. ROC curves, calibration plots, and DCA curves displayed excellent predictive validity. The results indicate a median survival time of 1.67 years [95% confidence interval (CI): 1.58-1.83], with a total of 3,640 deaths recorded. Survival time was found to be associated with factors such as age, marital status, race, whether primary site surgery was performed, BC subtype, tumor grade, T stage, and the administration of chemotherapy.

Conclusions: Nomograms were created to predict OS and CSS for individuals diagnosed with BCLM. The nomogram has a reliable and valid prediction power; it could perhaps assist physicians in calculating patients' mortality risk.

Keywords: Nomograms; Surveillance, Epidemiology, and End Results program (SEER program); breast neoplasms; lung metastasis; prognosis.


Conflict of interest statement

Conflicts of Interest: All authors have completed the ICMJE uniform disclosure form (available at https://tcr.amegroups.com/article/view/10.21037/tcr-24-1047/coif). All authors report that this study was supported by the Wenzhou Medical and Health Scientific Research Project (project plan No. 2022012). The authors have no other conflicts of interest to declare.

Figures

Figure 1
Figure 1
X-tile analysis determined the optimal threshold for the age of diagnosis. The ideal age thresholds based on OS were 59 and 79 years old. Histograms and Kaplan-Meier analyses were constructed using the specified thresholds. The red scale bar represents the percentage of younger individuals, whereas the green scale bar denotes the percentage of older individuals. The curves in the graph correspond to the columns in the histogram: blue lines indicate low-risk age groups, gray lines denote moderate-risk age groups, and purple lines signify high-risk age groups. Blue bar indicates low-risk age groups, gray bar denotes moderate-risk age groups, and purple bar signifies high-risk age groups. OS, overall survival.
Figure 2
Figure 2
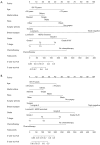
Nomograms for projecting OS (A) and CSS (B) at 3 and 5 years in individuals diagnosed with BCLM. Connect each factor to its corresponding point on the axis with a vertical line to establish the points for each factor. Predicted survival is then calculated by tracing the vertical line that extends from the accumulated points on the scale to intersect with either the OS or CSS axis. BCLM, breast cancer with lung metastasis; CSS, cancer-specific survival; HER2, human epidermal growth factor receptor 2; OS, overall survival.
Figure 3
Figure 3
The ROC curves were generated for 3- and 5-year OS (A) and CSS (B) within the training cohort. AUC, area under the curve; CSS, cancer-specific survival; OS, overall survival; ROC, receiver operating characteristic; y, year.
Figure 4
Figure 4
Calibration plot in the training set. Nomogram calibration curves are provided for 3-year (A) and 5-year (B) OS, as well as for 3-year (C) and 5-year (D) CSS. The cohort was stratified into triads, with consistent specimens for internal verification. The dotted lines represent a strong correlation between authentic survival outcomes (y-axis) and nomogram forecasts (x-axis). The more closely the dashed line aligns with the plotted values, the greater the precision of the forecasts. CSS, cancer-specific survival; OS, overall survival.
Figure 5
Figure 5
Calibration plots were generated in the validation set. Nomogram calibration curves were constructed for 3-year (A) and 5-year (B) OS, as well as for 3-year (C) and 5-year (D) CSS. The sample was stratified into three groups with equal numbers of participants for external verification. Dashed lines denote optimal alignment between observed survival outcomes (y-axis) and nomogram predictions (x-axis). Proximity of the dashed line to data points indicates elevated forecast precision. CSS, cancer-specific survival; OS, overall survival.
Figure 6
Figure 6
DCA depicting the nomogram’s performance within the training dataset. The decision curves illustrate 3-year (A) and 5-year (B) OS, as well as for 3-year (C) and 5-year (D) CSS. The x-axis denotes different probability thresholds, while the y-axis depicts net proceeds derived from the true positive rate minus the false positive rate. When a line extends horizontally across the chart, it signifies that there were no occurrences of patient mortality, and the yellow line suggests that beneath a particular threshold, all individuals will have succumbed. The black line is on behalf of the net proceeds from employing the nomogram. CSS, cancer-specific survival; DCA, decision curve analysis; OS, overall survival.
Figure 7
Figure 7
DCA for the nomogram were generated in the validation group, illustrating decision curves for 3-year (A) and 5-year (B) OS, as well as for 3-year (C) and 5-year (D) CSS. Threshold probabilities are represented by the x-axis, while the y-axis demonstrates the net benefit counted by subtracting the false positives rate from the true positives rate. A level line adjacent to the x-axis signifies no patient mortality, whereas a yellow line indicates each individual is predicted to decease below a specific level. The black line illustrates the net benefit obtained from utilizing the nomogram. CSS, cancer-specific survival; DCA, decision curve analysis; OS, overall survival.
Figure 8
Figure 8
Kaplan-Meier curves illustrating OS and CSS for high- and low-risk patients. CSS, cancer-specific survival; OS, overall survival.

References

    1. Bakarman M, Kalthoum D, Wahby Salem I, et al. Barriers to Using Breast Cancer Screening Methods Among Adult Females in Jeddah, Saudi Arabia: A Cross-Sectional Study. Cureus 2023;15:e41739. 10.7759/cureus.41739 - DOI - PMC - PubMed
    1. Cheng S, Wan X, Yang L, et al. RGCC-mediated PLK1 activity drives breast cancer lung metastasis by phosphorylating AMPKα2 to activate oxidative phosphorylation and fatty acid oxidation. J Exp Clin Cancer Res 2023;42:342. 10.1186/s13046-023-02928-2 - DOI - PMC - PubMed
    1. Liang Y, Zhang H, Song X, et al. Metastatic heterogeneity of breast cancer: Molecular mechanism and potential therapeutic targets. Semin Cancer Biol 2020;60:14-27. 10.1016/j.semcancer.2019.08.012 - DOI - PubMed
    1. Kimura D, Kaneta A, Muto C, et al. Solitary mediastinal metastasis from breast cancer after 14 years: case report. Shanghai Chest 2024;8:19. 10.21037/shc-24-9 - DOI
    1. Araghi M, Mannani R, Heidarnejad Maleki A, et al. Recent advances in non-small cell lung cancer targeted therapy; an update review. Cancer Cell Int 2023;23:162. 10.1186/s12935-023-02990-y - DOI - PMC - PubMed