CALD1 inhibits invasion of human ovarian cancer cells by affecting cytoskeletal structure and the number of focal adhesion
- PMID: 40104711
- PMCID: PMC11912064
- DOI: 10.21037/tcr-24-1375
CALD1 inhibits invasion of human ovarian cancer cells by affecting cytoskeletal structure and the number of focal adhesion
Abstract
Background: Ovarian cancer (OV) is associated with the highest mortality rate among gynecological cancers, largely due to late diagnosis and chemoresistance. The identification of novel diagnostic markers and therapeutic targets is crucial. Caldesmon 1 (CALD1), a cytoskeleton-regulating protein, has been implicated in various cancers. This study aims to investigate the expression and functional significance of CALD1 in OV, focusing on its potential impact on cell invasion and metastasis.
Methods: We analyzed CALD1 expression using The Cancer Genome Atlas (TCGA) and Genotype-Tissue Expression (GTEx) databases, along with tissue microarray immunohistochemistry (IHC). Drug sensitivity analysis was performed using the 'oncopredict' R package. A CALD1 gene network was constructed, followed by Gene Ontology (GO) and Kyoto Encyclopedia of Genes and Genomes (KEGG) enrichment analyses. SK-OV-3 cell lines with stable CALD1 knockdown were established and verified by quantitative real-time polymerase chain reaction (qRT-PCR) and western blot (WB). We then assessed cell invasiveness using Transwell assays and visualized cytoskeletal changes through immunofluorescence staining of F-actin and Vinculin.
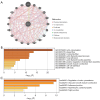
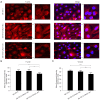
Results: The expression of CALD1 was significantly reduced in OV tissues compared to normal tissues. Patients with high and low expression levels of CALD1 showed significant differences in their response to chemotherapeutic drugs. CALD1 and its related genes were found to play an essential role in regulating cytoskeleton organization, focal adhesion formation, and cell movement processes. CALD1 knockdown cells exhibited a significant reduction in F-actin stress fibers, a loose cytoskeleton structure, decreased Vinculin expression, and enhanced migration ability.
Conclusions: Attenuated expression of CALD1 in SK-OV-3 cells leads to fewer F-actin stress fibers, reducing the association between the cytoskeleton and Vinculin. This results in reduced cellular focal adhesions and increased invasiveness of SK-OV-3 cells, promoting OV cell metastasis. These findings suggest that CALD1 may have important clinical implications in the diagnosis and treatment of OV.
Keywords: Caldesmon 1 (CALD1); Ovarian cancer (OV); cytoskeleton; focal adhesion.
Copyright © 2025 AME Publishing Company. All rights reserved.
Conflict of interest statement
Conflicts of Interest: All authors have completed the ICMJE uniform disclosure form (available at https://tcr.amegroups.com/article/view/10.21037/tcr-24-1375/coif). The authors have no conflicts of interest to declare.
Figures


Similar articles
-
Upregulation of CALD1 predicted a poor prognosis for platinum-treated ovarian cancer and revealed it as a potential therapeutic resistance target.BMC Genomics. 2024 Feb 16;25(1):183. doi: 10.1186/s12864-024-10056-0. BMC Genomics. 2024. PMID: 38365611 Free PMC article.
-
UBR1 is a prognostic biomarker and therapeutic target associated with immune cell infiltration in gastric cancer.Aging (Albany NY). 2024 Aug 23;16(16):12029-12049. doi: 10.18632/aging.206079. Epub 2024 Aug 23. Aging (Albany NY). 2024. PMID: 39181686 Free PMC article.
-
The gene expression of CALD1, CDH2, and POSTN in fibroblast are related to idiopathic pulmonary fibrosis.Front Immunol. 2024 Feb 2;15:1275064. doi: 10.3389/fimmu.2024.1275064. eCollection 2024. Front Immunol. 2024. PMID: 38370408 Free PMC article.
-
CALD1 facilitates epithelial-mesenchymal transition progression in gastric cancer cells by modulating the PI3K-Akt pathway.World J Gastrointest Oncol. 2024 Mar 15;16(3):1029-1045. doi: 10.4251/wjgo.v16.i3.1029. World J Gastrointest Oncol. 2024. PMID: 38577446 Free PMC article.
-
Hub biomarkers in ultrasound-guided bladder cancer and osteosarcoma: Myosin light chain kinase and caldesmon.Medicine (Baltimore). 2023 Dec 1;102(48):e36414. doi: 10.1097/MD.0000000000036414. Medicine (Baltimore). 2023. PMID: 38050320 Free PMC article.
References
-
- Hodson R. Ovarian cancer. Nature 2021;600:S35-S35. 10.1038/d41586-021-03713-x - DOI
LinkOut - more resources
Full Text Sources
Miscellaneous
