. 2025 Feb 28;14(2):1190-1204.
doi: 10.21037/tcr-24-1668. Epub 2025 Feb 24.

Construction of a prognostic signature for breast cancer based on genes involved in unsaturated fatty acid biosynthesis

Affiliations

Construction of a prognostic signature for breast cancer based on genes involved in unsaturated fatty acid biosynthesis

Hua Meng et al. Transl Cancer Res. .

Abstract

Background: The biosynthesis of unsaturated fatty acids (UFAs) has been implicated in the onset and advancement of breast cancer (BC). This study aimed to develop molecular subtypes and prognostic signatures for BC based on UFA-related genes (UFAGs).

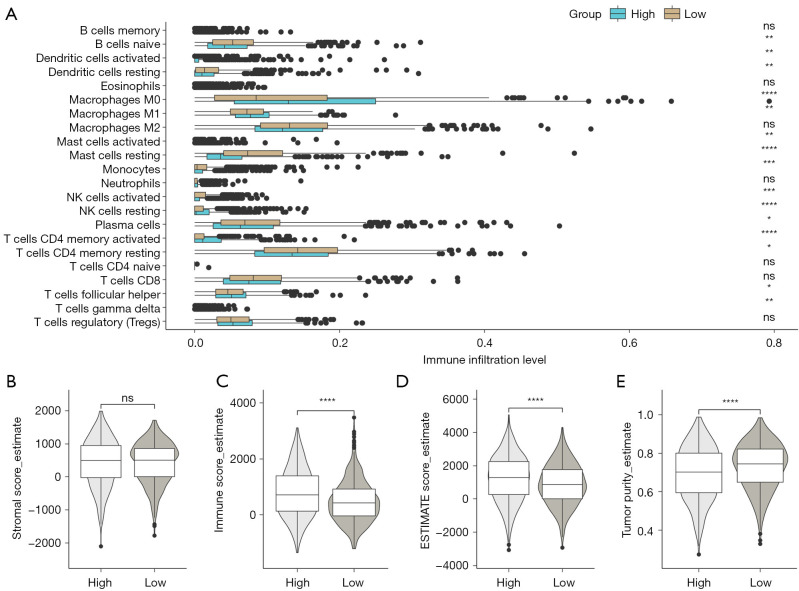
Methods: This study integrates multi-omics and survival data from public databases to elucidate molecular classifications and risk profiles based on UFAGs. Consensus clustering and Lasso Cox regression methodologies are employed for subtype identification and risk signature development, respectively. Immune microenvironment assessment is conducted using CIBERSORT and ESTIMATE algorithms, while drug sensitivity and response to immunotherapy are evaluated via pRRophetic and TIDE methods. Gene set enrichment analysis augments signature characterization, followed by nomogram construction and validation.

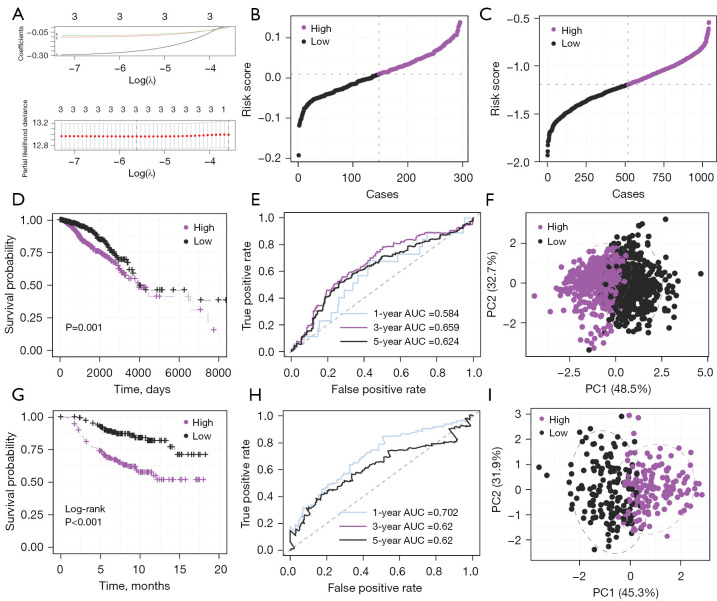
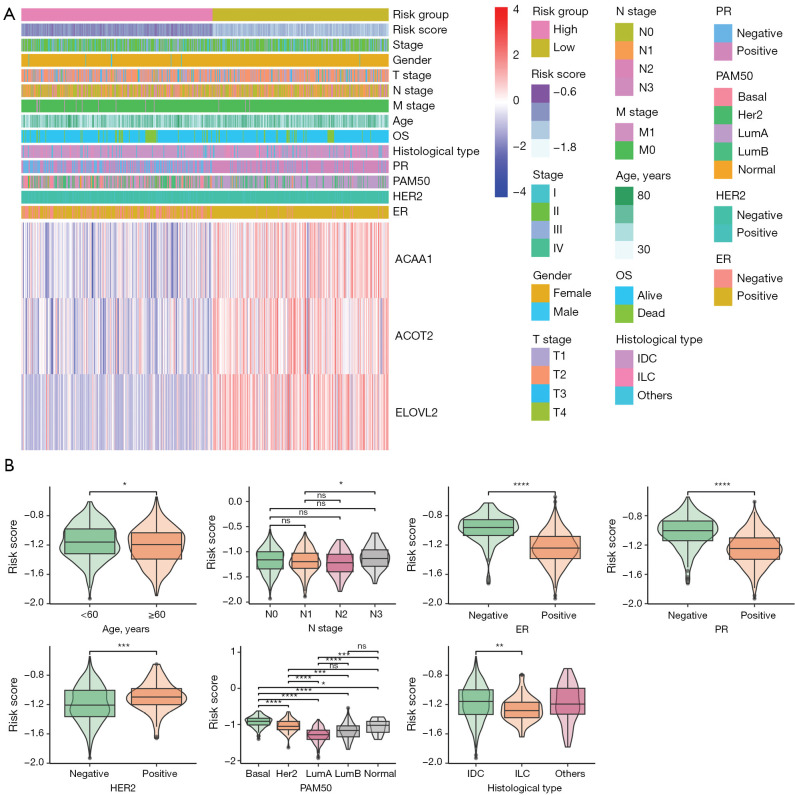
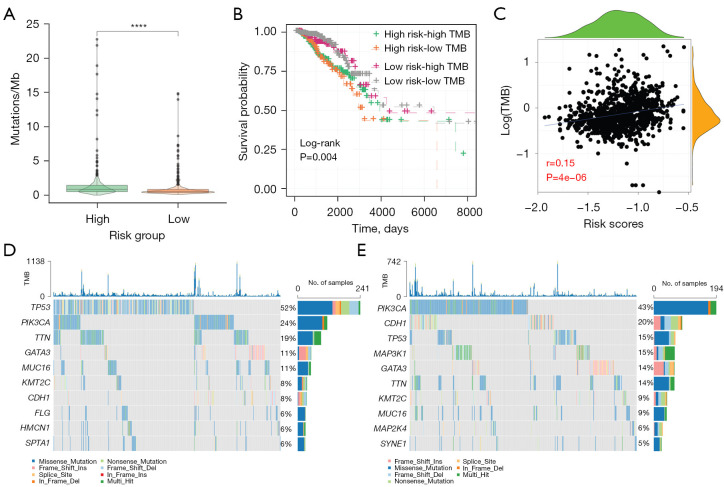
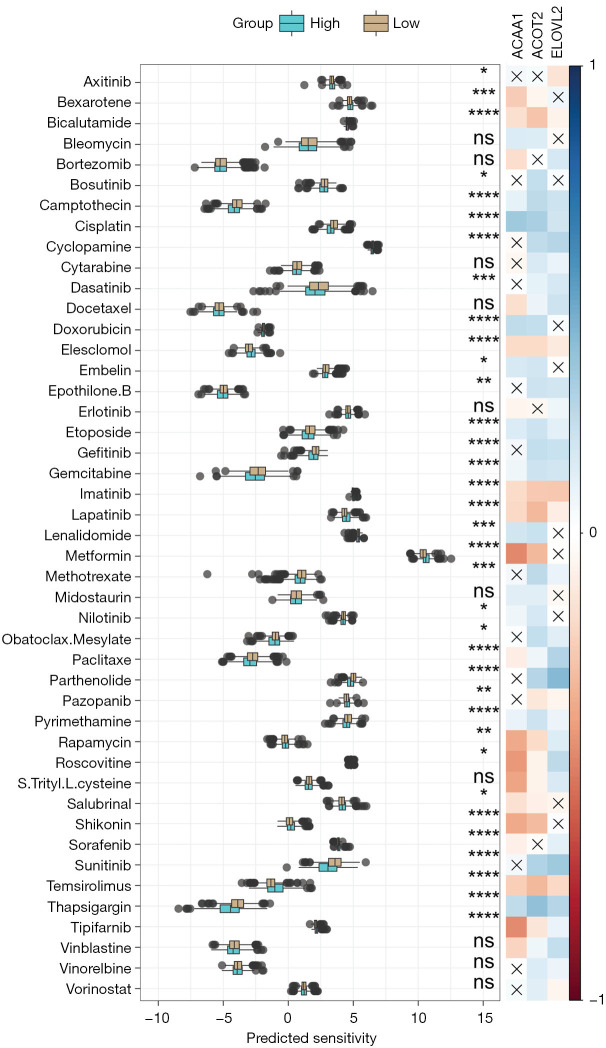
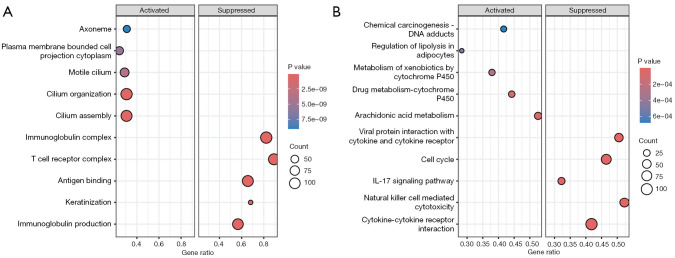
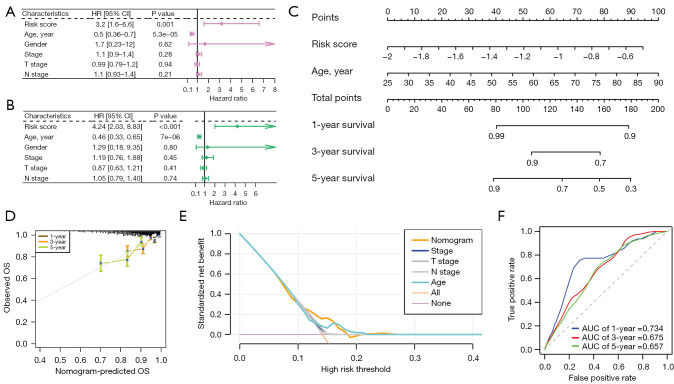
Results: We successfully identified two distinct BC molecular subtypes with significantly different prognoses utilizing UFAGs correlated with outcomes. A prognostic signature comprising three UFAGs [acetyl-CoA acyltransferase 1 (ACAA1), acyl-CoA thioesterase 2 (ACOT2), and ELOVL fatty acid elongase 2 (ELOVL2)] is developed, stratifying patients into high- and low-risk groups exhibiting divergent outcomes, clinicopathological traits, gene expression patterns, immune infiltration profiles, therapeutic susceptibility, and immunotherapy responses. The signature demonstrates robust prognostic performance in both training and validation cohorts, emerging as an independent predictor alongside age, which is integrated into a nomogram. Decision curve analysis highlights the nomogram's superiority over other factors in prognosis prediction. Calibration plots and receiver operating characteristic curves affirm its excellent performance in BC prognosis assessment.

Conclusions: Expression profiles of UFAGs are associated with BC prognosis, enabling the creation of a risk signature with implications for understanding the molecular mechanisms underlying BC progression.

Keywords: Unsaturated fatty acids (UFAs); breast cancer (BC); consensus clustering; immune microenvironment; nomogram.


Conflict of interest statement

Conflicts of Interest: All authors have completed the ICMJE uniform disclosure form (available at https://tcr.amegroups.com/article/view/10.21037/tcr-24-1668/coif). The authors have no conflicts of interest to declare.

Figures

Figure 1
Figure 1
Expression, prognostic, and mutational characteristics of unsaturated fatty acid-associated genes in the TCGA-BRCA cohort. (A) Identification of five UFAGs significantly associated with breast cancer prognosis through univariate Cox regression analysis. (B) Oncoplot illustrating somatic mutations of UFAGs in the TCGA-BRCA cohort. (C) Volcano plot depicting differential expression analysis of UFAGs in the TCGA-BRCA cohort. (D) Kaplan-Meier survival curves distinguishing two subtypes derived from consensus clustering. (E) Principal component analysis effectively separating C1 and C2 subtypes based on five prognostic UFAGs in the TCGA-BRCA cohort. TCGA, The Cancer Genome Atlas; BRCA, breast invasive carcinoma; UFAG, unsaturated fatty acids-related genes; HACD1, 3-hydroxyacyl-CoA dehydratase 1; ELOVL2, ELOVL fatty acid elongase 2; ACOT4, acyl-CoA thioesterase 4; ACOT2, acyl-CoA thioesterase 2; ACOT1, acyl-CoA thioesterase 1; PC, principal component; TMB, tumor mutation burden.
Figure 2
Figure 2
Construction and evaluation of UFAGs-related risk signature. (A) Lasso Cox regression analysis for feature selection. (B,C) Risk score distribution and patient stratification in the TCGA-BRCA and Vijver2002 cohorts. (D-F) Survival analysis, receiver operating characteristic curve analysis, and PCA for the TCGA-BRCA cohort. (G-I) Equivalent analyses for the Vijver2002 cohort. TCGA, The Cancer Genome Atlas; BRCA, breast invasive carcinoma; UFAG, unsaturated fatty acids-related genes; PCA, principal component analysis; AUC, area under the curve; PC, principal component.
Figure 3
Figure 3
Association of risk signature with clinical-pathological features. (A) Heatmap of expression for risk signature-related UFAGs annotated with clinical-pathological information. (B) Comparative analysis of risk scores across different clinical-pathological subgroups. ns, not significant; *, P<0.05; **, P<0.01; ***, P<0.001; ****, P<0.0001. UFAG, unsaturated fatty acids-related genes; OS, overall survival; PR, progesterone receptor; HER2, human epidermal growth factor 2; ER, estrogen receptor; ACAA1, acetyl-CoA acyltransferase 1; ACOT2, acyl-CoA thioesterase 2; ELOVL2, ELOVL fatty acid elongase 2; IDC, infiltrating ductal carcinoma; ILC, infiltrating lobular carcinoma.
Figure 4
Figure 4
Relationship between risk signature and somatic mutations. (A) Comparison of TMB between high- and low-risk groups. ****, P<0.0001. (B) Survival analysis contrasting different risk and TMB groups. (C) Scatter plot depicting the correlation between risk score and TMB. (D,E) Top 10 most frequently mutated genes in high-risk and low-risk groups, respectively. TMB, tumor mutation burden.
Figure 5
Figure 5
Association with the tumor immune microenvironment. (A) Comparison of immune cell infiltration between high- and low-risk groups. (B-E) Stromal score, immune score, ESTIMATE score, and tumor purity comparison between risk groups, respectively. ns, not significant; *, P<0.05; **, P<0.01; ***, P<0.001; ****, P<0.0001.
Figure 6
Figure 6
Differential drug sensitivity and heatmap showing correlations between risk signature-related UFAGs and drug sensitivity in high- and low-risk groups. ns, not significant; *, P<0.05; **, P<0.01; ***, P<0.001; ****, P<0.0001. UFAG, unsaturated fatty acids-related genes; ACAA1, acetyl-CoA acyltransferase 1; ACOT2, acyl-CoA thioesterase 2; ELOVL2, ELOVL fatty acid elongase 2.
Figure 7
Figure 7
Association with gene expression patterns. (A) Gene Ontology term enrichment analysis. (B) Kyoto Encyclopedia of Genes and Genomes pathway enrichment analysis. IL, interleukin.
Figure 8
Figure 8
Relationship between UFAGs-derived risk signature and immune therapy response. (A) Comparison of UFAGs expression between immune therapy responders and non-responders in the GSE173839 cohort. ROC curve analysis for predicting immune therapy response using (B) ACOT2, (C) ELOVL2, (D) ACAA1 and (E) risk score in the GSE173839 cohort. (F) Comparison of the proportion of immune therapy responders between the high- and low-risk groups in the GSE173839 cohort. (G) Comparison of risk score between responders and non-responders in the GSE173839 cohort. (H) Comparison of risk score between true responders and false responders as assessed by TIDE. ns, not significant; *, P<0.05; **, P<0.01; ***, P<0.001; ****, P<0.0001. UFAG, unsaturated fatty acids-related genes; ACOT2, acyl-CoA thioesterase 2; ELOVL2, ELOVL fatty acid elongase 2; ACAA1, acetyl-CoA acyltransferase 1; TIDE, Tumor Immune Dysfunction and Exclusion; CR, complete responder; NR, non-responder; AUC, area under the curve.
Figure 9
Figure 9
Nomogram construction and evaluation based on UFAGs-related risk signature. (A,B) Univariate and multivariate Cox regression analyses. (C) Nomogram integrating risk score and age for predicting 1-, 3-, and 5-year OS in breast cancer. (D) Calibration curve, (E) decision curve, and (F) ROC analysis for nomogram validation. UFAG, unsaturated fatty acids-related genes; ROC, receiver operating characteristic; HR, hazard ratio; OS, overall survival; AUC, area under the curve; CI, confidence interval.

Similar articles

References

    1. Sung H, Ferlay J, Siegel RL, et al. Global Cancer Statistics 2020: GLOBOCAN Estimates of Incidence and Mortality Worldwide for 36 Cancers in 185 Countries. CA Cancer J Clin 2021;71:209-49. 10.3322/caac.21660 - DOI - PubMed
    1. Liang Y, Zhang H, Song X, et al. Metastatic heterogeneity of breast cancer: Molecular mechanism and potential therapeutic targets. Semin Cancer Biol 2020;60:14-27. 10.1016/j.semcancer.2019.08.012 - DOI - PubMed
    1. Bryan S, Witzel I, Borgmann K, et al. Molecular Mechanisms Associated with Brain Metastases in HER2-Positive and Triple Negative Breast Cancers. Cancers (Basel) 2021;13:4137. 10.3390/cancers13164137 - DOI - PMC - PubMed
    1. Pegram M, Jackisch C, Johnston SRD. Estrogen/HER2 receptor crosstalk in breast cancer: combination therapies to improve outcomes for patients with hormone receptor-positive/HER2-positive breast cancer. NPJ Breast Cancer 2023;9:45. 10.1038/s41523-023-00533-2 - DOI - PMC - PubMed
    1. Pu M, Messer K, Davies SR, et al. Research-based PAM50 signature and long-term breast cancer survival. Breast Cancer Res Treat 2020;179:197-206. 10.1007/s10549-019-05446-y - DOI - PMC - PubMed

LinkOut - more resources