. 2025 Feb 28;14(2):930-948.
doi: 10.21037/tcr-24-838. Epub 2025 Feb 24.

Construction of a prognostic model and analysis of related mechanisms in breast cancer based on multiple datasets

Affiliations

Construction of a prognostic model and analysis of related mechanisms in breast cancer based on multiple datasets

Xiaofeng Wan et al. Transl Cancer Res. .

Abstract

Background: Breast cancer (BC) is a common tumor among women and is a heterogeneous disease with many subtypes. Each subtype shows different clinical presentations, disease trajectories and prognoses, and different responses to neoadjuvant therapy; thus, a new and universal prognostic biomarker for BC patients is urgently needed. Our goal is to identify a novel prognostic molecular biomarker that can accurately predict the outcome of all BC subtypes and guide their clinical management.

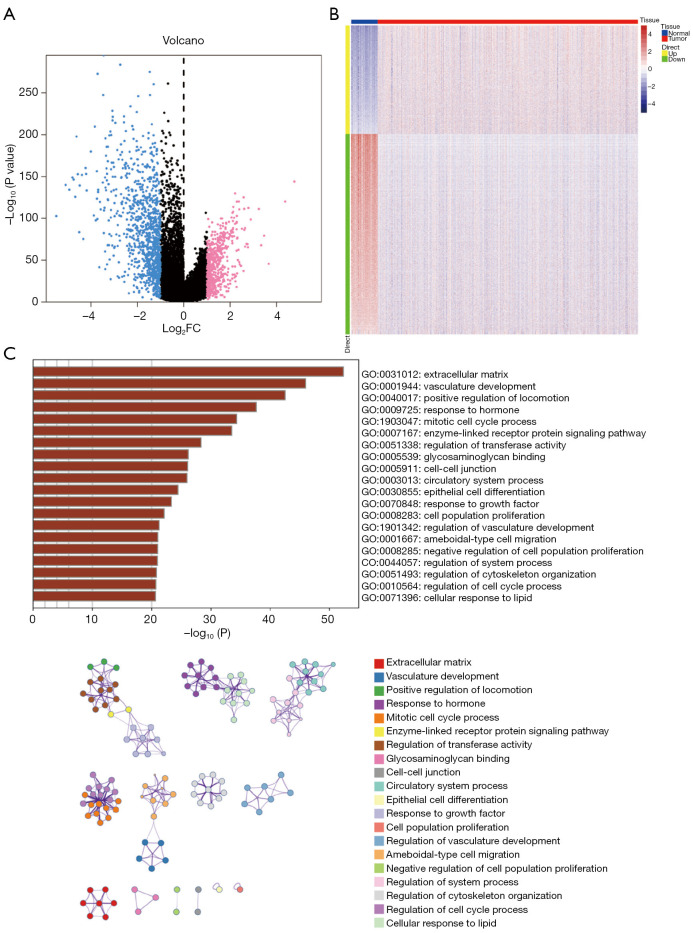
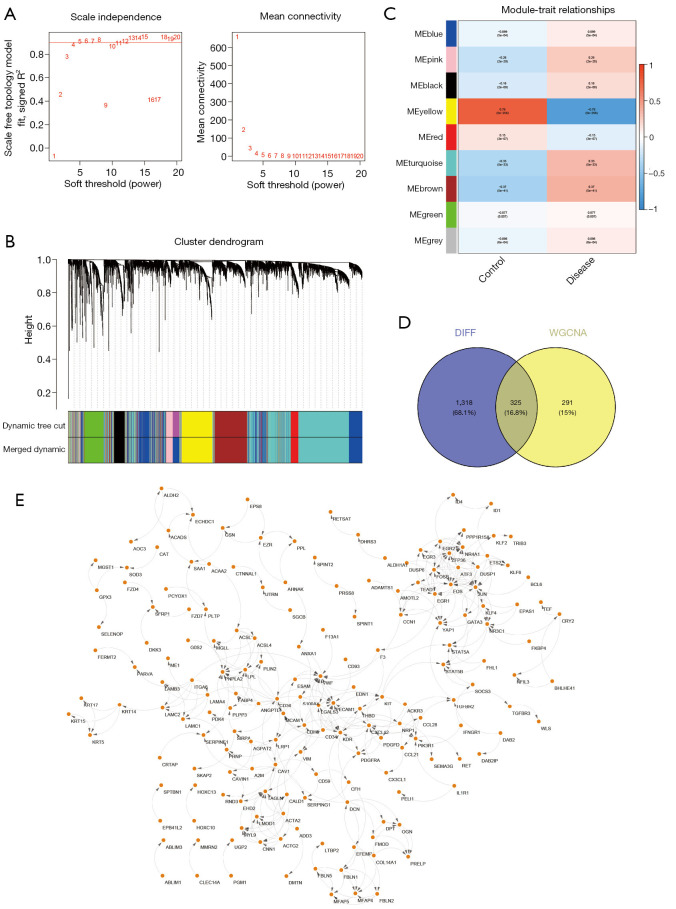
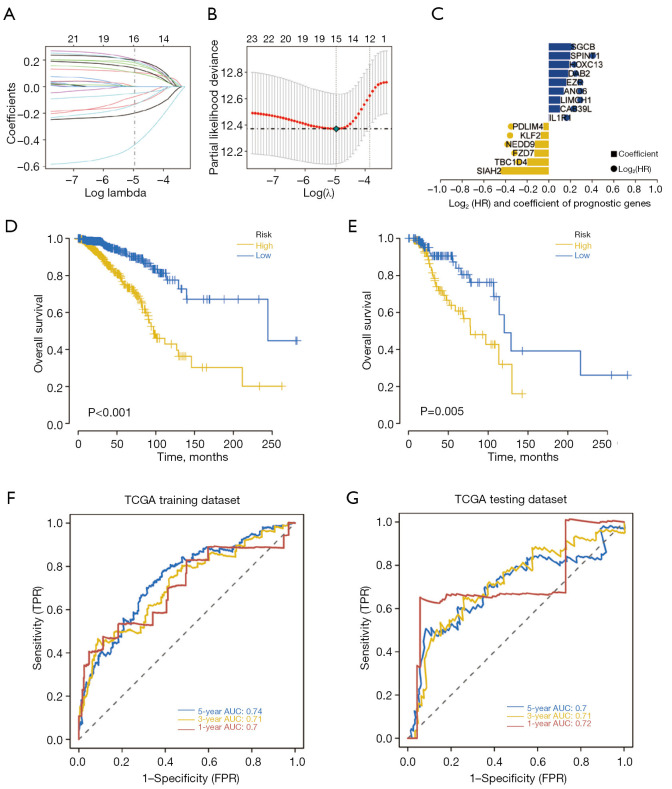
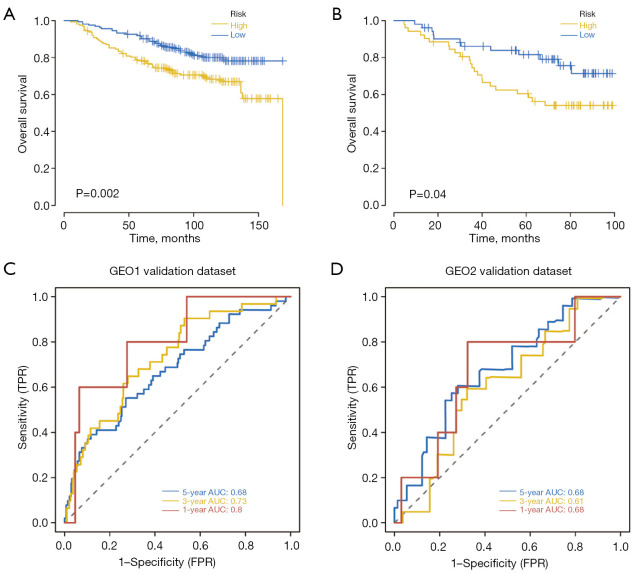
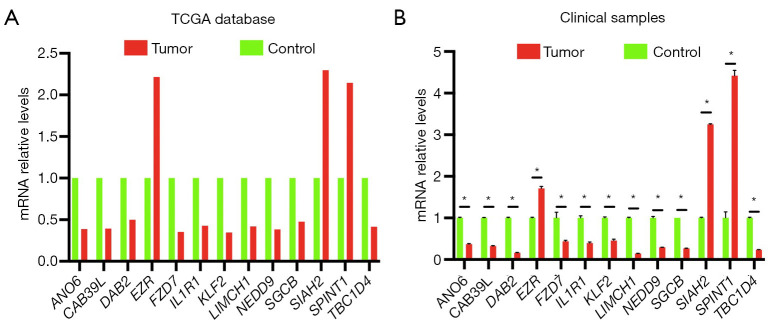
Methods: Utilizing data from The Cancer Genome Atlas (TCGA), we analyzed differential gene expression and patient clinical data. Weighted gene coexpression network analysis (WGCNA), Cox univariate regression and least absolute shrinkage and selection operator (LASSO) analysis were used to construct a prognostic model; the differential expression of the core genes in this model was validated via real-time quantitative polymerase chain reaction (RT-qPCR), and the reliability of the predictive model was validated in both an internal cohort and a BC patient dataset from the Gene Expression Omnibus (GEO) database. Further studies, such as gene set variation analysis (GSVA) and gene set enrichment analysis (GSEA), were performed to investigate the enrichment of signaling pathways. The CIBERSORT algorithm was used to estimate immune infiltration and tumor mutation burden (TMB), and drug sensitivity analysis was performed to evaluate the treatment response.

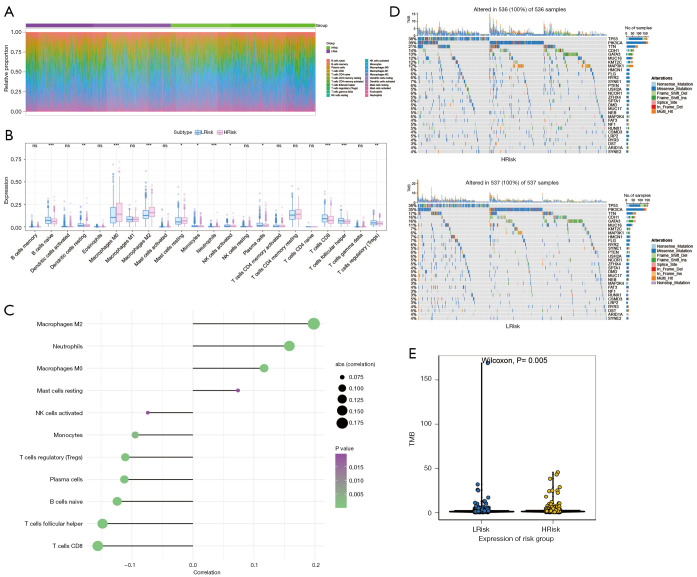
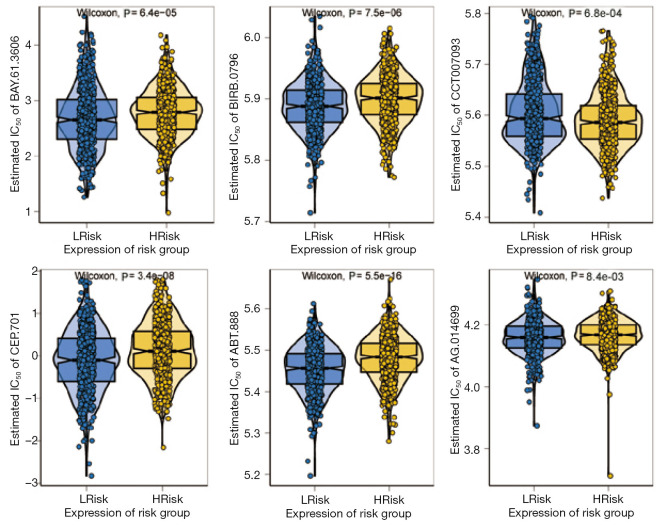
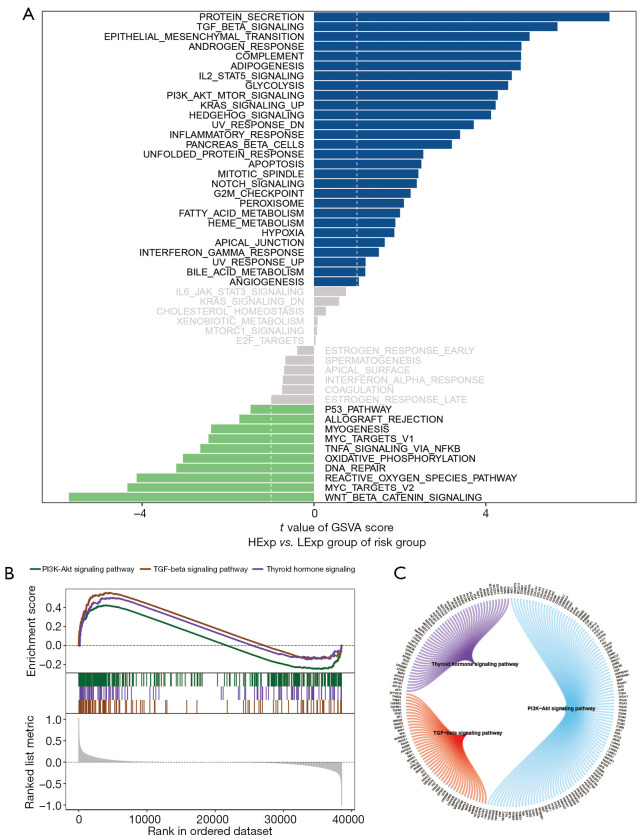
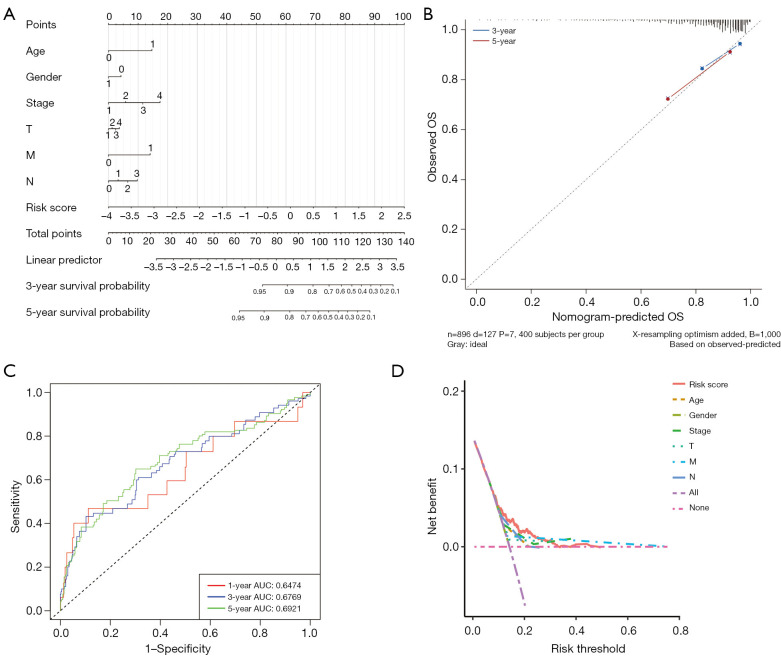
Results: A total of 1,643 differentially expressed genes were identified. After WGCNA and Cox regression combined with LASSO analysis, 15 genes were identified by screening and used to establish a prognostic gene signature. Further analysis revealed that the epithelial-mesenchymal transition (EMT) pathway gene signature was enriched in these genes. Each patient was assigned a risk score, and according to the median risk score, patients were classified into a high-risk group or a low-risk group. The prognosis of the low-risk group was better than that of the high-risk group (P<0.01), and analyses of two independent GEO validation cohorts yielded similar results. Furthermore, a nomogram was constructed and found to perform well in predicting prognosis. GSVA revealed that the EMT pathway, transforming growth factor β (TGF-β) signaling pathway and PI3K-Akt signaling pathway genes were enriched in the high-risk group, and the Wnt-β-catenin signaling pathway, DNA repair pathway and P53 pathway gene sets were enriched in the low-risk group. GSEA revealed genes related to TGF-β signaling and the PI3K-Akt signaling pathways were enriched in the high-risk group. CIBERSORT demonstrated that the low-risk group had greater infiltration of antitumor immune cells. The TMB and drug sensitivity results suggested that immunotherapy and chemotherapy are likely to be more effective in the low-risk group.

Conclusions: We established a new EMT pathway-related prognostic gene signature that can be used to effectively predict BC prognosis and treatment response.

Keywords: Breast cancer (BC); epithelial-mesenchymal transition pathway (EMT pathway); prognostic model.


Conflict of interest statement

Conflicts of Interest: All authors have completed the ICMJE uniform disclosure form (available at https://tcr.amegroups.com/article/view/10.21037/tcr-24-838/coif). The authors have no conflicts of interest to declare.

Figures

Figure 1
Figure 1
Differential gene expression and functional enrichment analysis in BC. (A) Volcano plot displaying significantly upregulated (pink), non-differentially expressed (black) and downregulated (blue) genes, between normal and tumor samples from BC patients. (B) Heatmap illustrating gene expression patterns across normal and tumor samples. (C) Bar chart demonstrating enriched GO terms, accompanied by a network plot. BC, breast cancer; FC, fold change; GO, Gene Ontology.
Figure 2
Figure 2
WGCNA for BC. (A) Scale independence and mean connectivity for selecting the appropriate soft-thresholding power in WGCNA. (B) Cluster dendrogram displaying hierarchical clustering of genes on the basis of their expression profiles. (C) Module-trait relationships showing the correlations between gene modules and clinical traits. (D) Venn diagram indicating the overlap between genes identified through differential expression analysis and those included in the WGCNA modules. (E) Gene network visualization illustrating interactions and connectivity between genes potentially involved in BC pathogenesis. BC, breast cancer; DIFF, differential expression analysis; WGCNA, weighted gene coexpression network analysis.
Figure 3
Figure 3
LASSO regression analysis and prognostic model validation for BC. (A) LASSO coefficient profiles showing variables whose coefficients decrease toward zero as lambda increases. (B) Model tuning parameter selection showing how the model was tuned for LASSO regression using cross-validation. (C) Bar plot of prognostic genes displaying coefficients of prognostic genes determined via LASSO regression, colored on the basis of the coefficients and hazard ratios. (D,E) Kaplan-Meier survival curves for the high-risk and low-risk groups in the training cohort (D) and testing cohort (E). (F,G) Receiver operating characteristic curves for validation of the predictive accuracy of the prognostic model at 1-year, 3-year, and 5-year intervals in the training cohort (F) and testing cohort (G). AUC, area under the curve; BC, breast cancer; FPR, false positive rate; HR, hazard ratio; LASSO, least absolute shrinkage and selection operator; TCGA, The Cancer Genome Atlas; TPR, true positive rate.
Figure 4
Figure 4
External validation of the BC prognostic model using GEO datasets. (A,B) Kaplan-Meier survival curves for two GEO cohorts. (C,D) ROC curves for two GEO cohorts. The curves were used to evaluate the predictive accuracy of the model at 1-year, 3-year, and 5-year intervals. AUC, area under the curve; BC, breast cancer; FPR, false positive rate; GEO, Gene Expression Omnibus; ROC, receiver operating characteristic; TPR, true positive rate.
Figure 5
Figure 5
Analysis of immune cell infiltration and gene mutation in BC patients grouped according to the risk score. (A) Immune cell composition. Bar plot showing the relative proportions of different immune cell types in the LRisk and HRisk BC patients. (B) Boxplots of immune cell expression. Boxplots comparing the expression levels of immune cell markers between the LRisk and HRisk BC groups. Significant differences in immune cell content are annotated as follows: ns, P≥0.05; *, P<0.05; **, P<0.01; ***, P<0.001. (C) Plot of the correlations between immune-infiltrating cells and the risk score. The plot illustrates the correlations between the risk score and the proportions of various immune cell types. The size of each dot corresponds to the absolute value of the correlation, with larger dots indicating a stronger correlation. The color of the dots represents the statistical significance (P value), with a color gradient from purple (higher P values) to green (lower P values). (D) Mutation landscape profile. The left panel shows the frequency of specific gene mutations in this group of samples, whereas the right panel shows the names of the mutant genes. Different colors represent various types of mutations, such as nonsense, missense, and frameshift deletions and insertions. The top panel shows the number of mutations per million bases in each sample. (E) Bee swarm plot for TMB. A comparison of TMB between the LRisk and HRisk groups. Each dot represents the TMB of an individual sample, with significant differences in mutation loads observed between the groups (Wilcoxon test P value <0.05). abs, absolute; BC, breast cancer; HRisk, high risk; NK, natural killer; TMB, tumor mutation burden.
Figure 6
Figure 6
Sensitivity analyses of 6 chemotherapeutic drugs in two risk groups. Comparison of the IC50 values of chemotherapeutic drugs in the LRisk and HRisk BC groups. BC, breast cancer; HRisk, high risk; IC50, half-maximal inhibitory concentration; LRisk, low risk.
Figure 7
Figure 7
Pathway analysis and gene set enrichment based on risk groups in BC. (A) Pathway enrichment analysis. A bar plot illustrating the enrichment scores of various signaling pathways: significantly upregulated (blue), significantly downregulated (green), and not significant (gray). The length of the bars indicates the t value of the GSVA score, reflecting the degree of pathway enrichment or depletion. (B) GSEA. Plots showing the enrichment scores for the PI3K-Akt signaling pathway, TGF-beta signaling pathway, and thyroid hormone signaling pathway. The top plot displays the enrichment score across the ranked gene list, whereas the bottom plot highlights the ranked gene positions contributing to the enrichment signal. (C) Molecular interaction network. A chord diagram depicting the interactions between the three major signaling pathways analyzed. Each pathway is represented by a segment, with chords connecting segments to indicate shared genes and their interactions. BC, breast cancer; GSEA, gene set enrichment analysis; GSVA, gene set variation analysis; HExp, high expression; LExp, low expression; TGF-beta, transforming growth factor beta.
Figure 8
Figure 8
Nomogram and predictive analysis of survival in BC patients. (A) Nomogram. A predictive tool for estimating 3-year and 5-year survival probabilities in BC patients was developed. The nomogram incorporates multiple prognostic factors, such as age, sex, stage, tumor size (T), metastasis (M), node involvement (N), and the risk score (age: 0 means ≤65 years old, 1 means >65 years old; gender: 0 means female, and 1 means male). (B) Calibration curves. Comparison of predicted versus observed outcomes for 3-year and 5-year survival using the nomogram. (C) ROC curves. Evaluation of the performance of the nomogram for 1-, 3-, and 5-year survival prediction. The AUC is provided for each time point. (D) Decision curve analysis curves. Assessment of the clinical net benefit of utilizing the nomogram across various risk thresholds for decision-making. AUC, area under the curve; BC, breast cancer; OS, overall survival; ROC, receiver operating characteristic.
Figure 9
Figure 9
Characteristics of 13 prognostic genes in BC. (A) Differences in the expression levels of 13 prognosis-related genes between normal and BC tissues in the TCGA database. (B) The expression of 13 prognostic genes in clinical patient samples was verified by qPCR. * means P<0.01; FZD7 P=0.002; the rest P<0.001. BC, breast cancer; qPCR, quantitative polymerase chain reaction; TCGA, The Cancer Genome Atlas.

Similar articles

Cited by

References

    1. Childers CP, Childers KK, Maggard-Gibbons M, et al. National Estimates of Genetic Testing in Women With a History of Breast or Ovarian Cancer. J Clin Oncol 2017;35:3800-6. 10.1200/JCO.2017.73.6314 - DOI - PMC - PubMed
    1. Siegel RL, Giaquinto AN, Jemal A. Cancer statistics, 2024. CA Cancer J Clin 2024;74:12-49. 10.3322/caac.21820 - DOI - PubMed
    1. Thakur A, Rana N, Kumar R. Altered hormone expression induced genetic changes leads to breast cancer. Curr Opin Oncol 2024;36:115-22. 10.1097/CCO.0000000000001019 - DOI - PubMed
    1. Obeagu EI, Obeagu GU. Breast cancer: A review of risk factors and diagnosis. Medicine (Baltimore) 2024;103:e36905. 10.1097/MD.0000000000036905 - DOI - PMC - PubMed
    1. Moar K, Pant A, Saini V, et al. Potential diagnostic and prognostic biomarkers for breast cancer: A compiled review. Pathol Res Pract 2023;251:154893. 10.1016/j.prp.2023.154893 - DOI - PubMed

LinkOut - more resources