. 2025 Feb 28;14(2):761-777.
doi: 10.21037/tcr-24-1085. Epub 2025 Feb 24.

Construction and validation of a prognostic model of lncRNAs associated with RNA methylation in lung adenocarcinoma

Affiliations

Construction and validation of a prognostic model of lncRNAs associated with RNA methylation in lung adenocarcinoma

Liren Zhang et al. Transl Cancer Res. .

Abstract

Background: Lung adenocarcinoma (LUAD) is a common type of lung cancer and one of the leading causes of cancer death worldwide. Long non-coding RNAs (lncRNAs) play a crucial role in tumors. The purpose of this study was to explore the expression of lncRNAs associated with RNA methylation modification and their prognostic value in LUAD.

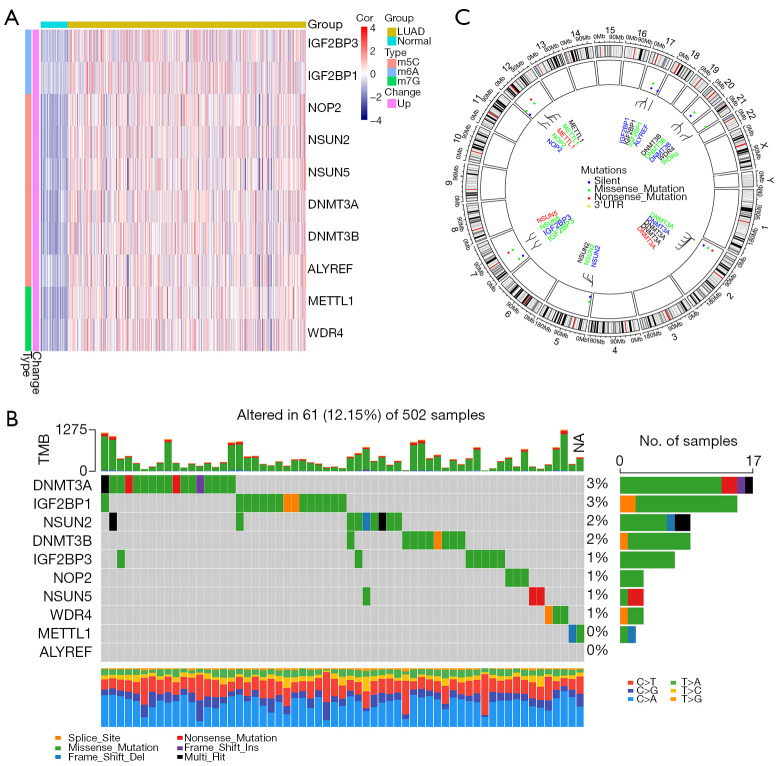
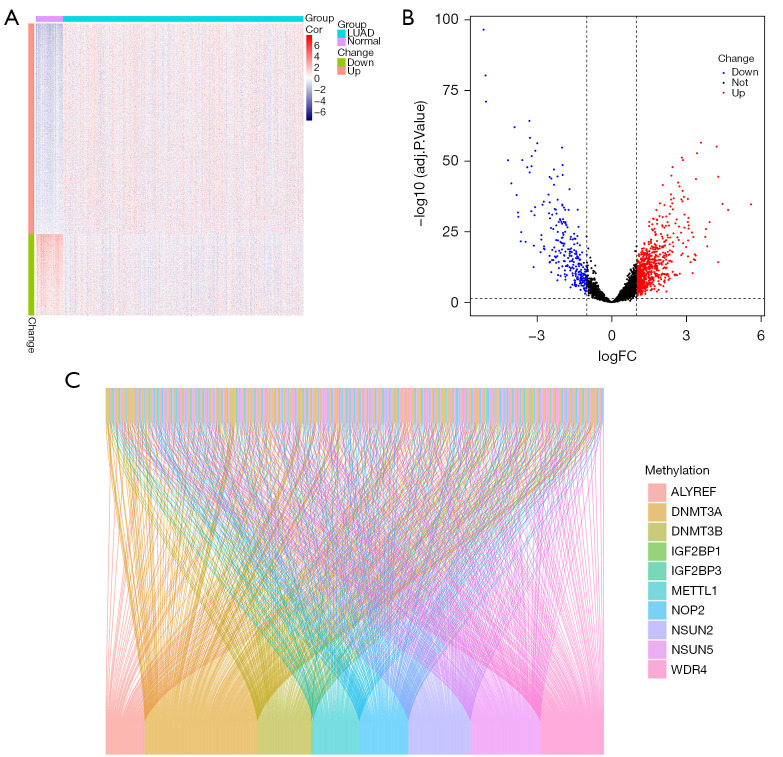
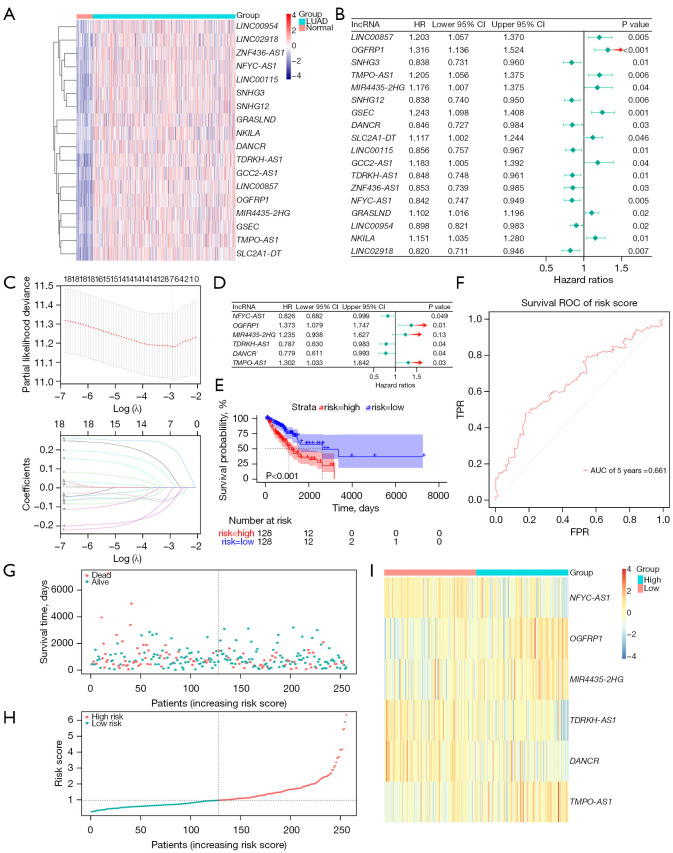
Methods: The RNA sequencing and clinical data were downloaded from The Cancer Genome Atlas dataset, and the messenger RNA and lncRNAs were annotated by Ensemble. The lncRNAs related to RNA methylation regulators (RMlncRNAs) were filtered by Pearson correlation analysis between differentially expressed lncRNAs and RNA methylation regulators. Univariate Cox regression analysis, multivariate Cox regression analysis, and least absolute shrinkage and selection operator regression analysis were used to construct a prognostic model. The receiver operating characteristic curve (ROC) was plotted to validate the predictive value of the prognostic model. Then, tumor mutational burden (TMB) and microsatellite instability were used to compare the immunotherapy response. Finally, to perform a drug sensitivity analysis, the half-maximal inhibitory concentration (IC50) of targeted drugs was calculated using pRRophetic package.

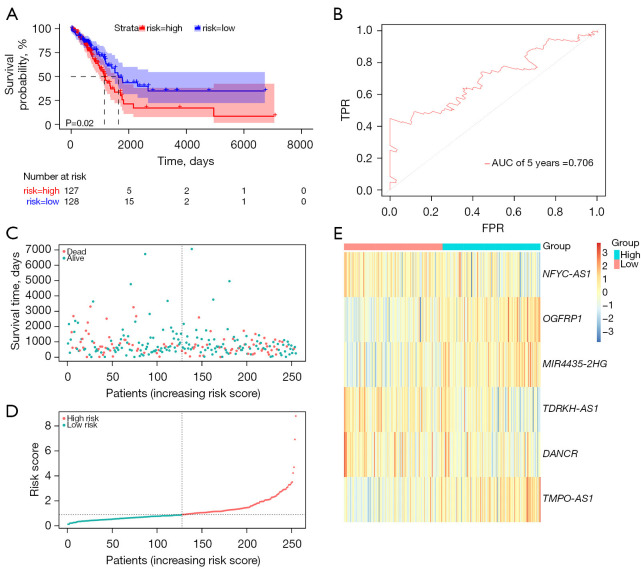
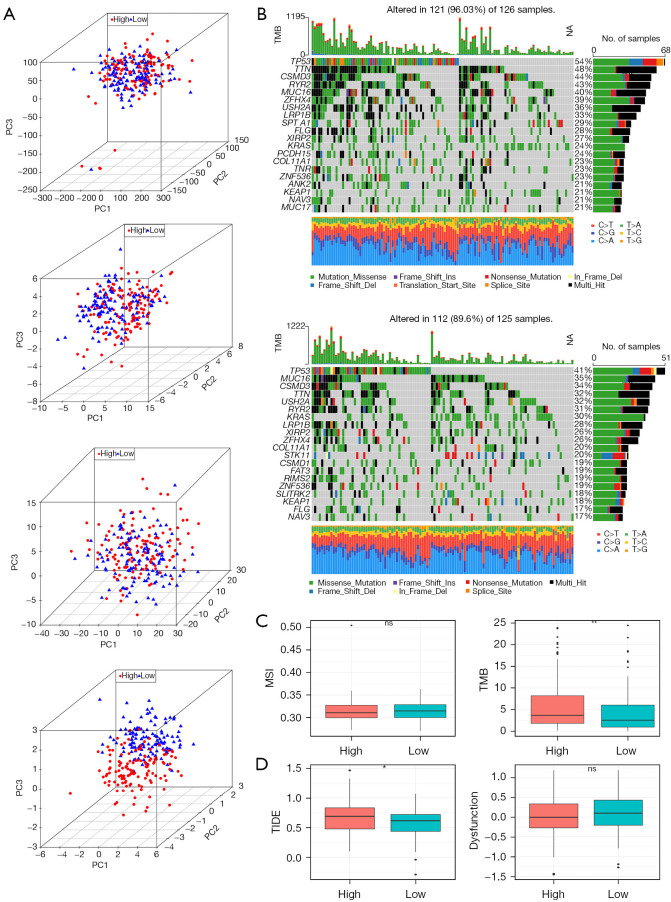
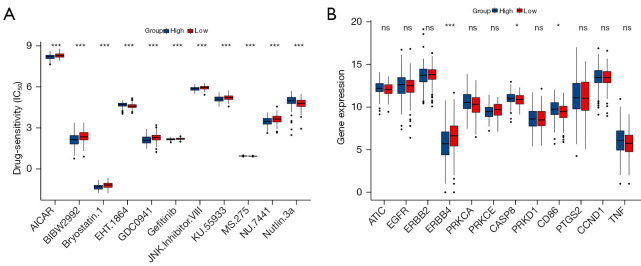
Results: In total, 18 RMlncRNAs associated with the prognosis of LUAD patients were identified. Then, six feature lncRNAs (NFYC-AS1, OGFRP1, MIR4435-2HG, TDRKH-AS1, DANCR, and TMPO-AS1) were used to construct a prognostic model. The ROC curves for training, testing, and validation sets showed that the prognosis model was effective. The subindex based on the prognostic model had a high correlation with TMB. The high-risk group might be subject to greater immune resistance according to the comparison of Tumor Immune Dysfunction and Exclusion scores. Finally, the IC50 of 11 drugs had differences between high- and low-risk group, and only three of the drug's target genes (ERBB4, CASP8, and CD86) were differentially expressed.

Conclusions: In conclusion, a prognostic model based on six feature lncRNAs (NFYC-AS1, OGFRP1, MIR4435-2HG, TDRKH-AS1, DANCR, and TMPO-AS1) was constructed by bioinformatics analysis, which might provide a new insight into the evaluation and treatment of LUAD.

Keywords: Long non-coding RNAs (lncRNAs); RNA methylation regulators; immunotherapy response; prognostic model.


Conflict of interest statement

Conflicts of Interest: All authors have completed the ICMJE uniform disclosure form (available at https://tcr.amegroups.com/article/view/10.21037/tcr-24-1085/coif). The authors have no conflicts of interest to declare.

Figures

Figure 1
Figure 1
Differential expression and mutation analysis of RNA methylation regulatory factors in LUAD group compared to normal group. (A) Heatmap of differentially expressed RNA methylation regulatory factors. (B) Waterfall plot showing the somatic mutation frequency of differentially expressed RNA methylation regulatory factors. (C) CNV of methylation regulatory genes at chromosomal locations. TMB, tumor mutation burden; NA, no significance; CNV, copy number variation; LUAD, lung adenocarcinoma; UTR, untranslated region; Cor, correlation.
Figure 2
Figure 2
Identification of DE-lncRNAs in LUAD patients. (A,B) The heatmap and volcano plot illustrate the DE-lncRNAs between the lung adenocarcinoma group and the normal group. (C) Sankey diagram to illustrate the correlation between DE-lncRNAs and differentially expressed RNA methylation regulatory factors. DE-lncRNAs, differentially expressed long non-coding RNAs; LUAD, lung adenocarcinoma; FC, fold change; Cor, correlation.
Figure 3
Figure 3
Construction and validation of the prognostic model. (A) Heatmap of the expression differences of 18 prognostic-related RMlncRNAs in the LUAD group and the normal group (blue represents low expression, red represents high expression). (B) Forest plot for univariate Cox regression analysis of RMlncRNAs. (C) LASSO regression analysis for feature gene selection. (D) Forest plot for multivariate Cox regression analysis of the six feature genes. (E) The Kaplan-Meier curve of the prognostic risk model shows that the overall survival rate in the high-risk group is lower than that in the low-risk group. (F) Determine the AUC of the prognostic risk model based on the ROC curve. (G-I) The distribution of risk scores in LUAD patients based on prognostic features, survival status, and the expression of RMlncRNAs. RMlncRNAs, lncRNAs related to RNA methylation regulators; LUAD, lung adenocarcinoma; LASSO, least absolute shrinkage and selection operator; ROC, receiver operating characteristic; lncRNA, long non-coding RNA; HR, hazard ratio; CI, confidence interval; TPR, true positive rate; FPR, false positive rate; AUC, area under the curve.
Figure 4
Figure 4
Prognostic value evaluation of the risk model in the test set. (A) The Kaplan-Meier curve shows that the overall survival rate is lower in the high-risk group than in the low-risk group. (B) Determine the AUC of the prognostic risk model based on the ROC curve. (C-E) Distribution of patient risk scores (based on prognostic features, survival status, and RMlncRNAs expression). RMlncRNAs, lncRNAs related to RNA methylation regulators; ROC, receiver operating characteristic; TPR, true positive rate; FPR, false positive rate; AUC, area under the curve.
Figure 5
Figure 5
Comprehensive analysis of clinicopathologic features in relation to risk scores and gene expression. (A) Differences in risk scores among clinical and pathological features in different groups. (B) Expression of genes in the model across different clinical feature groups. (C) The Kaplan-Meier curve of stratified analysis exploring the correlation between risk score and different pathological features. ns, no significance; *, P<0.05; ***, P<0.001.
Figure 6
Figure 6
Correlation analysis of risk scores with clinical features and construction of prognostic model. (A) Forest plot for univariate Cox analysis of risk score and clinical features. (B) Forest plot for multivariate Cox analysis of risk score and clinical features. (C) Nomogram constructed based on the risk score. (D) Calibration curves for the risk score model at 1, 3, and 5 years. HR, hazard ratio; CI, confidence interval; OS, overall survival.
Figure 7
Figure 7
Study on the main component analysis of high and low risk groups and the difference of immune-related indexes based on multi-group characteristics. (A) Principal component analysis between the high- and low-risk groups based on entire gene expression profiles, RNA methylation related genes, RMlncRNAs, and risk model based on six RMlncRNAs. (B) Waterfall map of somatic mutation frequency between high and low risk groups. (C) Differences of TMB and MSI in high and low risk groups. (D) Differences of dysfunction and TIDE scores in high and low risk groups. ns, no significance; *, P<0.05; **, P<0.01. TMB, tumor mutation burden; NA, no significance; MSI, microsatellite instability; TIDE, Tumor Immune Dysfunction and Exclusion; PC, principal component; RMlncRNAs, long non-coding RNAs related to RNA methylation regulators.
Figure 8
Figure 8
Analysis of differences in drug sensitivity and target gene expression between high and low risk groups. (A) Differences of drug sensitivity in high and low risk groups. (B) Differences of target genes in high and low risk groups. ns, no significance; *, P<0.05; ***, P<0.001. IC50, the half-maximal inhibitory concentration.

Similar articles

References

    1. Sung H, Ferlay J, Siegel RL, et al. Global Cancer Statistics 2020: GLOBOCAN Estimates of Incidence and Mortality Worldwide for 36 Cancers in 185 Countries. CA Cancer J Clin 2021;71:209-49. 10.3322/caac.21660 - DOI - PubMed
    1. Woodman C, Vundu G, George A, et al. Applications and strategies in nanodiagnosis and nanotherapy in lung cancer. Semin Cancer Biol 2021;69:349-64. 10.1016/j.semcancer.2020.02.009 - DOI - PubMed
    1. Li Y, Liu Y, Wang K, et al. STK24 Promotes Progression of LUAD and Modulates the Immune Microenvironment. Mediators Inflamm 2023;2023:8646088. 10.1155/2023/8646088 - DOI - PMC - PubMed
    1. Liu Y, Zhang H, Zhang W, et al. circ_0004140 promotes LUAD tumor progression and immune resistance through circ_0004140/miR-1184/CCL22 axis. Cell Death Discov 2022;8:181. 10.1038/s41420-022-00983-w - DOI - PMC - PubMed
    1. Dantoing E, Piton N, Salaün M, et al. Anti-PD1/PD-L1 Immunotherapy for Non-Small Cell Lung Cancer with Actionable Oncogenic Driver Mutations. Int J Mol Sci 2021;22:6288. 10.3390/ijms22126288 - DOI - PMC - PubMed

LinkOut - more resources