. 2025 Mar;62(3):e70036.
doi: 10.1111/psyp.70036.

Uncovering Distinct Drivers of Covert Attention in Complex Environments With Pupillometry

Affiliations

Uncovering Distinct Drivers of Covert Attention in Complex Environments With Pupillometry

Yuqing Cai et al. Psychophysiology. 2025 Mar.

Abstract

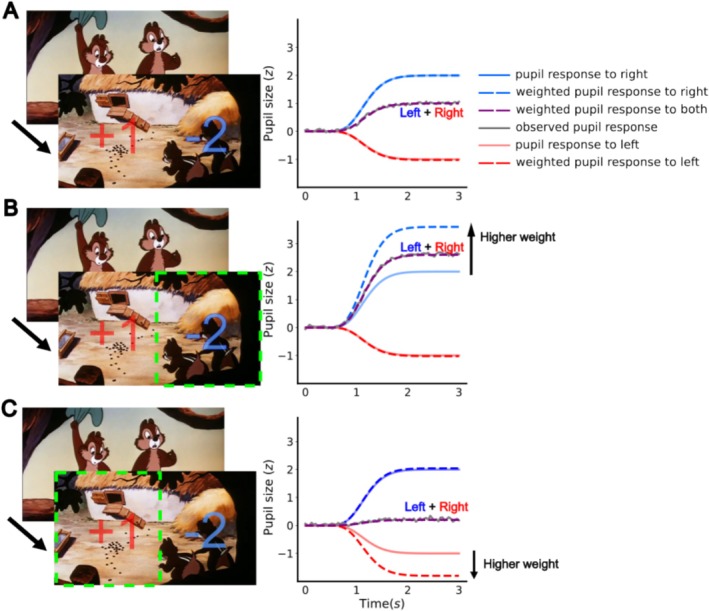
Spatial visual attention prioritizes specific locations while disregarding others. The location of spatial attention can be deployed without overt movements (covertly). Spatial dynamics of covert attention are exceptionally difficult to measure due to the hidden nature of covert attention. One way to implicitly index covert attention is via the pupillary light response (PLR), as the strength of PLR is modulated by where attention is allocated. However, this method has so far necessitated simplistic stimuli and targeted only one driver of covert attention per experiment. Here we report a novel pupillometric method that allows tracking multiple effects on covert attention with highly complex stimuli. Participants watched movie clips while either passively viewing or top-down shifting covert attention to targets on the left, right, or both sides of the visual field. Using a recent toolbox (Open-DPSM), we evaluated whether luminance changes in regions presumably receiving more attention contribute more strongly to the pupillary responses-and thereby reveal covert attention. Three established effects of covert attention on pupil responses were found: (1) a bottom-up effect suggesting more attention drawn to more dynamic regions, (2) a top-down effect suggesting more attention towards the instructed direction, and (3) an overall tendency to attend to the left side (i.e. pseudoneglect). Beyond the successful validation of our method, these drivers of covert attention did not modulate each other's effects, indicating independent contributions of bottom-up, top-down, and pseudoneglect to covert attention in stimuli as dynamic as the present. We further explain how to use Open-DPSM to track covert attention in a brief tutorial.

Keywords: complex environment; covert attention; pupillometry.


Conflict of interest statement

The experiment was not preregistered.

The authors declare no conflicts of interest.

Figures

FIGURE 1
FIGURE 1
Experimental design. (A) Screenshot of a movie with gratings (in the red boxes) and a fixation cross. Overlaid green dashed lines with arrows denote the motion trajectories for the moving gratings; (B) the visual field was mapped into regions with five eccentricities (marked with black lines). In this example, the map center is marginally shifted towards the upper‐right quadrant of the movie, illustrating the gaze‐contingent modeling procedure.
FIGURE 2
FIGURE 2
Interpretation of regional weights. A simplified illustration of how regional weights (reflecting the degree of attention) were obtained when modeling pupil size changes for three different attention shifts. (A) Attention equally allocated to left and right, (B) attended left, and (C) attended right. The left column displays the luminance changes between two consecutive movie frames for the two regions, with an increment of 1 in the left region and a decrement of 2 in the right region. Dashed green boxes indicate the attended regions. In the right column, solid blue and red lines depict the raw pupil responses to luminance changes in each region, regardless of attention (i.e. regional weights). Dashed blue and red lines represent the weighted pupil responses where attention increases the weights assigned to the luminance change in either the left or right image region. The overall pupil response (dashed purple line) combines the weighted responses from both regions. In Open‐DPSM, data inputs consist of observed pupil size changes (gray lines) and luminance changes, whereas regional weights are unknown. The model determines the best combination of regional weights such that the predicted pupil response (dashed purple lines) can be aligned optimally with the observed pupil response.
FIGURE 3
FIGURE 3
Bottom‐up effects on regional weights as an index of covert attention. (A) higher weight is given to pupil responses on the side with a higher amplitude of luminance changes. (B) Higher weight is given on the side with a higher number of luminance changes. Both relationships are consistent with what we expected from bottom‐up effects on covert attention. Each dot is a participant; shaded bars represent 95% confidence intervals.
FIGURE 4
FIGURE 4
Top‐down covert attention shift. (A) Hit rates of the attended sides in “left” and “right” conditions, with hit rates of the respective sides in “both” condition removed as baseline. Each dot is one participant. (B) Stimulus‐locked pupil dilation averaged for all trials pooled across all participants. Shaded error bands denote the standard error across all trials. Horizontal lines indicate paired t‐test p < 0.05: blue line: “hit” versus “miss”; red line: “miss” versus “correct rejection”; dashed gray line: stop onset; dashed blue line: average response time (0.95 s); gray line: period used for baseline correction; ***p < 0.001.
FIGURE 5
FIGURE 5
Effects of top‐down shifts and pseudoneglect on covert attention. (A) Difference in regional weights between to‐be‐attended and unattended sides in the “left” and “right” conditions. **p < 0.01; (B) differences in regional weights between right and left sides as an index for pseudoneglect. Each dot is one participant. ***p < 0.001.
FIGURE 6
FIGURE 6
Control analysis on gaze biases. (A) Averaged horizontal gaze positions per participant across conditions. Dashed black line denotes the horizontal midpoint of the movie (0°). Larger value means a more rightward gaze shift; one‐sample t‐test against midpoint: *p < 0.05, ***p < 0.001; (B) differences in regional weights between the sides with more gaze and with less gaze.

Similar articles

References

    1. Aktar, E. , Nimphy C. A., Kret M. E., Pérez‐Edgar K., Bögels S. M., and Raijmakers M. E. J.. 2021. “Pupil Responses to Dynamic Negative Facial Expressions of Emotion in Infants and Parents.” Developmental Psychobiology 63, no. 7: e22190. 10.1002/dev.22190. - DOI - PMC - PubMed
    1. Barbot, A. , Landy M. S., and Carrasco M.. 2011. “Exogenous Attention Enhances 2nd‐Order Contrast Sensitivity.” Vision Research 51, no. 9: 1086–1098. - PMC - PubMed
    1. Barbot, A. , Landy M. S., and Carrasco M.. 2012. “Differential Effects of Exogenous and Endogenous Attention on Second‐Order Texture Contrast Sensitivity.” Journal of Vision 12, no. 8: 6. 10.1167/12/8/6. - DOI - PMC - PubMed
    1. Barbur, J. L. , Harlow A. J., and Sahraie A.. 1992. “Pupillary Responses to Stimulus Structure, Colour and Movement.” Ophthalmic and Physiological Optics 12, no. 2: 137–141. 10.1111/j.1475-1313.1992.tb00276.x. - DOI - PubMed
    1. Bartolomeo, P. , and Chokron S.. 2002. “Orienting of Attention in Left Unilateral Neglect.” Neuroscience and Biobehavioral Reviews 26, no. 2: 217–234. 10.1016/s0149-7634(01)00065-3. - DOI - PubMed

LinkOut - more resources