

Identifying liver cirrhosis in patients with chronic hepatitis B: an interpretable machine learning algorithm based on LSM
- PMID: 40104981
- PMCID: PMC11924261
- DOI: 10.1080/07853890.2025.2477294
Identifying liver cirrhosis in patients with chronic hepatitis B: an interpretable machine learning algorithm based on LSM
Abstract
Background: Chronic hepatitis B (CHB) is a common cause of liver cirrhosis (LC), a condition associated with an unfavourable prognosis. Therefore, timely diagnosis of LC in CHB patients is crucial.
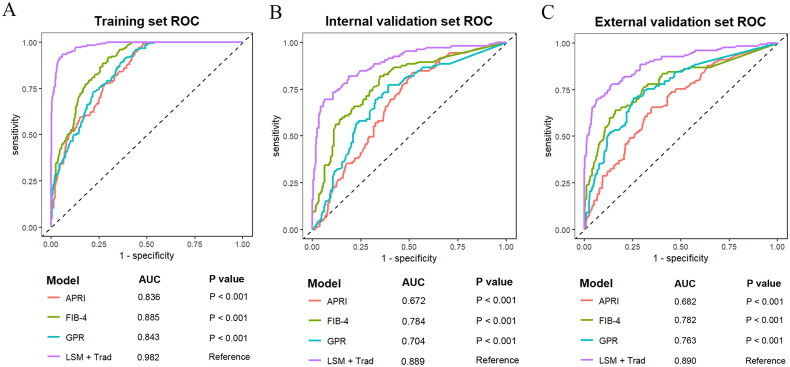
Objective: This study aimed to enhance the diagnostic accuracy of LC in CHB patients by integrating liver stiffness measurement (LSM) with traditional indicators.
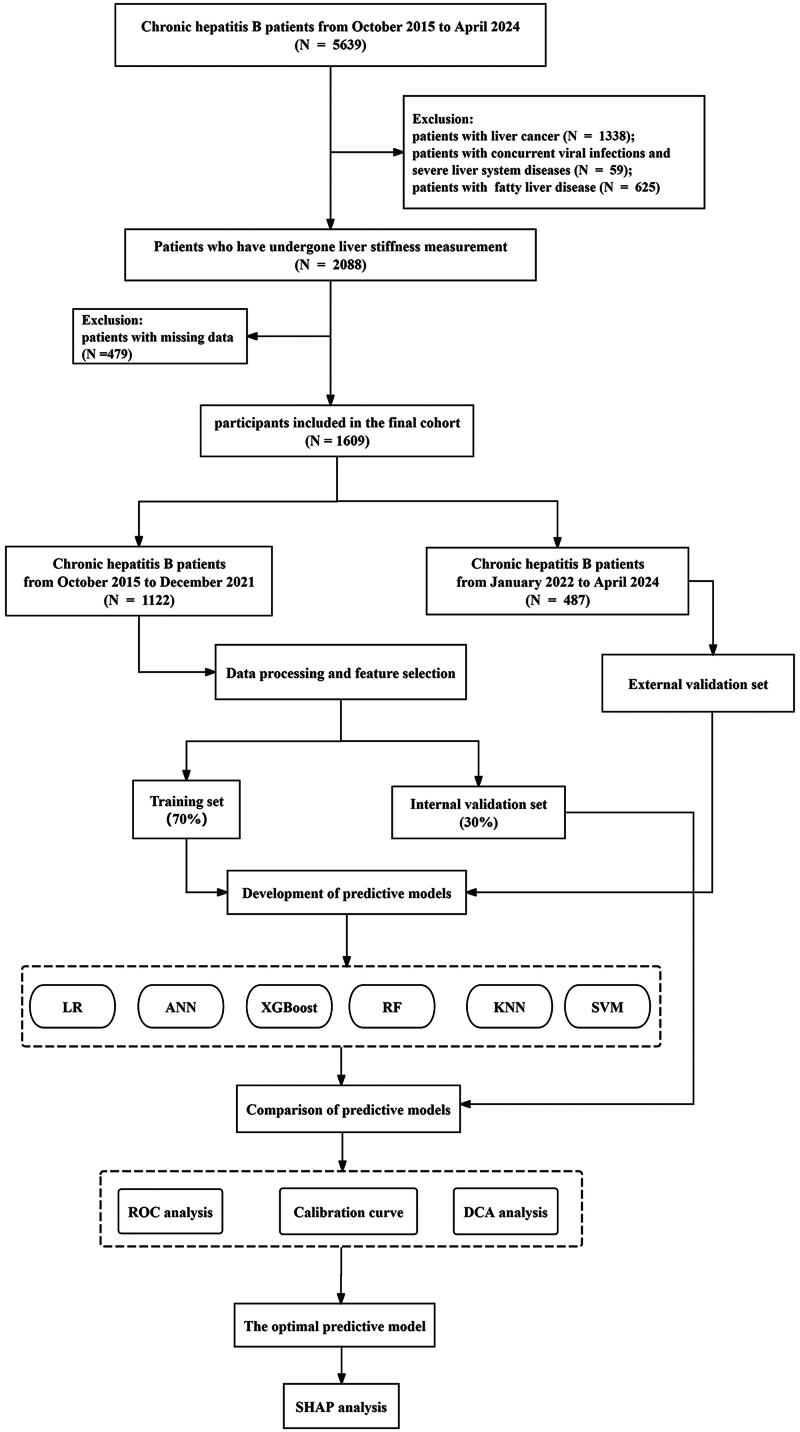
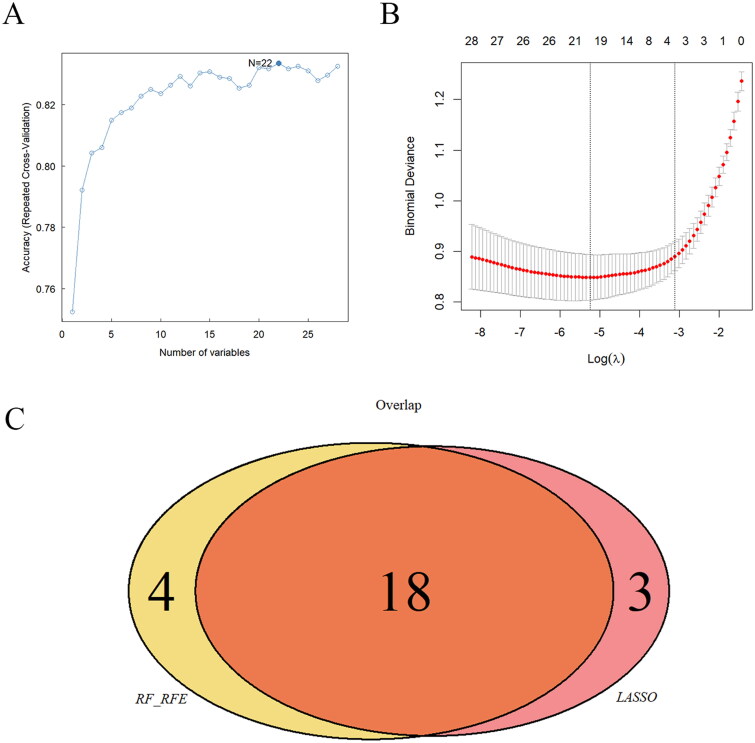
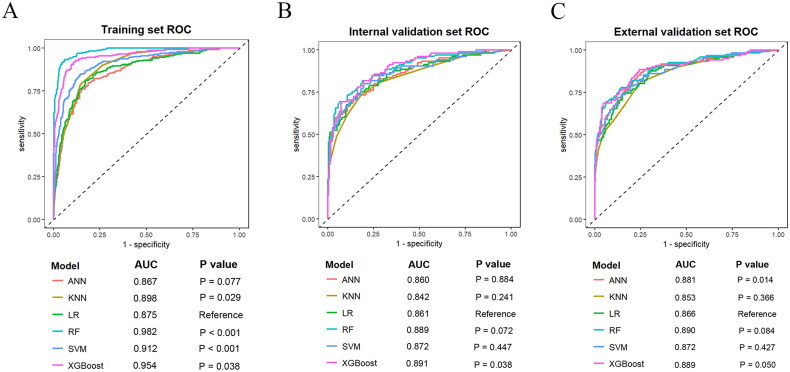
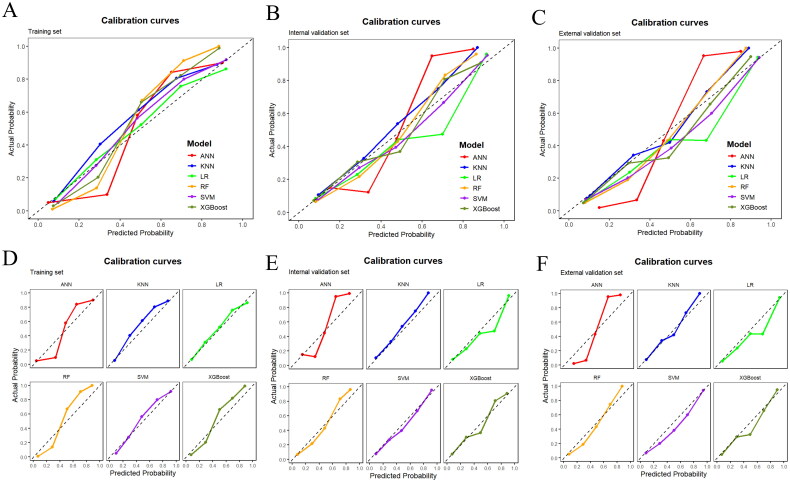
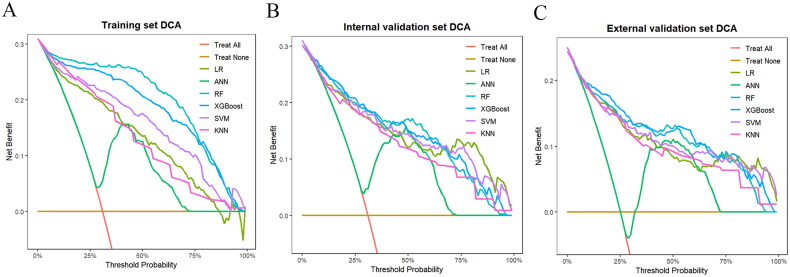
Methods: The study participants were randomly divided into training and internal validation sets. Employing the least absolute shrinkage and selection operator (LASSO) and random forest-recursive feature elimination (RF-RFE) for feature selection, we developed both traditional logistic regression and five machine learning models (k-nearest neighbors, random forest (RF), artificial neural network, support vector machine and eXtreme Gradient Boosting). Performance evaluation included receiver operating characteristic curves, calibration curves and decision curve analysis. Shapley additive explanations (SHAP) was employed to improve the interpretability of the optimal model.
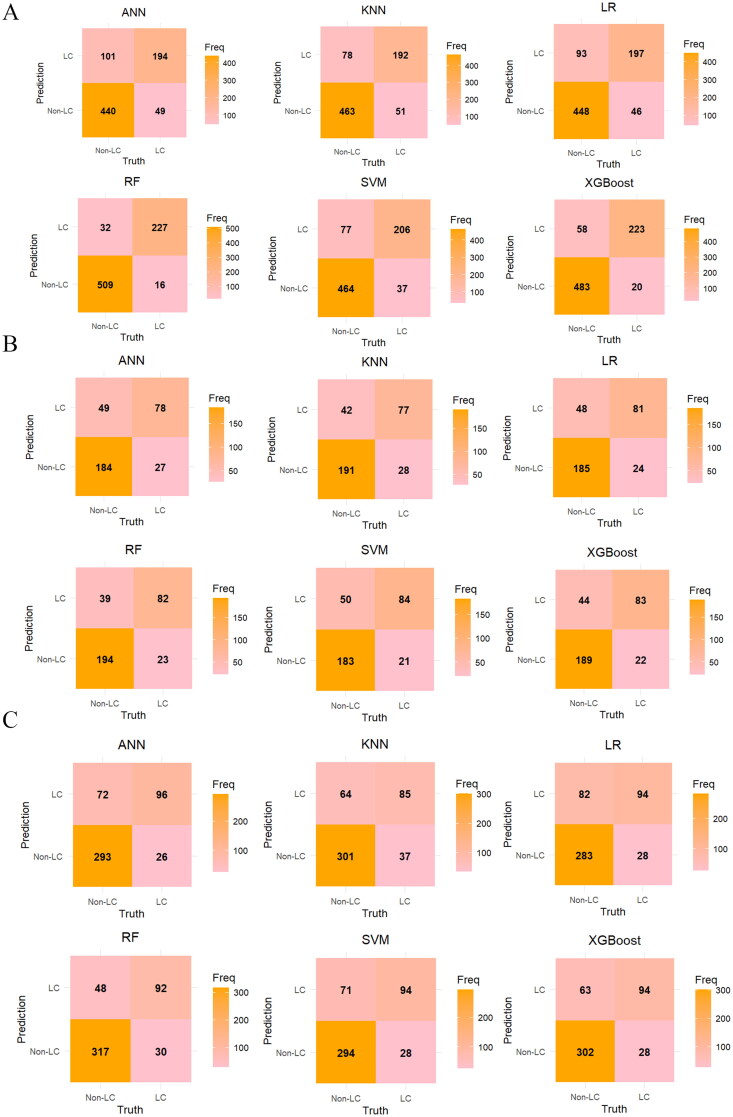
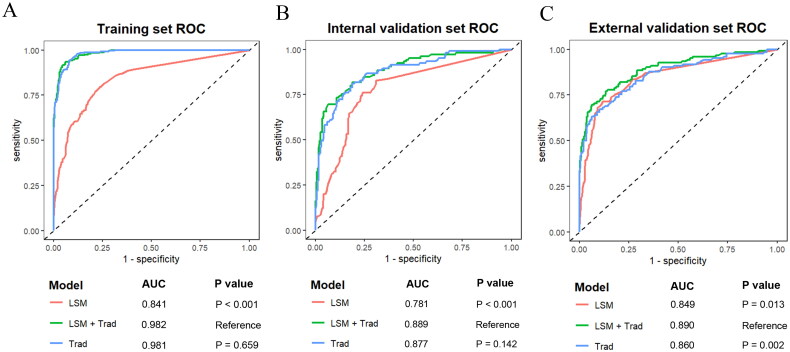
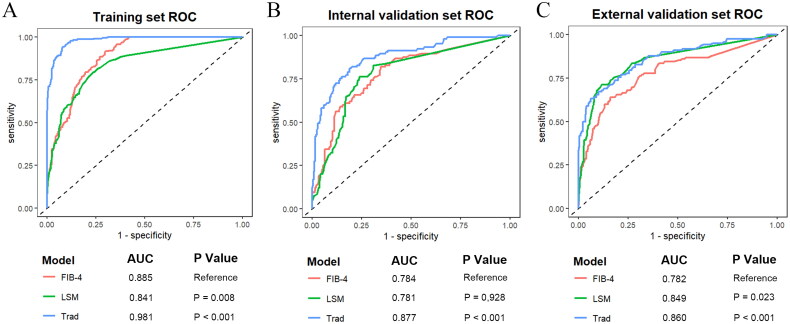
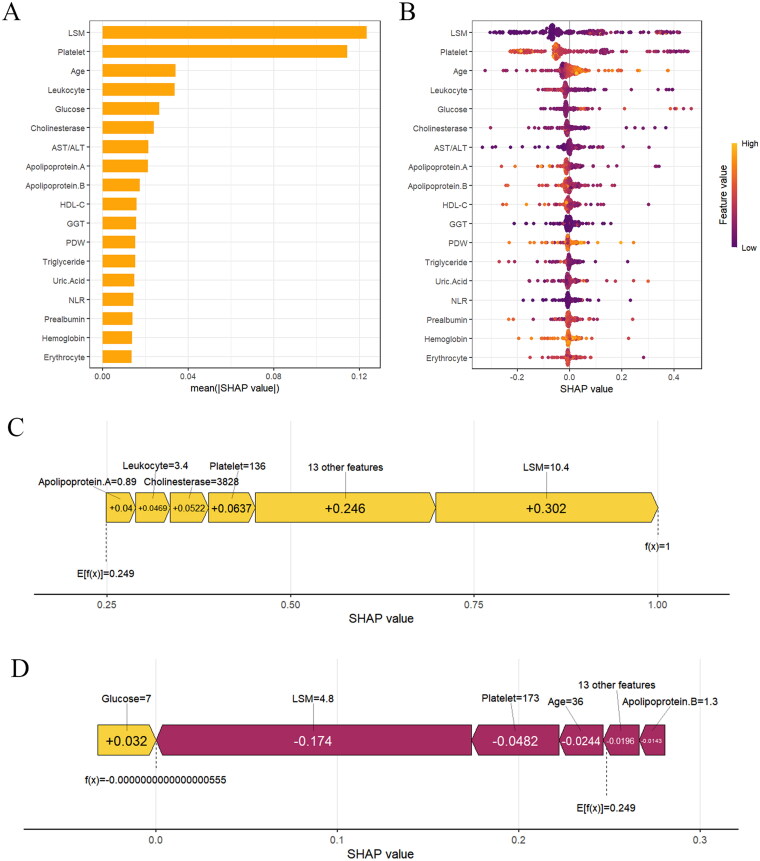
Results: We retrospectively included 1609 patients with CHB, among whom 470 were diagnosed with cirrhosis. Cirrhosis was diagnosed based on histological confirmation or clinical assessment, supported by characteristic findings on abdominal ultrasound and corroborative evidence such as thrombocytopenia, varices or imaging from CT/MRI. In the internal validation, the RF model achieved an accuracy above 0.80 and an AUC above 0.80, with outstanding calibration ability and clinical net benefit. Additionally, the model exhibited excellent predictive performance in an independent external validation set. The SHAP analysis indicated that LSM contributed the most to the model. The model still showed strong discriminative power when using only LSM or traditional indicators alone.
Conclusions: Machine learning models, especially the RF model, can effectively identify LC in CHB patients. Integrating LSM with traditional indicators can enhance diagnostic performance.
Keywords: Chronic hepatitis B; diagnostic model; liver cirrhosis; liver stiffness measurement; machine learning.
Plain language summary
Liver cirrhosis (LC) is a common complication of chronic hepatitis B (CHB).The random forest (RF) model showed the best overall performance to identify LC in CHB patients in our study, which could assist in the clinical decision-making procedure.Integrating LSM with traditional indicators can enhance the diagnostic performance of LC in CHB patients. In the absence of LSM, other traditional indicators can also diagnose LC effectively.
Conflict of interest statement
No potential conflict of interest was reported by the author(s).
Figures
Similar articles
-
Application of Interpretable Machine Learning Models to Predict the Risk Factors of HBV-Related Liver Cirrhosis in CHB Patients Based on Routine Clinical Data: A Retrospective Cohort Study.J Med Virol. 2025 Mar;97(3):e70302. doi: 10.1002/jmv.70302. J Med Virol. 2025. PMID: 40105097
-
Development and validation of an interpretable machine learning model for predicting the risk of hepatocellular carcinoma in patients with chronic hepatitis B: a case-control study.BMC Gastroenterol. 2025 Mar 11;25(1):157. doi: 10.1186/s12876-025-03697-2. BMC Gastroenterol. 2025. PMID: 40069597 Free PMC article.
-
How can we enhance the performance of liver stiffness measurement using FibroScan in diagnosing liver cirrhosis in patients with chronic hepatitis B?J Clin Gastroenterol. 2010 Jan;44(1):66-71. doi: 10.1097/MCG.0b013e3181a95c7f. J Clin Gastroenterol. 2010. PMID: 19609218
-
Predicting central lymph node metastasis in papillary thyroid microcarcinoma: a breakthrough with interpretable machine learning.Front Endocrinol (Lausanne). 2025 May 12;16:1537386. doi: 10.3389/fendo.2025.1537386. eCollection 2025. Front Endocrinol (Lausanne). 2025. PMID: 40421246 Free PMC article.
-
Precision Strike Strategy for Liver Diseases Trilogy with Xiao-Chai-Hu Decoction: A Meta-Analysis with Machine Learning.Phytomedicine. 2025 Jul;142:156796. doi: 10.1016/j.phymed.2025.156796. Epub 2025 Apr 23. Phytomedicine. 2025. PMID: 40347886
Cited by
-
Supervised Machine-Based Learning and Computational Analysis to Reveal Unique Molecular Signatures Associated with Wound Healing and Fibrotic Outcomes to Lens Injury.Int J Mol Sci. 2025 Aug 1;26(15):7422. doi: 10.3390/ijms26157422. Int J Mol Sci. 2025. PMID: 40806551 Free PMC article.
References
MeSH terms
LinkOut - more resources
Full Text Sources
Medical