

Modelling of a double-scattering proton therapy nozzle using the FLUKA Monte Carlo code and analysis of linear energy transfer in patients treated for prostate cancer
- PMID: 40105033
- PMCID: PMC12148760
- DOI: 10.1002/acm2.70032
Modelling of a double-scattering proton therapy nozzle using the FLUKA Monte Carlo code and analysis of linear energy transfer in patients treated for prostate cancer
Abstract
Background: The dose-averaged linear energy transfer (LETD) in proton therapy (PT) has in pre-clinical studies been linked to the relative biological effectiveness (RBE) of protons. Until recently, the most common PT delivery method in prostate cancer has been double-scattered PT, with LETD only available through dedicated Monte Carlo (MC) simulations. However, as most studies of the relationship between LETD and RBE in double scattered PT have been focused on the head and neck region, existing MC implementations have not been capable of calculating LETD for the longer field ranges used, for example, in the pelvic region.
Purpose: The initial aim of this study was to implement a MC code allowing for LETD calculations in double-scattered PT of prostate cancer. Additionally, we explored LETD profiles and LETD as a function of field configuration, by performing MC calculations for a large prostate cancer cohort treated with double-scattered PT.
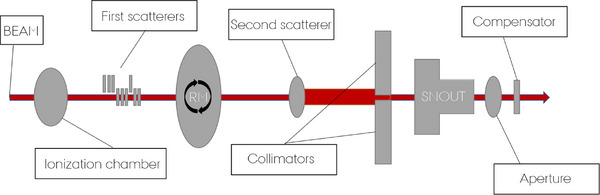
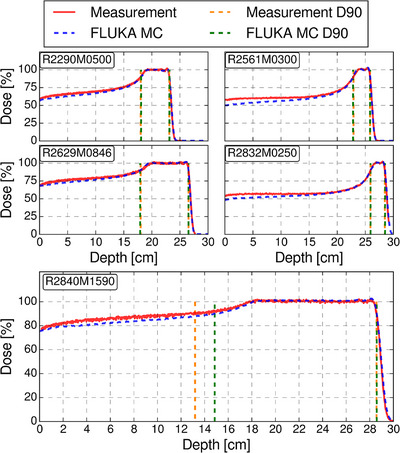
Methods: The components of a passive scattered clinical treatment nozzle used for delivery of extended field ranges, with two associated modulation wheels, were implemented into an existing FLUKA MC framework for LETD calculations. The code was validated to spread out Bragg peak (SOBP) measurements conducted using the treatment nozzle with 11 different range and modulation width configurations. After validation, LETD distributions were calculated on the planning computed tomographies of 582 prostate cancer patients treated with two-field double-scattered PT. All patients had symmetric field configurations with respect to the sagittal plane, with one pair of posterior oblique, lateral opposing, or anterior oblique fields. Dose and LETD volume parameters and the mean LETD ratio between the bladder and rectum were compared across the three groups.
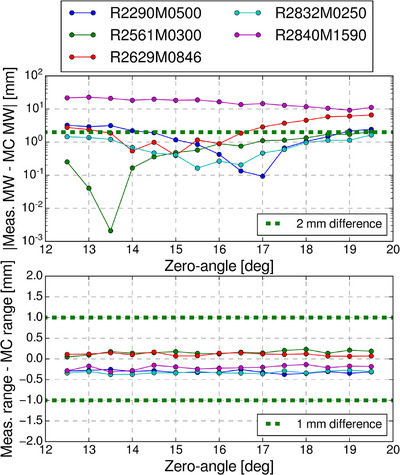
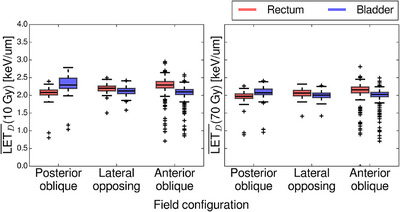
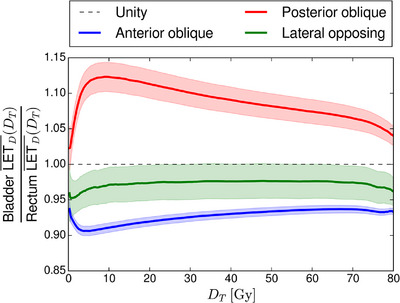
Results: The range differences were below 1 mm for all SOBP scenarios used for calibration. For 9 of 11 SOBP scenarios, the modulation width differences were below 2 mm. For the patient simulations, the mean gamma pass rates (3 mm/3%) were at least 98% in the PTV, bladder, and rectum. Comparing anterior to posterior field configurations, the mean LETD in the bladder increased within both the 10 and 70 Gy iso-dose regions, and conversely, the mean LETD decreased for the rectum. There was a marked difference in the mean bladder-to-rectum LETD ratios between anterior oblique, lateral opposing and posterior oblique field configurations.
Conclusion: A MC code allowing for accurate calculations of dose and LETD in double-scattered PT of prostate cancer was implemented and validated. The LETD distributions in the rectum and bladder showed a systematic dependence on the field configuration.
Keywords: FLUKA; Monte Carlo; linear energy transfer; prostate cancer; proton therapy.
© 2025 The Author(s). Journal of Applied Clinical Medical Physics published by Wiley Periodicals, LLC on behalf of American Association of Physicists in Medicine.
Conflict of interest statement
The authors declare no conflicts of interest.
Figures

Similar articles
-
Biological dose and complication probabilities for the rectum and bladder based on linear energy transfer distributions in spot scanning proton therapy of prostate cancer.Acta Oncol. 2017 Nov;56(11):1413-1419. doi: 10.1080/0284186X.2017.1373198. Epub 2017 Oct 17. Acta Oncol. 2017. PMID: 29037095
-
Physical and biological impacts of collimator-scattered protons in spot-scanning proton therapy.J Appl Clin Med Phys. 2019 Jul;20(7):48-57. doi: 10.1002/acm2.12653. Epub 2019 Jun 24. J Appl Clin Med Phys. 2019. PMID: 31237090 Free PMC article.
-
Can We Advance Proton Therapy for Prostate? Considering Alternative Beam Angles and Relative Biological Effectiveness Variations When Comparing Against Intensity Modulated Radiation Therapy.Int J Radiat Oncol Biol Phys. 2016 May 1;95(1):454-464. doi: 10.1016/j.ijrobp.2016.01.018. Epub 2016 Jan 19. Int J Radiat Oncol Biol Phys. 2016. PMID: 27084660
-
Linear energy transfer distributions in the brainstem depending on tumour location in intensity-modulated proton therapy of paediatric cancer.Acta Oncol. 2017 Jun;56(6):763-768. doi: 10.1080/0284186X.2017.1314007. Epub 2017 Apr 19. Acta Oncol. 2017. PMID: 28423966
-
The Use of Particle Therapy in Prostate Cancer.Semin Radiat Oncol. 2025 Jul;35(3):353-361. doi: 10.1016/j.semradonc.2025.03.001. Semin Radiat Oncol. 2025. PMID: 40516970 Review.
References
-
- Protons vs. Photons for High‐risk Prostate Cancer. Accessed April 4, 2024. https://clinicaltrials.gov/study/NCT05350475
-
- Docetaxel, Androgen Deprivation and Proton Therapy for High Risk Prostate Cancer (PR05). Accessed April 4, 2024. https://clinicaltrials.gov/study/NCT01040624
-
- Radiation Therapy (Hypofractionated Proton Beam Therapy or IMRT) for the Treatment of Recurrent, Oligometastatic Prostate Cancer Following Primary Localized Treatment. Accessed April 4, 2024. https://clinicaltrials.gov/study/NCT04190446
-
- Dose‐Escalated Proton Radiation Therapy for High‐Risk Prostate Cancer (PR11). Accessed April 4, 2024. https://clinicaltrials.gov/study/NCT03624660
-
- Proton Radiation Therapy for the Treatment of Patients With High Risk Prostate Cancer. Accessed April 4, 2024. https://clinicaltrials.gov/study/NCT04725903
MeSH terms
LinkOut - more resources
Full Text Sources
Medical
