. 2025 Jul;292(13):3477-3493.
doi: 10.1111/febs.70068. Epub 2025 Mar 19.

The N6-methyladenosine reader IGF2BP3 promotes bladder cancer progression through enhancing HSP90AB1 expression

Affiliations

The N6-methyladenosine reader IGF2BP3 promotes bladder cancer progression through enhancing HSP90AB1 expression

Xiaoqing Chen et al. FEBS J. 2025 Jul.

Abstract

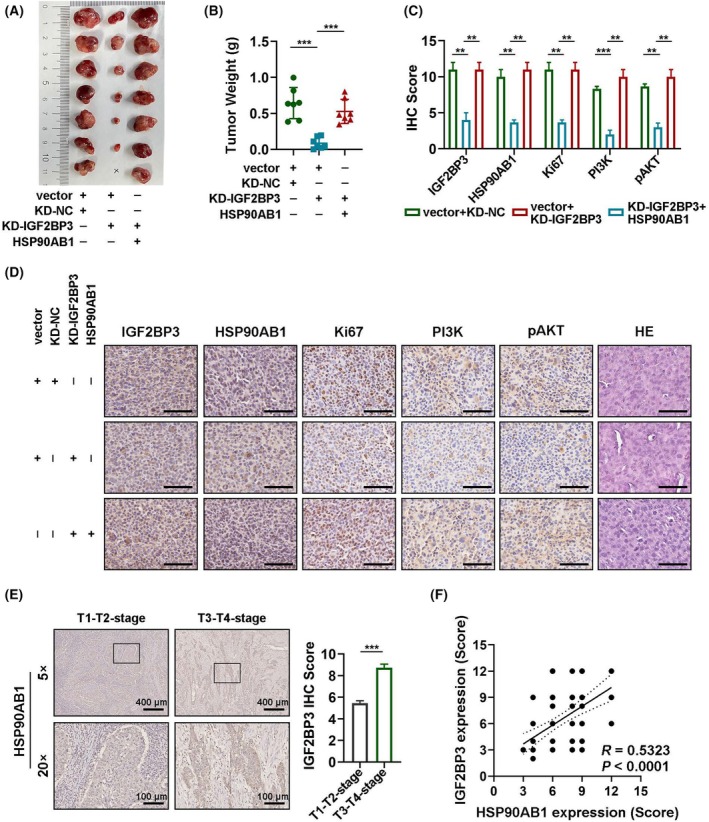
N6-methyladenosine (m6A) is the most abundant RNA modification in mammalian cells, and has emerged as an important player in tumour development through post-transcriptional gene regulation. In this study, we found that the m6A reader protein IGF2BP3 was the most upregulated m6A modifier in bladder cancer through the proteomic analysis of 17 pairs of human bladder cancer tissues and adjacent normal bladder tissues, for which the expression was also positively correlated with higher tumour stage and poorer prognosis. In vitro and in vivo assays demonstrated the powerful oncogenic function of IGF2BP3 in bladder cancer. Further combined analyses of RNA-sequencing, m6A-sequencing, and RIP (RNA Binding Protein Immunoprecipitation)-sequencing, as well as site-directed mutagenesis assays and RIP-qPCR identified m6A-tagged HSP90AB1 mRNA as a direct target of IGF2BP3. Mechanistically, through in vitro and in vivo assays, as well as clinical sample analysis, we demonstrated that IGF2BP3 modulated the expression of HSP90AB1 in an m6A modification-dependent manner, thus activating the PI3K/AKT-signaling pathway, and promoting the development of bladder cancer. Collectively, our study highlights the critical role of the IGF2BP3-HSP90AB1-signaling axis in bladder cancer progression, which may serve as a promising therapeutic approach for bladder cancer.

Keywords: HSP90AB1; IGF2BP3; PI3K/AKT signaling; bladder cancer; m6A.


Conflict of interest statement

The authors declare no conflict of interest.

Figures

Fig. 1
Fig. 1
IGF2BP3 was overexpressed in bladder cancer and associated with poor prognosis. (A) The heatmap of upregulated (n = 155) and downregulated (n = 54) proteins in proteomics conducted with 17 pairs of human bladder cancer tissues and adjacent normal bladder tissues, fold change ≥ 5, P < 0.05. (B) The LFQ (Label Free Quantification) intensity of IGF2BP3 in proteomics (n = 17). (C) Western blot assay of the IGF2BP3 protein level in bladder cancer tissues and adjacent normal tissues (n = 4), the data is shown as mean ± SD. (D) In representative images of IHC and HE‐staining of IGF2BP3 expression in normal (n = 17), low‐stage (T1‐T2 stage, n = 45) and high‐stage (T3‐T4 stage, n = 30) bladder cancer tissues, the data is shown as mean ± SEM. The smaller inset black boxes in the upper images represent the source location of the enlarged image below. (E) Kaplan–Meier survival analysis of IGF2BP3 expression in bladder cancer patients is based on the TCGA database. Data was analysed using Student's t tests. **P < 0.01; ***P < 0.001.
Fig. 2
Fig. 2
Knockdown of IGF2BP3 decreased bladder cancer cells proliferation and migration in vitro and in vivo. (A, B) Western blot and RT‐qPCR assays to evaluate IGF2BP3 proteins and mRNA expression levels in T24 and UMUC3 cells transfected with si‐IGF2BP3–1, si‐IGF2BP3–2, si‐IGF2BP3–3 and si‐NC, normalised to β‐Actin. (C) The proliferative ability of T24 and UMUC3 cells transfected with si‐IGF2BP3–1, si‐IGF2BP3–3 or si‐NC was analysed using MTT assays. (D) Representative image (Left) and quantification (Right) of transwell assays in bladder cancer cells transfected with si‐IGF2BP3–1, si‐IGF2BP3–3 or si‐NC. Scale bar = 200 μm. (E) Representative image (Left) and quantification (Right) of wound‐healing assays in bladder cancer cells transfected with si‐IGF2BP3–1, si‐IGF2BP3–3 or si‐NC. Scale bar = 500 μm. (F) Representative image (Left) and weight (Right) of tumour growth in xenografted nude mice (n = 7). Ruler/scale bar = 1 cm. (G) Representative image of HE and IHC‐staining of IGF2BP3 and Ki67 in tumours of KD‐NC and KD‐IGF2BP3 group. KD: Knockdown, Scale bar = 50 μm. (H) Representative image (Left) and weight (Right) of tumours in vector and IGF2BP3 group (n = 7). Ruler/scale bar = 1 cm. (I) Representative images of HE and IHC‐staining of IGF2BP3 and Ki67 in tumours of vector and IGF2BP3 group. Scale bar = 50 μm. Data was analysed using Student's t tests. All data are shown as the means ± SD. All cell function experiments were repeated three times independently. **P < 0.01; ***P < 0.001.
Fig. 3
Fig. 3
Identification of IGF2BP3 targets in bladder cancer. (A) The heatmap of differentially expressed mRNA between si‐NC (n = 3) and si‐IGF2BP3 (n = 3) in T24 cells by RNA‐seq. (B) KEGG analysis was performed to show the top 20 enriched pathways closely correlated with differentially expressed genes. The colour intensities represent the P value. The circle size represent the number of differentially expressed genes. (C) MEME motif analysis of m6A‐seq showed the top consensus m6A motif in T24 cells. Four different nucleobases were shown with four different colours, the font size of each nucleobase represents the conservatism degree of this nucleobase, the bigger size means more conservative. The m6A‐seq was performed as a qualitative test to pre‐screen m6A modified genes in wild‐type T24 cells, so we just performed with one sample here. (D, E) Metagene profiles of m6A modifications enrichment and distribution across mRNA transcriptome by m6A‐seq. (F) The consensus sequences motif of IGF2BP3‐binding sites was identified by RIP‐seq with the IGF2BP3 antibody. The RIP‐seq was performed as a qualitative test to pre‐screen IGF2BP3‐binding mRNAs in wild‐type T24 cells, so we just used one sample here. (G) The distribution of IGF2BP3‐binding peaks within different gene sites. (H) The Venn diagram showed the 25 overlapping genes predicted by RNA‐seq, m6A‐seq, and RIP‐seq.
Fig. 4
Fig. 4
HSP90AB1 is a crucial target of IGF2BP3 in bladder cancer cells. (A, B) RT‐qPCR analysis of candidate genes in bladder cancer cells after knocking down or over‐expressing IGF2BP3, normalised to β‐Actin (n = 3). (C, F) Distribution of m6A peaks and IGF2BP3‐binding peaks across HSP90AB1, IL1B, RAC1, and SMIM13 transcripts. The red rectangles indicated the potential m6A‐modified and IGF2BP3‐binding regions in these four genes. (G) RIP‐qPCR analysis showed the enrichment of IGF2BP3 in mRNA of HSP90AB1, IL1B, RAC1, and SMIM13 (n = 3). Western blot verified the IGF2BP3 IP in IGF2BP3‐Flag‐overexpressed T24 cells by using the antibody specific to IGF2BP3 (n = 3). (H, I) Western blot assay analysed HSP90AB1, IL1B, and RAC1 protein levels in bladder cancer cells after knocking down or over‐expressing IGF2BP3 (n = 3). Data was analysed using Student's t tests. All data are shown as the means ± SD. *P < 0.05; **P < 0.01; ***P < 0.001.
Fig. 5
Fig. 5
IGF2BP3 mediates HSP90AB1 expression in an m6A‐dependent manner. (A) Schematic showing the structure of the wild‐type (IGF2BP3‐wt) and mutant (IGF2BP3‐mut) IGF2BP3 over‐expression plasmid. (B) RIP‐qPCR analysed the enrichment of HSP90AB1 mRNA in immunoprecipitated RNA by IGF2BP3 antibody in T24 cells over‐expression wild‐type or mutant IGF2BP3 (n = 3). (C) Western blot analysed the HSP90AB1 protein levels in wild‐type or mutant IGF2BP3 over‐expressed T24 cells and quantification of western blot assays in D (n = 3). (E) RT‐qPCR analysed HSP90AB1 mRNA levels in bladder cancer cells transfected with si‐METTL3 (n = 3). (F) RNA stability assay evaluated HSP90AB1 mRNA levels in si‐NC and si‐IGF2BP3–1 bladder cancer cells treated with actinomycin D for 12 and 24 h by RT‐qPCR (normalised to 0 h) (n = 3). Data was analysed using Student's t tests. All data are shown as the means ± SD. **P < 0.01; ***P < 0.001.
Fig. 6
Fig. 6
IGF2BP3 promotes proliferation and migration of bladder cancer cells through the HSP90AB1‐activated PI3K/AKT‐signaling pathway. (A) Western blot analysis of HSP90AB1, pPI3K, PI3K, pAKT, AKT protein levels in HSP90AB1 deficient T24 or UMUC3 cells. (B) Western blot analysis of IGF2BP3, HSP90AB1, pPI3K, PI3K, pAKT, AKT protein levels in bladder cancer cells with IGF2BP3 silenced, or overexpressing HSP90AB1 with KD‐IGF2BP3 simultaneously. (C) MTT assays measured the proliferative abilities of T24 or UMUC3 cells infected with KD‐IGF2BP3 or overexpressing HSP90AB1 with KD‐IGF2BP3. (D) Representative images (Left) and quantification (Right) of wound‐healing assays in bladder cancer cells infected with KD‐IGF2BP3 or KD‐IGF2BP3 plus HSP90AB1. KD: knockdown, scale bar = 500 μm. (E) Representative images (Left) and quantification (Right) of transwell assays in bladder cancer cells transfected with KD‐IGF2BP3 or KD‐IGF2BP3 plus HSP90AB1. Scale bar = 200 μm. Data was analysed using Student's t tests. All data are shown as the means ± SD. And all cell function experiments were repeated three times independently. **P < 0.01; ***P < 0.001.
Fig. 7
Fig. 7
IGF2BP3 promotes bladder cancer growth dependent on HSP90AB1 in vivo. (A) Representative images of tumours from xenografted nude mice of each group (n = 7). The ‘cross’ signifies that there's no tumour. Scale bar = 1 cm. (B) Quantitative analysis of tumour weight, the data is shown as mean ± SD. (C, D) Representative images and quantification of HE‐staining and IHC‐staining for IGF2BP3, pAKT, PI3K, and Ki‐67 of tumours from the implanted mice (n = 7), the data is shown as mean ± SEM. Scale bar = 50 μm. (E) Representative images (Left) and quantification (Right) of IHC‐staining for HSP90AB1 expression in low‐stage (T1‐T2 stage, n = 45) and high‐stage (T3‐T4 stage, n = 30) of bladder cancer tissue, the data is shown as mean ± SEM. The smaller inset black boxes in the upper images represent the source location of the enlarged image below. (F) Pearson's correlation analysis of the correlation between IGF2BP3 and HSP90AB1 IHC score in clinical bladder cancer tissues (n = 75). The dotted lines show the 95% confidence intervals. Data was analysed using Student's t tests. **P < 0.01; ***P < 0.001.

Similar articles

References

    1. Sung H, Ferlay J, Siegel RL, Laversanne M, Soerjomataram I, Jemal A & Bray F (2021) Global cancer statistics 2020: GLOBOCAN estimates of incidence and mortality worldwide for 36 cancers in 185 countries. CA Cancer J Clin 71, 209–249. - PubMed
    1. Gore JL & Wright JL (2019) Can we prevent bladder cancer recurrences? Eur Urol 75, 602–603. - PubMed
    1. Knowles MA & Hurst CD (2015) Molecular biology of bladder cancer: new insights into pathogenesis and clinical diversity. Nat Rev Cancer 15, 25–41. - PubMed
    1. Tran L, Xiao JF, Agarwal N, Duex JE & Theodorescu D (2021) Advances in bladder cancer biology and therapy. Nat Rev Cancer 21, 104–121. - PMC - PubMed
    1. Patel VG, Oh WK & Galsky MD (2020) Treatment of muscle‐invasive and advanced bladder cancer in 2020. CA Cancer J Clin 70, 404–423. - PubMed

MeSH terms