. 2025 Feb 27;53(5):gkaf178.
doi: 10.1093/nar/gkaf178.

DNA damage response regulator ATR licenses PINK1-mediated mitophagy

Affiliations

DNA damage response regulator ATR licenses PINK1-mediated mitophagy

Christian Marx et al. Nucleic Acids Res. .

Abstract

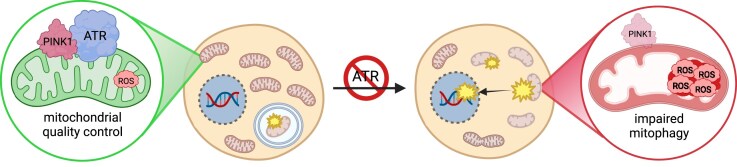
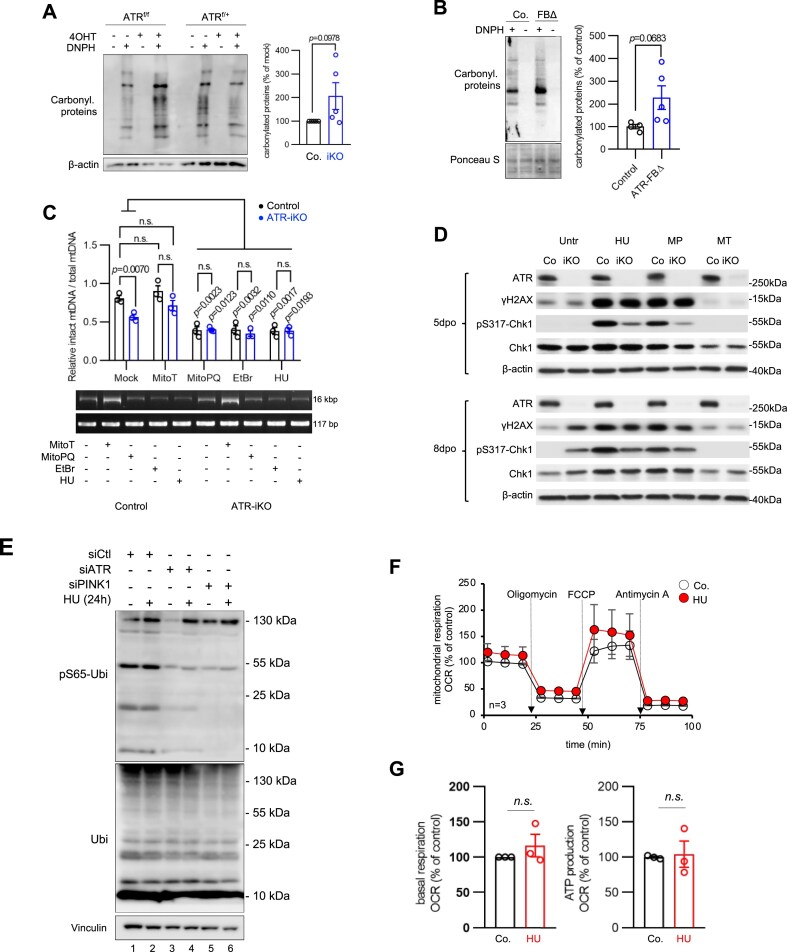
Defective DNA damage response (DDR) and mitochondrial dysfunction are a major etiology of tissue impairment and aging. Mitochondrial autophagy (mitophagy) is a mitochondrial quality control (MQC) mechanism to selectively eliminate dysfunctional mitochondria. ATR (ataxia-telangiectasia and Rad3-related) is a key DDR regulator playing a pivotal role in DNA replication stress response and genomic stability. Paradoxically, the human Seckel syndrome caused by ATR mutations exhibits premature aging and neuropathies, suggesting a role of ATR in nonreplicating tissues. Here, we report a previously unknown yet direct role of ATR at mitochondria. We find that ATR and PINK1 (PTEN-induced kinase 1) dock at the mitochondrial translocase TOM/TIM complex, where ATR interacts directly with and thereby stabilizes PINK1. ATR deletion silences mitophagy initiation thereby altering oxidative phosphorylation functionality resulting in reactive oxygen species overproduction that attack cytosolic macromolecules, in both cells and brain tissues, prior to nuclear DNA. This study discloses ATR as an integrated component of the PINK1-mediated MQC program to ensure mitochondrial fitness. Together with its DDR function, ATR safeguards mitochondrial and genomic integrity under physiological and genotoxic conditions.


Conflict of interest statement

The authors declare no conflict of interest.

Figures

Graphical Abstract
Graphical Abstract
Figure 1.
Figure 1.
ATR anchors at mitochondria and its deletion causes mitochondrial malformations. (A) Human HeLa cells were analyzed by TEM. Quantification of ATR-immunogold labeling from TEM analysis and graphical presentation of ATR’s intracellular distribution. (B) A representative TEM image of mitochondria. ATR was labeled using nano-gold particle-conjugated anti-ATR antibody. Blue arrows point gold particles within mitochondria (Mito). (C) Western blot analysis of the indicated proteins in WCEs, cytosolic (cyto), and mitochondrial (mito) cellular fractionations of human HCT116 cells. ATR knockdown experiments was conducted using RNA interference (RNAi) targeted against ATR (siATR). The crambled siRNA (siCtl) is a control. VE821 is an ATR inhibitor. Vinculin and ATP5A are controls for protein loading in the corresponding fractionation. n = 3. (D) Mitochondrial morphologies viewed by TEM in ATR-KD HeLa cells. Green arrow points swollen mitochondria with cristae defects. (E) ATR-iKO in pMEFs was induced by 4-OHT treatment (see Supplementary Fig. S2A and B). Mitochondrial morphologies are analyzed by TEM at 5 dpo. Green arrows mark mitochondria lacking “cristae” structures and red arrows point to mitochondria with a fused appearance of intact and malformed “cristae”. (F) Quantification of malformed mitochondria in ATR-iKO pMEFs. The number (n) of mitochondria counted. (G) Western blot analysis of the indicated proteins in ATR-iKO pMEFs and quantified using ImageJ, which are shown on right. Vinculin was used to control protein loading. n = 3. Error bars in all subfigures show standard error of the mean (SEM). The statistical analysis was performed using two-tailed t-tests. P-values are indicated within individual graphs. n.s.: not significant.
Figure 2.
Figure 2.
ATR associates with PINK1 at mitochondria. (A) Western blot analysis of the indicated proteins in WCEs, cytosolic, and mitochondrial cell fractionations of ATR-KD and PINK1-KD HCT116 cells. Vinculin and ATP5A were used to control protein loading in the corresponding fractionation. n = 3. (B) Western blot analysis of the indicated proteins in HCT116 cells after ATR-KD treated or not with 10 μM of the proteasome inhibitor MG-132 for 4 h. α-tubulin was used to control protein loading. n = 3. (C) Co-IPs using a PINK1 antibody in cytosolic (cyto) and mitochondrial (mito) fractionations of HCT116 cells followed by Western blotting using the indicated antibodies. Vinculin and ATP5A were used to control protein loading within the corresponding inputs. n = 3. (D) Co-IPs of PINK1 with ATR in WCEs of HCT116 cells after siRNA or siATR treatment followed by Western blotting using the indicated antibodies. VE821 is an ATR inhibitor. Vinculin was used to control protein loading in input. n = 3. (E) Immunofluorescence microscopy by anti-ATR and anti-PINK1 antibody staining of ATR co-localization with PINK1 within mitochondrial networks in HCT116 cells. The mitochondrial networks (MitoTracker staining) and the co-localization of ATR with mitochondria (arrow in mid panels) or PINK1 (arrow in right panels) are shown. M: mitochondrion; N: nucleus. n = 3.
Figure 3.
Figure 3.
ATR docks at mitochondria by direct interaction with PINK1 and TOM/TIM. (A) PLAs of ATR interaction with PINK1, TIM23, and TOM40 in U2OS cells without (shNC) or with ATR-KD (shATR). Left panel: Representative images of PLA-positive signals (red foci) after co-staining with mitochondrial marker MitoTracker. Yellow arrows indicate PLA foci in mitochondria. Right panel: Quantification of PLA-positive foci from >200 cells scored. Statistics were performed using a two-way ANOVA with a Tukey’s multiple comparisons test. n = 3. (B) Co-IPs by the FLAG antibody in FLAG-ATR and HA-TOM40 transfected HEK239T cells followed by western blot analysis of the indicated proteins. β-actin was used to control protein loading. n = 3. (C) Co-IPs by the FLAG antibody in FLAG-ATR and HA-TIM23 transfected HCT116 cells followed by western blot analysis of the indicated proteins. β-actin was used to control protein loading. n = 3. (D) HCT116 cells with targeted siRNA against ATR (siATR), PINK1 (siPINK1), HSP90α (siHSP90), TIM23 (siTIM23), and TOM7 (siTOM7) are analyzed by Western blotting for the indicated proteins in mitochondrial fractionations. ATP5A was used to control protein loading. n = 3. (E) 1D BN–PAGE analysis of ATR, TOM22, and PINK1 from the purified mitochondrial fraction of N2A cells. Under native conditions, ATR, TOM22, and PINK1 migrate at the same speed in native PAGE gel. After heat treatment, denatured samples were pulled down by an anti-ATR ab. The native and denatured samples were blotted with the indicated antibodies, which detect the respective proteins in denatured gels (lane “heat denaturing +”). n = 3.
Figure 4.
Figure 4.
ATR together with PINK1 resides at the mitochondrial membrane for mitophagy. (A) Mitophagy initiation of HCT116 cells treated with either (siCtl) or siATR (ATR-KD) was induced by 2 h treatment of 2 μM FCCP or blocked by 5 μM Mdivi-1. Western blot analysis of the indicated proteins in cytosolic and mitochondrial cell fractionations. COX IV and vinculin were used to control protein loading in the corresponding fractionation. Quantification of mitochondrial PINK1 was done using ImageJ. Error bars show SEM. The statistical analysis was performed using two-tailed t-test. P-values are indicated within individual graphs. n.s.: not significant. n = 4. (B) Western blot analysis of mitochondrial fractionation of HCT116 cells treated with 2 μM FCCP for 2 h and blotted with the indicated proteins. Gentle treatment by Accutase (acc) is to remove proteins from mitochondrial surfaces. BIM was used as the indicator of outer surface-bound mitochondrial proteins. ATP5A serves as an inner membrane marker. n = 3. (C) ATR-KD (siATR) and PINK1-KD (siPINK1) HCT116 cells were treated with FCCP for 6 h to induce mitophagy and analyzed by Western blotting using the indicated antibodies. Vinculin was used to control protein loading. n = 3. (D) Mitophagy induced by 1 μM FCCP in mCherry-EGFP-LC3B stably transfected U2OS cells after siATR KD, which were reconstituted with wild-type or mutant ATR-C that is deficient for PINK1-binding (see Supplementary Fig. S6H). Autophagic vesicles (puncta) were analyzed by microscope for the indicated fluorescence colors. FCCP induces autophagy as visualized by an increase of mCherry+-only puncta because of GFP+ signal quench in autolysosome. Right panel: The autophagic index indicates the ratio of the number of mCherry+ puncta to GFP+ puncta. More than 90 cells from three single cell lines were analyzed. Statistics were performed using paired Student’s t-test. *P < .05; ***P < .001. (E) Western blot analysis of ATR-KD and PINK1-KD HCT116 cells after treatment with FCCP for 6 h for the indicated proteins. α-tubulin was used to control protein loading. n = 3.
Figure 5.
Figure 5.
ATR deletion alters mitochondrial respiration and induces ROS. (A) The accumulation of mitochondrial ROS was determined by flow cytometry analysis of MitoSox at 5 dpo. n = 4. (B) The mitochondrial ROS in ATR-KD and PINK1-KD HCT116 cells were analyzed by flow cytometry of Mitosox. n = 4. (C) Proteome changes in ATR-iKO pMEFs were analyzed using MS. Graphical representation of altered ETC complex (ETCC) in ATR-iKO pMEFs (refer to Supplementary File S1). Upregulated proteins are displayed in red and downregulated proteins in green. The color intensity reflects the value of changes in the complex. Three ATR-wild type and three ATR-iKO cell lines were analysed. (D) Western blot analysis of ETCC subunits in pMEFs. For the detection of ETCC I-V, a total OXPHOS rodent WB antibody cocktail was used. Vinculin was used to control the protein loading. (E) Quantification of the protein levels by ImageJ. n = 4. (F) Analysis of mitochondrial respiration of ATR-iKO pMEF at 5 dpo. The metabolic phenotype was generated from Cell Mito Stress Test using a Seahorse analyzer. The graphs show the OCR plotted against ECAR from the “basal” state into oligomycin treatment (ETCC-V inhibitor, “ATP synthase inhibited”) and FCCP uncoupling (“uncoupled”). n = 3. (G) The MMP was determined by flow cytometry analysis of DiOC6(3) at 5 dpo. n = 4. (H) The basal OCR and ECAR of ATR-FBΔ hippocampi were analyzed using a Seahorse XFe24 Analyzer. n = 4. (I) Western blot analysis of the indicated proteins in ATR-FBΔ and control hippocampi. β-actin was used to control protein loading. The right panel shows the quantification of the protein levels using ImageJ. n = 4. The error bars show SEM. Statistics were done using a two-tailed Student’s t-test. P-values are indicated within individual graphs.
Figure 6.
Figure 6.
Interaction of PINK1 and ATR is required for mitophagy initiation. (A) Schematic view of PINK1 full length and truncation mutants D1–D3. Abbreviations: mitochondrial targeting signal (MTS), transmembrane domain (TM), activation domain (AD), kinase domain (Ki), and C-terminus (CT). The amino acids (aa) of the border of the indicated domains are marked on the top of the full length PINK1 protein (FL). (B) FLAG-tagged empty vector (FLAG-EV), ATR wild type (FLAG-ATR-WT), GFP-tagged full length PINK1 (GFP-PINK1-FL), and the PINK1 domain truncation mutants D1–D3 were transfected into human HEK293T cells, respectively. Western blotting was performed on IPs of FLAG using the indicated antibodies. β-actin was used to control protein loading in input. Red arrow indicates the missing band of Co-IP of GFP-PINK1-D3. n = 3. (C) PLAs of FLAG-ATR-WT, GFP-PINK1-FL, and GFP-PINK1-D3 in human U2OS cells. Representative images of PLA-positive signals (red foci) are shown. Mitochondrial networks (gray) are visualized by MitoTracker staining. Yellow arrows marked PLA foci in the mitochondrial network (gray). Right panel: Quantification from 30 randomly chosen cells per group were performed manually. Error bars show SEM. Statistics are performed with a two-way ANOVA with a Tukey’s multiple comparisons test. n.s.: not significant. n = 3. (D) Western blot analysis of transiently transfection of FLAG-EV, GFP-PINK1-FL, and GFP-PINK1-D3 into RNAi-induced ATR-KD HCT116 cells following by 2 μM FCCP treatment for 6 h. The indicated proteins were analyzed by respective antibodies. Vinculin was used to control protein loading. n = 3. (E) Mitochondrial respiration analysis using a Cell Mito Stress Test of HCT116 cells after transfections with the indicated vectors. The basal respiration and ATP production were calculated from OCR datasets. n = 4. (F) The cytosolic ROS were determined by flow cytometry analysis after cells incubating with 2 μM 6-carboxy-2′,7′-dichlorodihydrofluorescein diacetate. n = 4. Error bars show SEM. The statistical analysis was performed using two-tailed t-test. P-values are indicated within individual graphs.
Figure 7.
Figure 7.
Cross talk of dysfunctional mitochondria and nuclear DDR in ATR-deleted cells. (A) Protein carbonylation was analyzed by western blotting in ATR-iKO pMEFs at 5 dpo and quantified using ImageJ. Oxidized proteins were detected via the incorporation of DNPH. β-actin is used to control protein loading. n = 5. (B) Brain lysates of 3-month-old ATR-FBΔ mice were analyzed by western blotting. Oxidized proteins were detected via the incorporation of DNPH. Ponceau S staining controls the protein loading. The quantification of carbonylated proteins was determined using ImageJ. n = 5. (C) Analysis of mtDNA damage in ATR-iKO pMEF at 5 dpo and 24 h after treatment with 10 μM of the ROS scavenger MitoT, 10 μM of the ROS inducer MitoPQ, 450 ng/ml of the mtDNA-damaging agent EtBr, and 0.2 mM of HU. mtDNA breaks were analyzed by PCR. The quantification of the 16-kb PCR product was performed using ImageJ. n = 3. (D) Western blotting of ATR-iKO pMEFs at 5 dpo (initiation phase of mitochondrial dysfunctions) and 8 dpo (post-mitochondrial dysfunctions) were treated 24 h before analysis with 0.2 mM HU, 10 μM MitoPQ (MP), 10 μM MitoT (MT), and 5 μM UK5099 (UK, MPC inhibitor). The indicated proteins were blotted by respective antibodies. β-actin was used to control protein loading. n = 3. (E) Mitophagy initiation assay in ATR-KD and PINK1-KD HCT116 cells after exposure to 0.5 mM HU for 24 h followed by western blotting of the indicated proteins. Vinculin was used to control protein loading. n = 3. (F) Mitochondrial respiration analysis of HCT116 cells treated with 0.5 mM HU for 24 h, using a Cell Mito Stress Test. n = 3. (G) Quantification of the basal respiration and ATP production of HCT116 cells were calculated from OCR (see panel F). n = 3. Error bars in all subfigures show SEM. The statistical analysis was performed using two-tailed t-test. P-values are indicated within individual graphs. n.s.: not significant.

References

    1. Awasthi P, Foiani M, Kumar A ATM and ATR signaling at a glance. J Cell Sci. 2015; 128:4255–62.10.1242/jcs.169730. - DOI - PubMed
    1. Blackford AN, Jackson SP ATM, ATR, and DNA-PK: the trinity at the heart of the DNA damage response. Mol Cell. 2017; 66:801–17.10.1016/j.molcel.2017.05.015. - DOI - PubMed
    1. Lanz MC, Dibitetto D, Smolka MB DNA damage kinase signaling: checkpoint and repair at 30 years. EMBO J. 2019; 38:e101801.10.15252/embj.2019101801. - DOI - PMC - PubMed
    1. Reczek CR, Chandel NS ROS-dependent signal transduction. Curr Opin Cell Biol. 2015; 33:8–13.10.1016/j.ceb.2014.09.010. - DOI - PMC - PubMed
    1. Vercellino I, Sazanov LA The assembly, regulation and function of the mitochondrial respiratory chain. Nat Rev Mol Cell Biol. 2022; 23:141–61.10.1038/s41580-021-00415-0. - DOI - PubMed

MeSH terms

Substances