. 2025 Jun 13;31(12):2426-2440.
doi: 10.1158/1078-0432.CCR-24-3936.

Reclassification of ATM Missense Variants of Uncertain Significance by Integrating Results from Systematic Functional Assays into an ACMG Points-Based Framework

Affiliations

Reclassification of ATM Missense Variants of Uncertain Significance by Integrating Results from Systematic Functional Assays into an ACMG Points-Based Framework

Helmut Hanenberg et al. Clin Cancer Res. .

Abstract

Purpose: ATM is a moderate-risk cancer susceptibility gene that harbors thousands of missense variants of uncertain significance (VUS) which limit the power of clinical genetic testing for cancer risk management and personalized medicine. Functional tests provide a valuable basis for testing the impact of variants but have been lacking for ATM.

Experimental design: We developed a systematic approach to functionally characterize missense ATM variants based on the correction of various DNA damage-related phenotypes via reexpression of ATM in either of two ATM-deficient human cell lines.

Results: A pKAP1 phospho-flow assay for ATM VUS observed in patients with hereditary cancer was calibrated using 48 benign and pathogenic controls, achieving 100% specificity and 97% sensitivity. This system distinguished 82 of 88 (93%) missense ATM VUS of the FATKIN region as functionally neutral or deleterious. Importantly, for the clinical classification of VUS, functional results were incorporated into an American College of Medical Genetics points-based framework, also considering conservation and properties of amino acids/substitutions, along with genetic data; 79 of 88 (90%) were thereby reclassified as benign/likely benign or pathogenic/likely pathogenic. As additional validation of our approach, clinical characteristics from a database of 1,134 patients with breast cancer were distinct for carriers of neutral versus deleterious ATM variants. Also, utilizing our functional results, we identified hotspots for deleterious VUS and controls at amino acids 2702-2730 and 2891-2951 of ATM.

Conclusions: We have established functional assays as a reliable tool that will better interpret the clinical impact of ATM variants and guide improved cancer prevention measures for carriers.


Conflict of interest statement

Conflict of Interest Statement: The authors declare no potential conflicts of interest

Figures

Fig. 1.
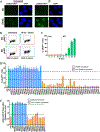
Fig. 1.. Stable expression of full-length ATM in ATM-deficient cells, and correction of ATM-dependent signaling, the G2 checkpoint and cellular sensitivity in response to IR.
A-B, Immunoblots as a measure of ATM expression (A) and cellular resistance to IR measured using a colony growth assay (B) in GM02052-T ATM-deficient fibroblasts, corrected with ATM, either with or without a N-terminal Flag-HA (FH) epitope tag, or lacking correction (Vec); for comparison, GM00038C-T (non-AT) fibroblasts were also tested and actin served as a loading control in A. Each value represents the mean ± standard deviation (SD) for assays performed in triplicate (B). C-E, Immunofluorescence microscopy to detect ATM autophosphorylation at S1981 (C), immunoblots to measure ATM activity against various substrates (D), and G2 checkpoint assays performed using flow cytometry (E), all in ATM-deficient IN1305T cells; these cells were reconstituted with the empty vector (Vec) or different forms of ATM. Cells were fixed 30 min after 5 Gy irradiation and a counterstain with DAPI shows the positions of nuclei in C. In D, FH-ATM was detected using an anti-HA antibody and an anti-ATM antibody, and for each ATM substrate a blot for both the phospho-form and total protein is shown. Cells were left untreated or were harvested 30 min after exposure to 10 Gy IR; actin is shown as a loading control. Based on quantification of immunoblots from three replicates, after irradiation, the ratios of pATM/ATM for the WT & two B/LB controls (see below) were significantly increased as compared to two P/LP controls (p<0.02) and were elevated as compared to the WT & two B/LB controls in untreated cells (p<0.05); similarly, following exposure to radiation, pKAP1/KAP1 ratios were significantly increased for the WT & two B/LB controls as compared to two P/LP controls (p=0.0007) and as compared to the WT & two B/LB controls in untreated populations (p<0.0003), where ATM and KAP1 represent total protein. In E, examples of dot plots showing mitotic cells (in the boxes) detected using a pS10-histone H3 antibody vs DNA content (left) and the % reduction in mitosis relative to untreated cells (right) are shown. In D-E, cells were reconstituted with the empty vector, WT ATM with or without a N-terminal FH tag, or with two B/LB (p.Ser1983Gln and p.Ile2030Val) or two P/LP (p.Val2424Gly and p.Gly2765Ser) control variants. Assays were performed in triplicate and values represent the mean ± standard deviation (SD) in E; values for cells reconstituted with Vec, p.Val2424Gly or p.Gly2765Ser were significantly different than for cells containing other forms of FH-ATM, p<0.005.
Fig. 2.
Fig. 2.. Development of a pKAP1 flow cytometric assay to assess the functional effects of ATM variants, and calibration with 100% specificity and 97% sensitivity utilizing benign and pathogenic controls.
A, Immunofluorescence microscopy comparing pS824-KAP1 signal in the nuclei of untreated ATM-deficient cells reconstituted with FH-WT ATM, or containing the empty vector (vec), and at 30 min after exposure to 5 Gy IR. B, Examples of dot plots of pS824-KAP1 signal vs DNA content detected via flow cytometry in ATM-deficient cells reconstituted with Vec or FH-WT ATM; pKAP1+ cells are in the boxes. C, The % positivity for pKAP1 (pKAP1+) in ATM-deficient cells reconstituted with the empty vector (Vec) or with FH-WT ATM at 30 min after exposure to different doses of IR (ranging from 0–15 Gy); each data point represents the mean ± SD of triplicate measures. As in D-E, cells containing Vec are shown in light red and WT ATM is in green. D, Validation and calibration of the pKAP1+ flow cytometric functional assay utilizing 17 missense benign controls (blue), proximal to or within the FATKIN domain of ATM, 22 pathogenic missense controls (orange), and 9 pathogenic truncations (purple); controls were selected from those reported frequently in ClinVar. Cutoffs, indicated by dashed lines, were set to the least active benign and most active pathogenic control other than p.Val2716Ala in D-E; p.Val2716Ala is intermediate because of overlap with individual values for p.Cys2464Arg in D. Low expressing, presumably unstable, variants are indicated by diagonal lines in the bars in D-E. In D-E, Vec and WT are running means of all experiments; all other values in D are the mean ± SD of at least two biological repeats each performed in triplicate (technical replicates). E, The LD50 from colony survival assays for ATM-deficient cells reconstituted with the empty vector (Vec), FH-WT ATM, and 8 distinct benign or 11 pathogenic missense controls, exposed to a range of doses of IR. All values except for Vec and WT are the mean ± SD of technical replicates performed in triplicate. ATM-deficient IN1305T cells were utilized in A-E.
Fig. 3.
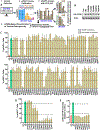
Fig. 3.. Utilization of a calibrated pKAP1 flow cytometric assay to assess the functional effects of 88 missense ATM VUS expressed in ATM-deficient cells.
A, Schematic outlining the process for functional characterization of VUS, including selection of variants from ClinVar, calibration of pKAP1 phospho-flow assays utilizing B/LB and P/LP controls, testing pKAP1 activities in IN1305T cells, and examining concordance in another ATM-deficient cell line or using an IR resistance assay. As diagrammed, pKAP1 phospho-flow results obtained in IN1305T cells were subsequently integrated into an ACMG-based framework to classify variant pathogenicity (in Fig. 4). B, Representative immunoblots demonstrating expression of WT and 5 missense VUS of ATM introduced into IN1305T cells. Extracts were loaded on an equal protein basis and actin is shown as a loading control. C, The % pKAP1+ from IN1305T ATM-deficient cells reconstituted with 88 ATM missense VUS of the FATKIN region, listed by position beginning at the N-terminal end. Cutoffs (indicated by dashed lines) for benign variants and pathogenic variants to identify neutral and full LoF (deleterious) variants, respectively, were imported from Fig. 2D. Variants with activities between the cutoffs were designated as intermediate. Low expressing, presumably unstable, variants are indicated by diagonal lines in the bars in C. Except for Vec and WT, which are running means of all experiments in C-D, all values are the mean ± SD of at least two biological repeats each performed in triplicate (technical repeats). D, Functional assay results, based on the % pKAP1+ cells, in a second ATM-deficient cell line (GM02052T) from an A-T patient, for a subset of variants tested in IN1305T cells in Fig. 3C. Cutoffs for benign and pathogenic variants to identify neutral [3], intermediate [3] and deleterious [7] VUS were imported from Supplementary Fig. S9. E, The LD50 from colony survival assays for IN1305T ATM-deficient cells reconstituted with the empty vector (Vec), FH-WT ATM, and 8 initial VUS identified as deleterious (full LoF) on the basis of pKAP1+ activities in Fig. 3C. Cutoffs were set in Fig. 2E; values equal to or above the upper cutoff, and equal to or below the lower cutoff, indicate neutral and full LoF (deleterious) activities, respectively.
Fig. 4.
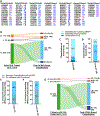
Fig. 4.. ACMG-based reclassification of the initial VUS set and controls as B/LB/LP/P, both with and without the inclusion of points for pKAP1 functional assays.
A, List of all initial VUS that were reclassified as B/LB/LP/P via ACMG guidelines with inclusion of pKAP1 functional results. The variants are identified here using the protein-based name, but the cDNA-based name is available in Table S2. B, A Sankey plot showing the reclassification, following ACMG guidelines, of 88 initial missense ATM VUS that tested neutral (N), intermediate (I) or deleterious (D), as likely pathogenic (LP), VUS, likely benign (LB) or benign (B); none of the initial VUS were reclassified as pathogenic (P), so this category is not shown. C-D, Distributions of the % of variants remaining unclassified following tabulation of all ACMG points, the % reclassified as B/LB/P/LP before points for pKAP1 functional assays were added, and the % requiring points from pKAP1 functional assays to enable reclassification as B/LB/LP/P for: (C) all 88 VUS in the study and (D) all 48 controls. E-F, Distributions of the percentages of variants that were classified as B, LB, LP or P without requiring the inclusion of any points from pKAP1 functional assays that either did or did not receive a stronger classification (from LB to B or LP to P) after points for the results from pKAP1 assays were added in for: (E) VUS in this study and (F) controls. G, A Sankey plot showing the number of the 413 breast cancer patients in the GC-HBOC who were carriers of VUS which we that tested as neutral (N), intermediate (I) or deleterious (D), which were reclassified as likely pathogenic (LP), VUS, likely benign (LB) or benign (B) following ACMG guidelines with inclusion of pKAP1 phospho-flow results; none of the initial VUS tested were reclassified as pathogenic (P), so this category is not shown.
Fig. 5.
Fig. 5.. Distribution of ATM variants, by functionality of VUS and/or classification of missense controls, to different positions in the FATKIN, and location of select VUS testing deleterious and/or pathogenic controls based on the 3D structure of human ATM.
A, An enlargement of the FAT and Kinase domains that compose the FATKIN region, in which nearly all variants in this study were located. The positions, relative to the FATKIN, are shown for the 17 benign controls (Benign) in green (except p.Asp1853Asn, p.Asp1853Val and p.Arg1898Gln which are just before the FAT domain), the 22 pathogenic missense controls (Pathog.) in orange, the 72 neutral VUS (Neutral) in blue, and the 10 deleterious (full LoF) (Deleterious) VUS in red. B, Overall ribbon diagram of the ATM dimer (left panel) showing the solenoid domain (light blue) that includes the Pincer and Spiral regions, the FAT domain (pink), and the kinase domain (grey) [based on (27)]. The kinase is shown in the right panel with regions 2702–2730 (in the N lobe) and 2891–2951 (in the C lobe) in black where pathogenic missense controls and initial VUS that tested deleterious are enriched. Amino acids affected by pathogenic missense variants and initial VUS that tested deleterious in aa 2702–2730 and aa 2891–2951 are shown in red stick and dotted van der Waals sphere representations (B-D). C, Close-up view of 6 VUS that tested deleterious, and missense pathogenic controls, within aa 2702–2730 in the N lobe of the kinase domain (a portion of the C-lobe is seen at the lower right). The β4 and β5 strands and α3 helix within aa 2702–2730 are shown along with their positions relative to the ATP binding loop (light green) and the active site of the kinase. D, Closeup view of 7 VUS that tested deleterious, as well as missense pathogenic controls, within aa 2891–2951 of the C lobe of the kinase domain. This includes the activation loop, and the α7, α8 and α9 helices [based on (43)]; the proximity between these components and also with the nearby PRD subdomain (yellow) is made evident in this model.

References

    1. Savitsky K, Bar-Shira A, Gilad S, Rotman G, Ziv Y, Vanagaite L, et al. A single ataxia telangiectasia gene with a product similar to PI-3 kinase. Science 1995;268:1749–53 - PubMed
    1. Shiloh Y, Ziv Y. The ATM protein kinase: regulating the cellular response to genotoxic stress, and more. Nat Rev Mol Cell Biol 2013;14:197–210 - PubMed
    1. Rothblum-Oviatt C, Wright J, Lefton-Greif MA, McGrath-Morrow SA, Crawford TO, Lederman HM. Ataxia telangiectasia: a review. Orphanet J Rare Dis 2016;11:159. - PMC - PubMed
    1. Reiman A, Srinivasan V, Barone G, Last JI, Wootton LL, Davies EG, et al. Lymphoid tumours and breast cancer in ataxia telangiectasia; substantial protective effect of residual ATM kinase activity against childhood tumours. Br J Cancer 2011;105:586–91 - PMC - PubMed
    1. Thompson D, Duedal S, Kirner J, McGuffog L, Last J, Reiman A, et al. Cancer risks and mortality in heterozygous ATM mutation carriers. J Natl Cancer Inst 2005;97:813–22 - PubMed

MeSH terms

Substances