. 2025 Mar 19;56(2):110.
doi: 10.1007/s10735-025-10388-5.

Serum proteomic profiling reveals potential predictive indicators for coronary artery calcification in stable ischemic heart disease

Affiliations

Serum proteomic profiling reveals potential predictive indicators for coronary artery calcification in stable ischemic heart disease

Haiyan Wu et al. J Mol Histol. .

Abstract

Coronary artery calcification (CAC) is a common complication in patients with stable ischemic heart disease (SIHD). However, the early diagnosis and understanding of the pathogenesis of CAC in SIHD patients remain underdeveloped. This study aimed to analyze aberrant alterations in the serum proteome of SIHD patients, as well as SIHD patients with severe CAC (CAC_SIHD), and to explore the potential risk factors of CAC in SIHD patients. Serum proteomic profiles were obtained from individuals with SIHD (n = 6), CAC_SIHD (n = 6), and healthy controls (n = 9), and were analyzed using nano liquid chromatography tandem mass spectrometry (LC-MS/MS). The aberrant alterations in proteins and immune cells in the serum of SIHD and CAC_SIHD patients were characterized through differential protein expression analysis and single-sample gene set enrichment analysis analysis, respectively. Differentially expressed proteins (DEPs) were further subjected to gene ontology functional enrichment and Kyoto Encyclopedia of Genes and Genomes pathway enrichment analyses. Finally, Receiver Operating Characteristic analysis was performed on the DEPs between SIHD and CAC_SIHD to identify potential predictive factors of CAC. Abnormalities in multiple complement pathways and lipid metabolism were observed in SIHD and CAC_SIHD patients. Moreover, SIHD and CAC_SIHD were characterized by an increased presence of T cells and natural killer cells, along with a reduced presence of B cells. Subsequent analysis of serum proteins revealed that RNASE1 and MSLN may be potential predictive indicators for the early detection and diagnosis of CAC in SIHD patients. In conclusion, our research extensively examined the variations in serum proteins in patients with SIHD and CAC_SIHD, identifying key indicators and metabolic pathways associated with these conditions. These findings not only provide new insights into the pathological mechanisms of SIHD and CAC_SIHD, but also suggest potential factors for the early diagnosis of CAC in SIHD patients, which imply potential clinical applications.

Keywords: Coronary artery calcification (CAC); Ischemic heart disease (SIHD); MSLN; Proteomic; RNASE1.


Conflict of interest statement

Declarations. Ethics approval and consent to participate: The study was granted with the approval of the ethical committee of the First People’s Hospital of Yunnan Province (2016LH083) and conform the relevant ethical guidelines for human and animal research. Written informed consent has been obtained from the patient(s) to publish this paper. Conflict of interest: The authors declare no competing interests.

Figures

Fig. 1
Fig. 1
Serum parameters of the study population. LDL-C low-density lipoprotein cholesterol, CHOL total cholesterol, TG triglycerides, BUN blood urea nitrogen, SBP systolic blood pressure, Cr creatinine, UA uric acid, Ca calcium, GLU fasting glucose, DBP diastolic blood pressure. Note: p < 0.05 was considered statistically significant
Fig. 2
Fig. 2
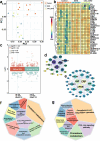
Overview of the proteomic data for the SIHD, CAC_SIHD, and control groups. a Principal component analysis (PCA) of proteomic data for SIHD, CAC_SIHD, and Control groups. b Heatmap showing the expression of crucial proteins among the three groups, identified using analysis of variance (ANOVA) (p < 0.01). c Volcano plot of differentially expressed proteins (DEPs) between the control and patient groups. Red color represents upregulation, while green represents downregulation. Screening criteria are |log2FC|≥ 0.5 and p < 0.05. d Interaction network of DEPs between the control and SIHD groups. The size of the circles represents the number of lines linked to each node. e Interaction network of DEPs between the control and CAC_SIHD groups. f KEGG functional analysis of DEPs identified between the control and SIHD groups. g KEGG pathway analysis of DEPs identified between the control and CAC_SIHD groups
Fig. 3
Fig. 3
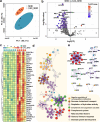
Expression profiling and functional analysis of DEPs between SIHD and CAC_SIHD. a PCA results of proteome showing a substantial distinction between SIHD and CAC_SIHD. b Volcano plot demonstrating DEPs between SIHD and CAC_SIHD. c Heatmap showing the expression of top 37 DEPs between SIHD and CAC_SIHD. d Gene oncology (GO) functional network enrichment of DEPs between SIHD and CAC_SIHD. e Molecular Complex Detection (MCODE) identified six crucial sub-networks between SIHD and CAC_SIHD
Fig. 4
Fig. 4
K-means cluster analysis and functional analysis of all proteins across the three groups. af The left panel displays the k-means cluster analysis of DEPs, highlighting modules with markedly distinct patterns. The right panel shows the results of KEGG enrichment analysis. g Heatmap illustrating the proteomic profiles associated with lipid metabolism across groups. h Heatmap demonstrating the proteomic profiles associated with immune responses across groups
Fig. 5
Fig. 5
SHID and CAC_SIHD patients exhibited distinct immune responses. a Heatmap of immune-related processes and cell types based on single-sample gene set enrichment analysis (ssGSEA). b Violin plots of specific immune cell subsets
Fig. 6
Fig. 6
Metabolic dynamics analysis of SIHD and CAC_SIHD patients. a Metabolic profiles in control, SIHD, and CAC_SIHD groups based on ssGSEA. b Top four significantly altered metabolic pathways identified via ANOVA
Fig. 7
Fig. 7
Receiver operating characteristic (ROC) analysis and evaluation of the expression of candidate proteins. a Receiver Operating Characteristic (ROC) curves depicting the diagnostic performance of seven proteins as potential predictive indicators in discriminating CAC in SIHD patients. b Relative expression of the seven proteins in SIHD and CAC_SIHD group
Fig. 8
Fig. 8
Pearson correlation analysis between clinical characteristics and crucial DEPs with p < 0.01 by ANOVA

References

    1. Alexopoulos N, Raggi P (2009) Calcification in atherosclerosis. Nat Rev Cardiol 6(11):681–688 - PubMed
    1. Bakhshian Nik A, Hutcheson JD, Aikawa E (2017) Extracellular vesicles as mediators of cardiovascular calcification. Front Cardiovasc Med 4:78 - PMC - PubMed
    1. Basak T, Tanwar VS, Bhardwaj G, Bhardwaj N, Ahmad S, Garg GVS, Karthikeyan G, Seth S, Sengupta S (2016) Plasma proteomic analysis of stable coronary artery disease indicates impairment of reverse cholesterol pathway. Sci Rep 6:28042 - PMC - PubMed
    1. Bharadwaj U, Marin-Muller C, Li M, Chen C, Yao Q (2011) Mesothelin confers pancreatic cancer cell resistance to TNF-α-induced apoptosis through Akt/PI3K/NF-κB activation and IL-6/Mcl-1 overexpression. Mol Cancer 10:106 - PMC - PubMed
    1. Blaha M, Budoff MJ, Shaw LJ, Khosa F, Rumberger JA, Berman D, Callister T, Raggi P, Blumenthal RS, Nasir K (2009) Absence of coronary artery calcification and all-cause mortality. JACC Cardiovasc Imaging 2(6):692–700 - PubMed

LinkOut - more resources